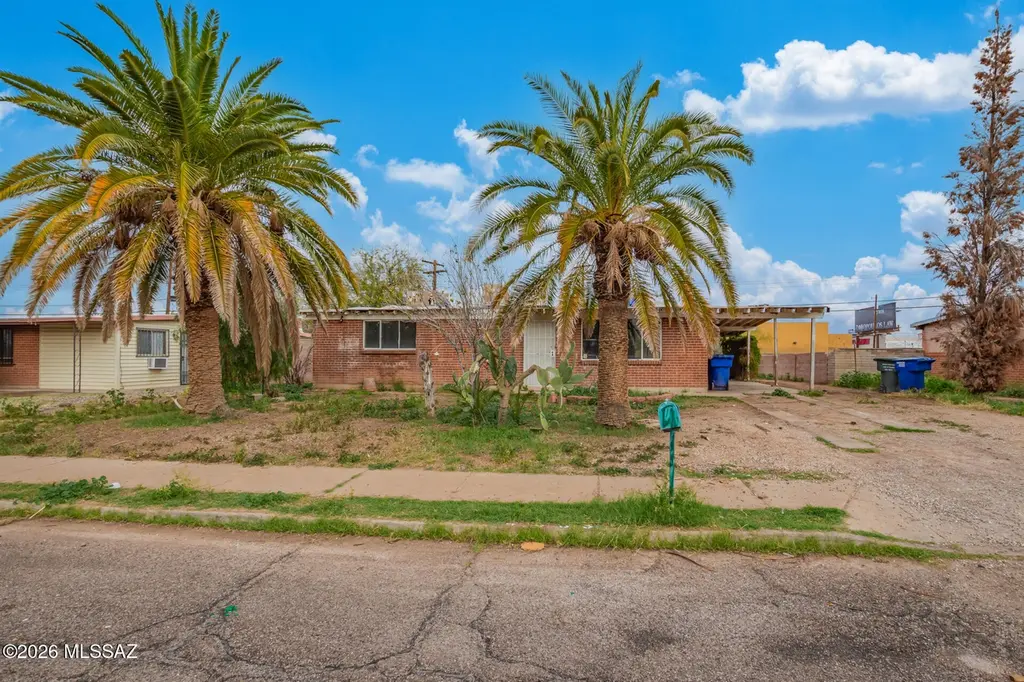
4833 E 23rd St · Tucson, AZ
Flood risk 1/10 · Minimal
- FEMA flood zone
- X (unshaded)
- Chance of flooding over 30 yrs
- 0.0%
- Est. flood insurance / yr
- $507 – $1,088
Fire risk 1/10 · Minimal
- Est. fire insurance / yr
- $610 – $1,132
Heat risk 8/10 · Major
- Hot days now (above 105°F)
- 7 days/yr
- Hot days in 30 yrs
- 18 days/yr
Wind risk 1/10 · Minimal
- Chance of severe wind over 30 yrs
- —
Air-quality risk 1/10 · Minimal
- Unhealthy air days now
- 0 days/yr
- Unhealthy air days in 30 yrs
- 0 days/yr
Risk factors via First Street. Map © Google.
Why this score? — see what drove the C+ grade
The composite is a weighted blend of 9 inputs, each scored 0–100. Each bar is that input's sub-score; the figure is the points it added to the 100-point composite (weight × sub-score).
- Cash flow +23.2/30.0
- ARV discount +15.0/15.0
- DSCR +7.4/10.0
- 1% rule +5.4/10.0
- Livability +3.7/5.0
- Rent growth +3.2/5.0
- Condition / age +2.5/5.0
- Schools +1.6/10.0
- Appreciation +0.0/10.0
$139,900
🖨 Deal sheet 📄 Offer letter ✓ Due diligence
Listing remarks MLS
Gutted 2 bed, 2 bath opportunity with a flexible layout that easily converts to a 3 bed, 2 bath. Ideal for investors seeking a value-add project with clear upside. Open floor plan, blank canvas interior, and strong potential to reconfigure for increased ARV and rental returns..Seller will not entertain wholesale offers. Please do not submit wholesale proposals.
Key facts
- 6,752 sq ft lot
- Garage
- Built 1959
Neighborhood map
What this means for you Summary
Snapshot
- This is a 3-bed/2.0-bath single-family listed at $140k.
Deal economics
- At list price, monthly cash flow is $252 ($3k/yr) — positive.
- The deal already cash-flows at list — no discount required.
- Meets the 1% rule at list price ($1k rent vs $140k).
- Recommended offer: $132k (6.0% below list) — sets the bar for market timing.
- Cap rate 8.5% vs local median 3.7% in Tucson — top-decile yield for the area; either an underpriced asset or a hidden risk that comps aren't pricing in. Stress-test before assuming the spread holds.
Location & tenants
- Location reads 74/100 on livability (#17 in AZ, #4,502 nationally) — a middle-class / working-renter tenant base. Strengths: commute A+, cost of living A+, housing A+; Watch: health & safety C-, schools D+, crime F.
- Tucson Unified District (4403) (urban): math 14% / reading 23% proficiency, ranked #190 of 249 in AZ (top 76%) — low school quality limits family demand, transient renter base, plan for 1-2y turnover.
- Market conditions: Rents rising (+2.6%/yr); 153 active listings in the ZIP; 40 comparable units currently listed for rent nearby; rentals at typical pace (median 24d on market — plan ~3-4 weeks tenant-placement turnaround); 45% of comp listings sitting > 30 days — soft ceiling on asking rent; 5,268 units permitted in Pima County in 2024 (996 in 5+ unit buildings).
- This rent runs 31% of the median local income ($56k/yr) — at the standard rent-burdened threshold; future hikes will face affordability resistance.
Forward outlook
- Local home prices are declining (-3.0%/yr); year-one equity from $967 of loan paydown is wiped out by about $4k of value loss. Plan a longer hold.
- Pima County population projected at +8% by 2050 — modest demand growth; plan on rents tracking national, not racing it.
Negotiation context
- It's been on market 69 days — a 6% lower offer ($132k) is reasonable based on typical stale-listing flexibility.
- 2 sale attempts with the ask held roughly flat each time — persistent listings suggest the price (not the market) is what's stuck; bring a comps-based counter.
- Current owner paid $111k; 26% above their basis — modest negotiation headroom, anchor on the comps not their cost.
Risks & watch-outs
- Watch-outs: built in 1959 — expect roof / HVAC / electrical / plumbing capex.
- Climate carrying-cost: extreme-heat days projected 7→18/yr by 2055 (HVAC capex compounding) — expect insurance premiums to compound above CPI over the hold.
Questions for the listing agent
- It's been on market 69 days. Have you received any prior offers? Is the seller open to a 6% concession, seller financing, or rate buy-down credit?
- Built in 1959 — when were the roof, HVAC, electrical panel, plumbing, and water heater last replaced?
- Why hasn't it sold? Are there any deal-killer items the seller is aware of (foundation, flood, title, zoning, code violations)?
- Is there a deadline driving the sale (1031 exchange, divorce, estate, relocation)? That informs how much negotiation room exists.
- Schools are D-rated, which usually means shorter tenancies and higher turnover. Who's the typical renter profile here, and what's been the actual vacancy rate?
- Crime grade is F in this area — have there been break-ins, vandalism, or insurance claims at this property in the last 3 years? What carrier currently insures it and at what premium?
- What's the average days-on-market for RENTAL listings here right now (not sales)? A rising rental-DOM trend means longer vacancies and softer asking-rent achievability than the comps imply.
- What's the recent tenant-quality profile in this submarket — average credit score on applications, eviction rate, late-payment / NSF rate, and stable-employment percentage? A property-management company in the area should have these aggregated.
- How much new for-sale + rental construction is in the pipeline within 1–3 miles? Heavy new supply typically softens prices + rents 12–24 months out; constrained supply supports both.
Investment metrics
- 1% rule
- 1.04% ✓
- Cap rate
- 8.46%
- Cash-on-cash
- 7.73%
- DSCR
- 1.34
- GRM
- 8.0
CMA / ARV
- ARV (median comp)
- $242,669
- List price
- $139,900
- Delta
- -42.35%
- Verdict
- UNDERPRICED
- Comps
- 20 within 1.0 mi
Show comp detail 12 sales within ~0.75 mi
| Address | Dist | Beds/Ba | Sqft | Sold | Price | $/sf | Match |
|---|---|---|---|---|---|---|---|
| 4818 E 25th St | 0.14mi | 3/2.0 | 1,070 (-1%) | 3mo | $238,000 | $222 | 89 |
| 4809 E 26th St | 0.22mi | 3/2.0 | 1,160 (+7%) | 1mo | $273,000 | $235 | 77 |
| 4626 E 26th St | 0.39mi | 3/1.5 | 984 (-9%) | 1mo | $220,000 | $224 | 64 |
| 4774 E Andrew St | 0.21mi | 2/1.0 (-1) | 943 (-13%) | 0mo | $220,000 | $233 | 60 |
| 5202 E 24th St | 0.41mi | 3/2.0 | 1,200 (+11%) | 5mo | $280,000 | $233 | 58 |
| 5018 E 18th St | 0.46mi | 2/1.0 (-1) | 995 (-8%) | 1mo | $150,000 | $151 | 56 |
| 5150 E 23rd St | 0.37mi | 2/1.0 (-1) | 940 (-13%) | 6mo | $215,000 | $229 | 47 |
| 4541 E 31st St | 0.71mi | 3/1.5 | 972 (-10%) | 3mo | $250,000 | $257 | 46 |
| 909 S Catalina Ave | 0.66mi | 3/1.0 | 1,193 (+10%) | 5mo | $272,000 | $228 | 44 |
| 824 S Catalina Ave | 0.70mi | 3/1.0 | 1,195 (+10%) | 6mo | $225,000 | $188 | 41 |
| 2018 S Cloverland Ave | 0.72mi | 3/1.0 | 936 (-13%) | 3mo | $229,900 | $246 | 38 |
| 5402 E 28th St | 0.74mi | 3/1.0 | 920 (-15%) | 5mo | $265,000 | $288 | 32 |
Match score weights: distance 35% · size 25% · config 20% · recency 20%. Top-matched comps best support the ARV.
Projected returns pro-forma
-3.0% appreciation · 2.61% rent growth · sell at horizon
- IRR
- -4.9%
- Equity multiple
- 0.82×
- Total profit
- $-7,194
- Equity at exit
- $20,860
- IRR
- 4.3%
- Equity multiple
- 1.31×
- Total profit
- $12,022
- Equity at exit
- $12,096
Cash invested: $39,172 (down + closing). Projections, not guarantees.
Landlord ↔ Tenant lean methodology
- Overall (STATE)
- 87 Strongly Landlord-Friendly
- State Arizona
- 87 Strongly Landlord-Friendly · R+3
- County
- — inherits STATE
- City
- — inherits STATE
ZIP-level market 85711
- Rents YoY
- 2.6%
- Active inventory
- 153
- Price-to-rent
- 8.0×
Monthly cashflow live
- Estimated rent
- $1,453 high interval (Pro) →
- Mortgage (P&I)
- −$734
- Tax from tax record
- −$103 /mo · $1,240/yr
- Insurance
- −$58
- HOA
- −$0
- Vacancy / Maint / Mgmt
- −$305
- Net cashflow
- $252
Break-even live
UW: 25.0% down · 7.5% · 30yr · 1.5% tax · 5.0% vac · 8.0% maint · 8.0% mgmt
Financing live
Cash to close
- Down payment
- $34,975
- Closing costs
- $4,197
- Reserves months
- —
- Total cash needed
- —
Loan-product check · same deal, 3 products live
Conventional
25% down · 7.5% · 30yr
- Down + closing
- —
- Monthly P&I
- —
- Monthly cashflow
- —
- DSCR
- —
- Eligible?
- —
Personal DTI + credit; lowest rate.
DSCR
20% down · 8.5% · 30yr
- Down + closing
- —
- Monthly P&I
- —
- Monthly cashflow
- —
- DSCR
- —
- Eligible?
- —
No personal income docs; deal must DSCR.
Hard money
10% down · 12.0% · 12mo
- Down + closing
- —
- Monthly P&I
- —
- Monthly cashflow
- —
- DSCR
- —
- Eligible?
- —
Short-term bridge; refi at stabilization.
Rent comps 40 comps
| Address | Beds | Baths | Sqft | Rent | $/sqft | DOM | Units | Dist |
|---|---|---|---|---|---|---|---|---|
| 4910 E 25th St Tucson, AZ | 3.0 | 2.0 | 960 | $1,550 | $1.61 | 16d | 1 | 0.15mi |
| 4725 E 25th St Tucson, AZ | 3.0 | 2.0 | 1400 | $1,700 | $1.21 | 43d | 1 | 0.23mi |
| 4825 E 18th St Tucson, AZ | 2.0 | 1.0 | 964 | $1,800 | $1.87 | 43d | 1 | 0.42mi |
| 4633 E 19th St Tucson, AZ | 3.0 | 1.0 | 1000 | $1,300 | $1.30 | 43d | 1 | 0.44mi |
| 5237 E 20th St Tucson, AZ | 3.0 | 1.0 | 1100 | $1,850 | $1.68 | 43d | 1 | 0.48mi |
| 5121 E 29th St Tucson, AZ | 1.0–2.0 | 1.0 | 600 | $939 | $1.56 | 43d | 1 | 0.51mi |
| 4511 E 26th St Tucson, AZ | 3.0 | 2.0 | 984 | $1,800 | $1.83 | 14d | 1 | 0.51mi |
| 4634 E Montecito St Tucson, AZ | 3.0 | 1.0 | 1000 | $1,375 | $1.38 | 3d | 1 | 0.55mi |
| 4431 E 22nd St Tucson, AZ | 1.0–2.0 | 1.0 | 770 | $1,081 | $1.40 | 43d | 2 | 0.58mi |
| 4557 E 18th St Tucson, AZ | 2.0 | 1.0 | 731 | $900 | $1.23 | 23d | 1 | 0.59mi |
| 525 S Rosemont Ave Tucson, AZ | 4.0 | 2.0 | 1410 | $1,795 | $1.27 | 15d | 1 | 0.60mi |
| 4502 E 18th St Tucson, AZ | 2.0 | 1.0 | 750 | $1,050 | $1.40 | 23d | 1 | 0.64mi |
| 4525 E Montecito St Tucson, AZ | 2.0 | 1.0 | 750 | $975 | $1.30 | 11d | 1 | 0.67mi |
| 1828 S Math Quiz Dr Tucson, AZ | 2.0 | 2.0 | 1041 | $1,595 | $1.53 | 43d | 1 | 0.69mi |
| 1401 S Woodland Ave Unit 1401 Tucson, AZ | 2.0 | 1.0 | 830 | $700 | $0.84 | 23d | 1 | 0.70mi |
| 1505 S Woodland Ave Unit B Tucson, AZ | 2.0 | 1.0 | 757 | $995 | $1.31 | 43d | 1 | 0.72mi |
| 1503 S Woodland Ave Unit B Tucson, AZ | 2.0 | 1.0 | 737 | $1,050 | $1.42 | 43d | 1 | 0.73mi |
| 1501 S Woodland Ave Tucson, AZ | 2.0 | 1.0 | 608 | $949 | $1.56 | 43d | 4 | 0.73mi |
| 1501 S Woodland Ave Unit B Tucson, AZ | 2.0 | 1.0 | 737 | $949 | $1.29 | 23d | 1 | 0.73mi |
| 1507 S Woodland Ave Unit A Tucson, AZ | 2.0 | 1.0 | 737 | $995 | $1.35 | 43d | 1 | 0.73mi |
| 5237 E Calle Vista de Colores Tucson, AZ | 2.0 | 2.5 | 1452 | $1,995 | $1.37 | 16d | 1 | 0.75mi |
| 5050 E Julia St Tucson, AZ | 2.0 | 2.0 | 1410 | $2,295 | $1.63 | 23d | 1 | 0.78mi |
| 5304 E Calle Vista de Colores Tucson, AZ | 2.0 | 2.5 | 1452 | $1,695 | $1.17 | 16d | 1 | 0.78mi |
| 4649 E 14th St Tucson, AZ | 3.0 | 1.0 | 1192 | $1,545 | $1.30 | 11d | 1 | 0.87mi |
| 1704 S Jefferson Ave Unit WI1710-6 Tucson, AZ | 2.0 | 1.0 | 750 | $995 | $1.33 | 43d | 1 | 0.89mi |
| 5402 E 30th St Unit B03 Tucson, AZ | 3.0 | 1.5 | 1178 | $1,250 | $1.06 | 43d | 1 | 0.89mi |
| 5402 E 30th St Apt E1 Tucson, AZ | 4.0 | 1.5 | 1400 | $1,530 | $1.09 | 43d | 1 | 0.89mi |
| 5402 E 30th St Apt J11 Tucson, AZ | 2.0 | 1.5 | 941 | $950 | $1.01 | 43d | 1 | 0.89mi |
| 4255 E 29th St Tucson, AZ | 2.0 | 1.0 | 585 | $999 | $1.71 | 3d | 7 | 0.89mi |
| 4641 E 13th St Tucson, AZ | 3.0 | 2.0 | 1403 | $1,650 | $1.18 | 43d | 1 | 0.92mi |
| 5547 E 29th St Unit 1 Tucson, AZ | 3.0 | 1.5 | 1175 | $995 | $0.85 | 10d | 1 | 0.93mi |
| 5402 E 30th St Unit F06 Tucson, AZ | 3.0 | 1.5 | 1178 | $1,250 | $1.06 | 23d | 1 | 0.94mi |
| 5400 E Williams Blvd Tucson, AZ | 1.0–2.0 | 1.0–2.0 | 915 | $1,800 | $1.97 | 3d | 1 | 0.94mi |
| 5624 E 18th St Tucson, AZ | 3.0 | 2.0 | 1458 | $2,300 | $1.58 | 19d | 1 | 0.95mi |
| 601 S Bryant Ave Tucson, AZ | 2.0 | 1.0 | 1004 | $1,300 | $1.29 | 11d | 1 | 0.99mi |
| 5674 E Eastland St Tucson, AZ | 3.0 | 2.0 | 1431 | $1,645 | $1.15 | 43d | 1 | 1.01mi |
| 5723 E 19th St Tucson, AZ | 3.0 | 2.0 | 1211 | $2,350 | $1.94 | 43d | 1 | 1.05mi |
| 5706 E 24th St Tucson, AZ | 2.0 | 1.0 | 784 | $1,250 | $1.59 | 11d | 1 | 1.05mi |
| 1841 S Irving Ave Unit 13 Tucson, AZ | 2.0 | 1.0 | 900 | $675 | $0.75 | 16d | 1 | 1.05mi |
| 460 S Bryant Ave Tucson, AZ | 2.0 | 2.0 | 800 | $995 | $1.24 | 23d | 1 | 1.07mi |
Listing history 20 events
-
2026-06-18days on market $139,900 Active 69 DOM
-
2026-06-17days on market $139,900 Active 68 DOM
-
2026-06-16days on market $139,900 Active 67 DOM
-
2026-06-15days on market $139,900 Active 66 DOM
-
2026-06-13days on market $139,900 Active 64 DOM
-
2026-06-10days on market $139,900 Active 61 DOM
-
2026-06-09days on market $139,900 Active 60 DOM
-
2026-06-08days on market $139,900 Active 59 DOM
-
2026-06-07days on market $139,900 Active 58 DOM
-
2026-06-05days on market $139,900 Active 55 DOM
-
2026-06-03days on market $139,900 Active 54 DOM
-
2026-06-02days on market $139,900 Active 53 DOM
-
2026-06-01days on market $139,900 Active 52 DOM
-
2026-05-31days on market $139,900 Active 51 DOM
-
2026-04-10$139,900 Active 363-char remark
Show marketing remark (363 chars)
Gutted 2 bed, 2 bath opportunity with a flexible layout that easily converts to a 3 bed, 2 bath. Ideal for investors seeking a value-add project with clear upside. Open floor plan, blank canvas interior, and strong potential to reconfigure for increased ARV and rental returns..Seller will not entertain wholesale offers. Please do not submit wholesale proposals.
-
2026-03-13historical
-
2026-02-20$154,900 Active
-
2026-02-05soldstatus $111,299
-
1987-09-30soldstatus $36,000
-
1987-09-01soldstatus $36,000
ⓘ Source: listings_history table (triggers on properties + properties_extension) + one-shot
backfill from property_details.listing_events for pre-trigger history.
Tax reassessment forecast AZ · Resets to sale price
- Current annual tax
- $1,240 · $103/mo
- Projected year-2 tax
- $1,240 · $103/mo
- Expected delta
- $0/yr ($0/mo · 0.0%)
ⓘ Screening estimate from a state-policy table — verify with the county assessor before closing.
Climate risk First Street
- Flood 1/10 Low FEMA zone X (unshaded) · 0% chance over 30 yrs
- Wildfire 1/10 Low
- Heat 8/10 Severe 7 d/yr ≥105°F today · 18 d/yr by 30 yrs out
- Wind 1/10 Low
- Air quality 1/10 Low 0 unhealthy d/yr today · 0 by 30 yrs out
Nearby sold comps map
Loading sold comps map…
Walkable amenities ~0.75 mi
Loading nearby amenities…
Taxation est. · year 1
- Rental income
- $17,431
- − Mortgage interest
- −$7,837
- − Property taxes
- −$1,240
- − Insurance
- −$700
- − Repairs & maintenance
- −$1,394
- − Management
- −$1,394
- − Depreciation
- −$4,070
- Taxable income
- $796
- Est. tax owed @ 24.0%
- −$191
- After-tax cash flow
- $2,836/yr
For passive investors: Depreciation is non-cash, so a rental often shows a tax loss while cash-flowing — sheltering income. Rental losses are passive: they offset passive income freely, and up to $25,000/yr can offset ordinary (W-2) income if you actively participate and your MAGI is under $100k (phasing out to $0 by $150k); unused losses carry forward. On sale, claimed depreciation is recaptured at up to 25%, and gains may owe capital-gains tax (a 1031 exchange can defer both). Figures are a year-1 estimate at your 24.0% rate — not tax advice; consult a CPA.
Schools (NCES district)
- District
- Tucson Unified District (4403)
- NCES district ID
- 0408800
- Math proficiency
- 14% ▼ -17.00%
- Reading proficiency
- 23% ▼ -11.00%
- Median HH income
- $40,962
- Composite
- 15.78/100
- National rank
- #9270
- State rank
- #190 of 249 in AZ
Livability — Tucson
- Score
- 74/100
- State rank
- #17
- US rank
- #4502
Category grades
Schools grade is shown separately in the Schools card above.
Census & demographics
- Census place
- Tucson, AZ
- County
- Pima County · 1,012,107 people
- City population
- 839,336
- Metro
- Tucson, AZ
- Population (ZIP)
- 42,558
- Household income
- $56,121
- Rent vs Own
- Severe rent burden
- 2616.0
Population outlook (Pima County) Hauer SSP2
- Today (2025)
- 1,066,056 people
- By 2030
- 1,086,684 · +1.9%
- By 2040
- 1,117,160 · +4.8%
- By 2050
- 1,149,778 · +7.9%
- By 2075
- 1,271,480 · +19.3%
- By 2100
- 1,321,160 · +23.9%
Race, ethnicity, and origin ACS 2023
- Neighborhood character
- Diverse neighborhood (Simpson 0.64)
- Race & ethnicity
- White 45% Hispanic / Latino 39% Two or more races 21% Black 6% Asian 3% Native American 3%
- Hispanic origin (detail)
- Mexican 36%
- Common ancestry
- Lithuanian 2% Romanian 2% Italian 2%
- Foreign-born
- 12% · Canada, China, Vietnam
- Languages at home
- 75% English-only · Spanish 19% Other Indo-European 1% Other Asian/Pacific 1%
Political lean MEDSL · Pima
- 2024 margin
- D (+15.2) · D 57.0% · R 41.8% · Other 1.2%
- 2008→2024 swing
- +9.1pp toward D · 2008: 6.1pp · 2024: 15.2pp
- All cycles
- 2024: D+15.2 2020: D+18.7 2016: D+13.5 2012: D+5.8 2008: D+6.1
Not yet ingested
- Civics
- —
Market trends
- HPI YoY
- ▼ -368.96%
- Current HPI
- 285.6805
- Rent YoY
- ▲ 2.61%
- Metro
- Tucson, AZ
- State GDP YoY
- ▲ 4.54%
- F500 in state
- 20
Industry mix (Fortune 500 HQ in AZ)
| Industry | F500 HQs | Revenue |
|---|---|---|
| Technology | 2 | $13B |
|
||
| Mining / Metals | 1 | $23B |
|
||
| Environmental Services | 1 | $16B |
|
||
| Metals / Steel | 1 | $14B |
|
||
| Technology Distribution | 1 | $9B |
|
||
| Homebuilding | 1 | $8B |
|
||
Price history
+288.6% since first listed6 events — show timeline
- 2026-04-10 Listed $139,900 MLSSAZ
- 2026-03-13 Listing Removed — MLSSAZ
- 2026-02-20 Listed $154,900 MLSSAZ
- 2026-02-05 Sold (Public Records) $111,299 Public Records
- 1987-09-30 Sold (Public Records) $36,000 Public Records
- 1987-09-01 Sold (Public Records) $36,000 Public Records
Property tax history
+1.6%/yrLatest (2025): $1,240 · +4.4% YoY. Source: county tax records.
Cash-flow waterfall
monthlySold comps — $/sqft
last 12 mo · ≤1 miLoading sold comps…