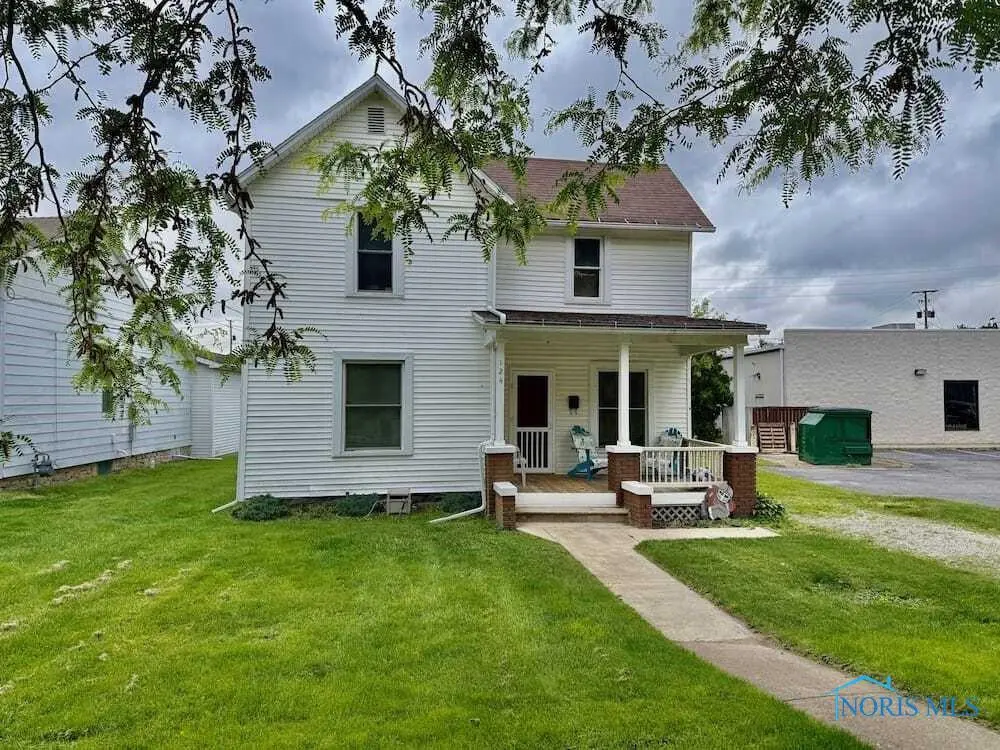
124 Morrison St · Fremont, OH
Flood risk 5/10 · Moderate
- FEMA flood zone
- X (unshaded)
- Chance of flooding over 30 yrs
- 0.51%
- Est. flood insurance / yr
- $473 – $860
Fire risk 1/10 · Minimal
- Est. fire insurance / yr
- $713 – $1,323
Heat risk 3/10 · Minor
- Hot days now (above 99°F)
- 7 days/yr
- Hot days in 30 yrs
- 17 days/yr
Wind risk 2/10 · Minimal
- Chance of severe wind over 30 yrs
- —
Air-quality risk 2/10 · Minimal
- Unhealthy air days now
- 1 days/yr
- Unhealthy air days in 30 yrs
- 1 days/yr
Risk factors via First Street. Map © Google.
Why this score? — see what drove the B- grade
The composite is a weighted blend of 9 inputs, each scored 0–100. Each bar is that input's sub-score; the figure is the points it added to the 100-point composite (weight × sub-score).
- Cash flow +30.0/30.0
- 1% rule +10.0/10.0
- DSCR +10.0/10.0
- ARV discount +7.5/15.0
- Livability +3.7/5.0
- Schools +3.3/10.0
- Rent growth +2.5/5.0
- Condition / age +2.5/5.0
- Appreciation +0.0/10.0
$48,000
🖨 Deal sheet 📄 Offer letter ✓ Due diligence
Listing remarks
Foreclosure Auction! Online only auction. Minimum bid is $48,000. Bidding opens on May 2'st at 9am and bidding ends on May 28th at 1:00PM. Oak kitchen, huge lot. Kitchen, bath, siding, roof, gutters and pella windows were new in approx. 2003. Relax on the front porch or enjoy the great back yard. Information derived from sources to be reliable but cannot be guaranteed. Great opportunity!
Key facts
- Front porch
- Huge lot
- Great back yard
Tags
Property features AI
Exterior
- Parking: Driveway; Gravel parking
- Utilities: Public water; Sanitary sewer; Cable connected; Electric with circuit breakers
- Home design: Single-family house; Two levels (2 stories); Not attached to other structures; No common walls
- Construction: Vinyl siding; Block foundation; Year built from public records
- Exterior features: Shingle roof; Residential zoning
Interior
- Kitchen: Kitchen on main level
- Bedrooms: Primary bedroom (Upper level) — ~13 x 13; Bedroom 2 (Upper level) — ~10 x 11; Bedroom 3 (Upper level) — ~12 x 10; Total rooms: 6
- Flooring: Carpet; Vinyl; Wood
- Bathrooms: 1 full bathroom
- Heating & cooling: Natural gas heating; Radiant heat; Has heating
- Interior features: Ceiling fan(s); Full basement
- Laundry & utility: Laundry on main level; Water heater
Neighborhood map
What this means for you Summary
Snapshot
- This is a 1-bed/1.0-bath single-family listed at $48k.
Deal economics
- At list price, monthly cash flow is $364 ($4k/yr) — positive.
- The deal already cash-flows at list — no discount required.
- Meets the 1% rule at list price ($904 rent vs $48k).
- Recommended offer: $47k (3.0% below list) — sets the bar for market timing.
- Cap rate 15.4% vs local median 5.3% in Fremont — top-decile yield for the area; either an underpriced asset or a hidden risk that comps aren't pricing in. Stress-test before assuming the spread holds.
Location & tenants
- Location reads 74/100 on livability (#283 in OH, #4,637 nationally) — a middle-class / working-renter tenant base. Strengths: cost of living A+, housing A+, health & safety A+; Watch: amenities F, commute F, employment F.
- Fremont City (town): math 35% / reading 44% proficiency, ranked #543 of 656 in OH (top 83%) — families likely to look elsewhere, expect single-tenant / working-renter base with shorter leases.
- Market conditions: 88 active listings in the ZIP; 1 comparable units currently listed for rent nearby; 23 units permitted in Sandusky County in 2024 (0 in 5+ unit buildings).
- This rent is only 17% of the median local income ($63k/yr) — well below the 30% rent-burden line; pricing power to push rent on renewal without tenant pushback.
Forward outlook
- Local home prices are declining (-3.0%/yr); year-one equity from $332 of loan paydown is wiped out by about $1k of value loss. Plan a longer hold.
- Sandusky County population projected at -17% by 2050 — secular population decline; favor cash flow + early exit over multi-decade hold.
- At projected returns (-3.0% appreciation + 3.0% rent growth), your $13k cash investment doubles in ~4 years — after that, you're playing with house money.
Negotiation context
- It's been on market 36 days — a 3% lower offer ($47k) is reasonable based on typical stale-listing flexibility.
- 4 sale attempts since 18y ago with the ask held roughly flat each time — persistent listings suggest the price (not the market) is what's stuck; bring a comps-based counter.
Risks & watch-outs
- Watch-outs: built in 1878 — expect roof / HVAC / electrical / plumbing capex.
- Climate carrying-cost: moderate flood risk — expect insurance premiums to compound above CPI over the hold.
Questions for the listing agent
- It's been on market 36 days. Have you received any prior offers? Is the seller open to a 3% concession, seller financing, or rate buy-down credit?
- Built in 1878 — when were the roof, HVAC, electrical panel, plumbing, and water heater last replaced?
- Is there a deadline driving the sale (1031 exchange, divorce, estate, relocation)? That informs how much negotiation room exists.
- Schools are B-rated — typically a magnet for longer-tenancy family renters. What's the average tenant stay here, and is there a school-zone premium baked into asking?
- What's the average days-on-market for RENTAL listings here right now (not sales)? A rising rental-DOM trend means longer vacancies and softer asking-rent achievability than the comps imply.
- What's the recent tenant-quality profile in this submarket — average credit score on applications, eviction rate, late-payment / NSF rate, and stable-employment percentage? A property-management company in the area should have these aggregated.
- How much new for-sale + rental construction is in the pipeline within 1–3 miles? Heavy new supply typically softens prices + rents 12–24 months out; constrained supply supports both.
Investment metrics
- 1% rule
- 1.88% ✓
- Cap rate
- 15.38%
- Cash-on-cash
- 32.47%
- DSCR
- 2.44
- GRM
- 4.4
CMA / ARV
- ARV (median comp)
- $130,962
- List price
- $48,000
- Delta
- -63.35%
- Verdict
- UNDERPRICED
- Comps
- 20 within 1.0 mi
Show comp detail 5 sales within ~0.75 mi
| Address | Dist | Beds/Ba | Sqft | Sold | Price | $/sf | Match |
|---|---|---|---|---|---|---|---|
| 717 Thompson St | 0.22mi | 2/2.0 (+1) | 1,248 (-1%) | 9mo | $165,000 | $132 | 71 |
| 712 Howland St | 0.17mi | 2/1.0 (+1) | 1,092 (-13%) | 10mo | $71,500 | $65 | 56 |
| 402 Morrison St | 0.21mi | 2/1.0 (+1) | 1,442 (+14%) | 9mo | $157,000 | $109 | 54 |
| 309 N Columbus Ave | 0.51mi | 2/1.0 (+1) | 1,245 (-1%) | 22mo | $142,000 | $114 | 51 |
| 635 4th St | 0.63mi | 2/2.0 (+1) | 1,328 (+5%) | 11mo | $125,000 | $94 | 44 |
Match score weights: distance 35% · size 25% · config 20% · recency 20%. Top-matched comps best support the ARV.
Projected returns pro-forma
-3.0% appreciation · 3.0% rent growth · sell at horizon
- IRR
- 27.6%
- Equity multiple
- 2.15×
- Total profit
- $15,410
- Equity at exit
- $7,157
- IRR
- 35.1%
- Equity multiple
- 4.23×
- Total profit
- $43,347
- Equity at exit
- $4,150
Cash invested: $13,440 (down + closing). Projections, not guarantees.
Landlord ↔ Tenant lean methodology
- Overall (STATE)
- 73 Landlord-Friendly
- State Ohio
- 73 Landlord-Friendly · R+6
- County
- — inherits STATE
- City
- — inherits STATE
ZIP-level market 43420
- Home prices YoY
- -32.4%
- Active inventory
- 88
- Price-to-rent
- 4.4×
Monthly cashflow live
- Estimated rent
- $904 medium interval (Pro) →
- Mortgage (P&I)
- −$252
- Tax from tax record
- −$79 /mo · $945/yr
- Insurance
- −$20
- HOA
- −$0
- Vacancy / Maint / Mgmt
- −$190
- Net cashflow
- $364
Break-even live
UW: 25.0% down · 7.5% · 30yr · 1.5% tax · 5.0% vac · 8.0% maint · 8.0% mgmt
Financing live
Cash to close
- Down payment
- $12,000
- Closing costs
- $1,440
- Reserves months
- —
- Total cash needed
- —
Loan-product check · same deal, 3 products live
Conventional
25% down · 7.5% · 30yr
- Down + closing
- —
- Monthly P&I
- —
- Monthly cashflow
- —
- DSCR
- —
- Eligible?
- —
Personal DTI + credit; lowest rate.
DSCR
20% down · 8.5% · 30yr
- Down + closing
- —
- Monthly P&I
- —
- Monthly cashflow
- —
- DSCR
- —
- Eligible?
- —
No personal income docs; deal must DSCR.
Hard money
10% down · 12.0% · 12mo
- Down + closing
- —
- Monthly P&I
- —
- Monthly cashflow
- —
- DSCR
- —
- Eligible?
- —
Short-term bridge; refi at stabilization.
Rent comps 1 comps
| Address | Beds | Baths | Sqft | Rent | $/sqft | DOM | Units | Dist |
|---|---|---|---|---|---|---|---|---|
| 1335 Mosser Dr Fremont, OH | 2.0 | 1.0 | 900 | $904 | $1.00 | 12d | 1 | 1.31mi |
Listing history 12 events
-
2026-06-04days on market $48,000 Active 36 DOM
-
2026-06-02days on market $48,000 Active 35 DOM
-
2026-06-01days on market $48,000 Active 34 DOM
-
2026-05-31days on market $48,000 Active 33 DOM
-
2026-04-28$48,000 Active 391-char remark
-
2025-07-09historical
-
2025-05-29$48,000 Active
-
2019-06-13soldstatus $65,000
-
2010-09-02historical
-
2010-06-02$57,500
-
2008-11-06historical
-
2008-05-06$66,500
ⓘ Source: listings_history table (triggers on properties + properties_extension) + one-shot
backfill from property_details.listing_events for pre-trigger history.
Tax reassessment forecast OH · Partial reset (capped growth)
- Current annual tax
- $945 · $79/mo
- Projected year-2 tax
- $945 · $79/mo
- Expected delta
- $0/yr ($0/mo · -0.0%)
ⓘ Screening estimate from a state-policy table — verify with the county assessor before closing.
Climate risk First Street
- Flood 5/10 Major FEMA zone X (unshaded) · 51% chance over 30 yrs
- Wildfire 1/10 Low
- Heat 3/10 Moderate 7 d/yr ≥99°F today · 17 d/yr by 30 yrs out
- Wind 2/10 Low
- Air quality 2/10 Low 1 unhealthy d/yr today · 1 by 30 yrs out
Nearby sold comps map
Loading sold comps map…
Walkable amenities ~0.75 mi
Loading nearby amenities…
Taxation est. · year 1
- Rental income
- $10,848
- − Mortgage interest
- −$2,689
- − Property taxes
- −$945
- − Insurance
- −$240
- − Repairs & maintenance
- −$868
- − Management
- −$868
- − Depreciation
- −$1,396
- Taxable income
- $3,842
- Est. tax owed @ 24.0%
- −$922
- After-tax cash flow
- $3,442/yr
For passive investors: Depreciation is non-cash, so a rental often shows a tax loss while cash-flowing — sheltering income. Rental losses are passive: they offset passive income freely, and up to $25,000/yr can offset ordinary (W-2) income if you actively participate and your MAGI is under $100k (phasing out to $0 by $150k); unused losses carry forward. On sale, claimed depreciation is recaptured at up to 25%, and gains may owe capital-gains tax (a 1031 exchange can defer both). Figures are a year-1 estimate at your 24.0% rate — not tax advice; consult a CPA.
Schools (NCES district)
- District
- Fremont City
- NCES district ID
- 3904401
- Math proficiency
- 35% ▼ -27.00%
- Reading proficiency
- 44% ▼ -13.00%
- Median HH income
- $44,046
- Composite
- 33.48/100
- National rank
- #5449
- State rank
- #543 of 656 in OH
Livability — Fremont
- Score
- 74/100
- State rank
- #283
- US rank
- #4637
Category grades
Schools grade is shown separately in the Schools card above.
Census & demographics
- Census place
- Fremont, OH
- County
- Sandusky · 51,886 people
- City population
- 29,400
- Population (ZIP)
- 29,400
- Household income
- $62,802
- Rent vs Own
- Severe rent burden
- 10.4
Population outlook (Sandusky County) Hauer SSP2
- Today (2025)
- 57,409 people
- By 2030
- 55,791 · -2.8%
- By 2040
- 51,837 · -9.7%
- By 2050
- 47,712 · -16.9%
- By 2075
- 39,908 · -30.5%
- By 2100
- 33,171 · -42.2%
Race, ethnicity, and origin ACS 2023
- Neighborhood character
- Predominantly White (76%)
- Race & ethnicity
- White 76% Hispanic / Latino 14% Two or more races 9% Black 5%
- Hispanic origin (detail)
- Mexican 12%
- Common ancestry
- Romanian 3% Lithuanian 2% Slovak 1%
- Foreign-born
- 2% · Canada
- Languages at home
- 94% English-only · Spanish 5%
Political lean MEDSL · Sandusky
- 2024 margin
- Solid R (+30.9) · D 34.1% · R 65.0%
- 2008→2024 swing
- -35.5pp toward R · 2008: 4.6pp · 2024: -30.9pp
- All cycles
- 2024: R+30.9 2020: R+27.6 2016: R+23.0 2012: D+1.9 2008: D+4.6
Not yet ingested
- Civics
- —
Market trends
- HPI YoY
- ▼ -90.51%
- Current HPI
- 188.5274
- Rent YoY
- —
- Metro
- —
- State GDP YoY
- ▲ 1.98%
- F500 in state
- 48
Industry mix (Fortune 500 HQ in OH)
| Industry | F500 HQs | Revenue |
|---|---|---|
| Insurance | 3 | $145B |
|
||
| Industrial Machinery | 3 | $49B |
|
||
| Financial Services | 3 | $24B |
|
||
| Consumer Goods | 2 | $93B |
|
||
| Aerospace / Defense | 2 | $47B |
|
||
| Utilities | 2 | $33B |
|
||
Price history
-27.8% since first listed9 events — show timeline
- 2026-06-04 Listing Removed — NORIS
- 2026-04-28 Listed $48,000 NORIS
- 2025-07-09 Listing Removed — NORIS
- 2025-05-29 Listed $48,000 NORIS
- 2019-06-13 Sold (Public Records) $65,000 Public Records
- 2010-09-02 Listing Removed — NORIS
- 2010-06-02 Listed $57,500 NORIS
- 2008-11-06 Listing Removed — NORIS
- 2008-05-06 Listed $66,500 NORIS
Property tax history
+0.7%/yrLatest (2025): $945 · +91.5% YoY. Source: county tax records.
Cash-flow waterfall
monthlySold comps — $/sqft
last 12 mo · ≤1 miLoading sold comps…