517 Colony Lakes Dr · Red Bank, SC
Flood risk 1/10 · Minimal
- FEMA flood zone
- X (unshaded)
- Chance of flooding over 30 yrs
- 0.0%
- Est. flood insurance / yr
- $507 – $1,088
Fire risk 4/10 · Minor
- Est. fire insurance / yr
- $783 – $1,453
Heat risk 6/10 · Moderate
- Hot days now (above 107°F)
- 7 days/yr
- Hot days in 30 yrs
- 16 days/yr
Wind risk 6/10 · Moderate
- Chance of severe wind over 30 yrs
- 63.0%
Air-quality risk 3/10 · Minor
- Unhealthy air days now
- 2 days/yr
- Unhealthy air days in 30 yrs
- 2 days/yr
Risk factors via First Street. Map © Google.
Why this score? — see what drove the D grade
The composite is a weighted blend of 9 inputs, each scored 0–100. Each bar is that input's sub-score; the figure is the points it added to the 100-point composite (weight × sub-score).
- Cash flow +13.8/30.0
- ARV discount +7.5/15.0
- DSCR +4.2/10.0
- Schools +4.2/10.0
- Rent growth +3.3/5.0
- Livability +3.3/5.0
- 1% rule +2.8/10.0
- Condition / age +2.5/5.0
- Appreciation +0.0/10.0
$290,000
🖨 Deal sheet (PDF) 📄 Offer letter ✓ Due diligence
Listing remarks
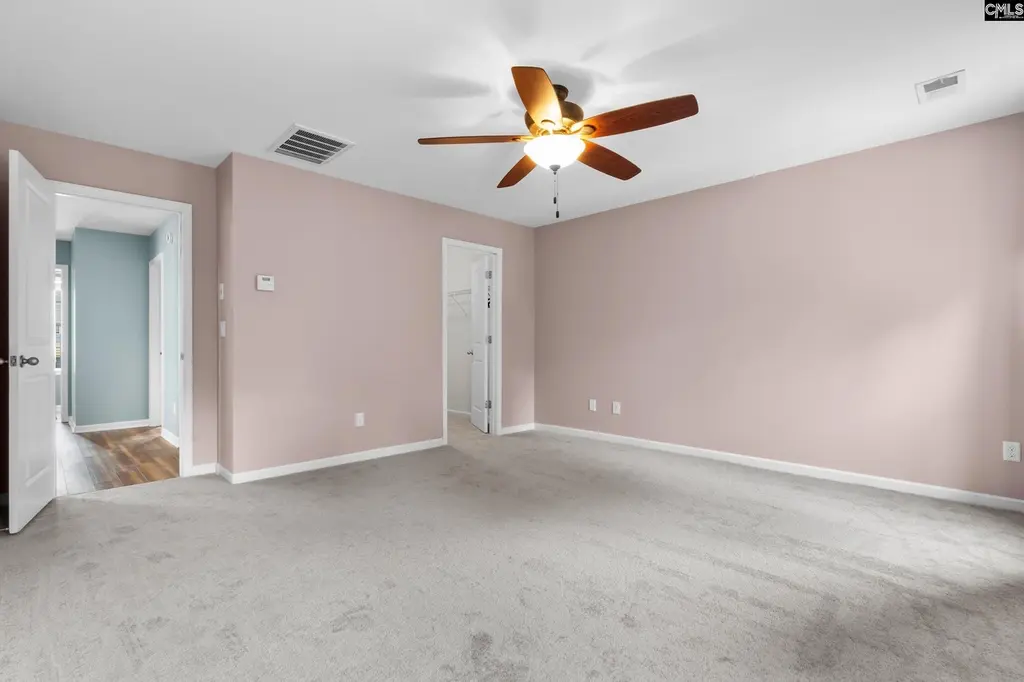
Welcome home to this beautifully maintained 4-bedroom, 2.5-bath home in the desirable Colony Lakes community! Providing a flexible floor plan with a dedicated home office on the main level, this home provides the perfect balance of space, comfort, and functionality. Inside, you’ll find fresh new carpet in bedrooms, spacious living areas, and room for everyone to spread out. The well-designed layout includes four generously sized bedrooms upstairs, while the main-level office is ideal for working from home, studying, or creating a private retreat. Step outside and prepare to be impressed. The newly redesigned backyard is truly an entertainer’s dream, featuring an expansive paver
Key facts
- Custom seating areas
- Home office
- 0.23 acre lot
Tags
Property features AI
Finance
- HOA & community: Homeowners association present; Association fee covers common area maintenance
Exterior
- Parking: Attached garage with 2 parking spaces (garage on main level)
- Utilities: Public water; Public sewer
- Home design: Two-story home; Exterior finished in stone and vinyl; Paved road access
- Construction: Slab foundation
- Exterior features: Covered front porch; Covered back porch; Deck; Patio; Shed; Sprinkler system; Landscape lighting; Full gutters; Privacy wood fencing in rear
Interior
- Kitchen: Granite countertops; Stained wood cabinets; Eat-in kitchen with bar and pantry; Tiled backsplash; Recessed lighting; Vinyl flooring in kitchen; Dishwasher; Microwave (above stove); Self-cleaning range with smooth cooktop; Disposal
- Bedrooms: Master suite on second floor with double vanity, garden tub, private bath, separate shower and walk-in closet; Additional bedrooms on second floor with ceiling fans
- Flooring: Carpet in bedrooms; Luxury vinyl plank in living area; Vinyl flooring in kitchen
- Bathrooms: Two full bathrooms; One half bathroom; Second bathrooms include full baths
- Heating & cooling: Heat pump on first level; Heat pump on second level; Cooling via heat pumps
- Interior features: Ceiling fans throughout; Garage opener; Attic access; Tankless hot water
- Laundry & utility: Laundry closet (electric) on second floor; Heated laundry space
Neighborhood map
What this means for you Summary
Snapshot
- This is a 4-bed/2.5-bath single-family listed at $290k.
Deal economics
- At list price, monthly cash flow is $29 ($349/yr) — positive.
- The deal already cash-flows at list — no discount required.
- To meet the 1% rule (rent ≥ 1% of price), the offer needs to be $225k (22.4% below list).
- Recommended offer: $225k (22.4% below list) — sets the bar for 1% rule.
Location & tenants
- Location reads 66/100 on livability (#121 in SC) — a middle-class / working-renter tenant base. Strengths: cost of living A+, housing A+, health & safety B; Watch: employment C-, crime D+, amenities F.
- Lexington 01 (suburban): math 42% / reading 53% proficiency, ranked #11 of 80 in SC (top 14%) — families likely to look elsewhere, expect single-tenant / working-renter base with shorter leases.
- Zoned schools: Red Bank Elementary (math 36% / reading 45%, grade F, #286 of 597 statewide, top 49%, 568 students, 41% FRL); Carolina Springs Middle (math 25% / reading 39%, grade F, #119 of 229 statewide, top 54%, 914 students, 46% FRL); White Knoll High (math 47% / reading 85%, grade B, #81 of 196 statewide, top 42%, 2,204 students, 45% FRL).
- Market conditions: Rents rising (+3.2%/yr); 572 active listings in the ZIP; 12 comparable units currently listed for rent nearby; rentals at typical pace (median 16d on market — plan ~3-4 weeks tenant-placement turnaround); solid renter incomes; 1,712 units permitted in Lexington County in 2024 (0 in 5+ unit buildings).
- This rent runs 35% of the median local income ($77k/yr) — at the standard rent-burdened threshold; future hikes will face affordability resistance.
Forward outlook
- Local home prices are declining (-3.0%/yr); year-one equity from $2k of loan paydown is wiped out by about $9k of value loss. Plan a longer hold.
- Lexington County population projected at +26% by 2050 — long-run rental-demand tailwind backs the buy-and-hold thesis.
Negotiation context
- Only 10 days on market — expect competitive offers; lowballing is unlikely to land.
- 2 sale attempts since 7y ago with the ask held roughly flat each time — persistent listings suggest the price (not the market) is what's stuck; bring a comps-based counter.
- Current owner paid $180k; list at $290k implies a 61% gain — meaningful room to come down on a strong offer.
Risks & watch-outs
- Climate carrying-cost: major wind risk, 63% chance of damaging wind over 30y; extreme-heat days projected 7→16/yr by 2055 (HVAC capex compounding) — expect insurance premiums to compound above CPI over the hold.
Questions for the listing agent
- What does the HOA fee cover, when was the last increase, and are there any pending special assessments or reserve-fund shortfalls?
- Is there a deadline driving the sale (1031 exchange, divorce, estate, relocation)? That informs how much negotiation room exists.
- Schools are F-rated, which usually means shorter tenancies and higher turnover. Who's the typical renter profile here, and what's been the actual vacancy rate?
- Crime grade is D in this area — have there been break-ins, vandalism, or insurance claims at this property in the last 3 years? What carrier currently insures it and at what premium?
- The area grade is low — what's the realistic commute time and amenity access for the typical tenant pool here? Any planned neighborhood developments (good or bad) we should know about?
- What's the average days-on-market for RENTAL listings here right now (not sales)? A rising rental-DOM trend means longer vacancies and softer asking-rent achievability than the comps imply.
- What's the recent tenant-quality profile in this submarket — average credit score on applications, eviction rate, late-payment / NSF rate, and stable-employment percentage? A property-management company in the area should have these aggregated.
- How much new for-sale + rental construction is in the pipeline within 1–3 miles? Heavy new supply typically softens prices + rents 12–24 months out; constrained supply supports both.
Investment metrics
- 1% rule
- 0.78% ✗
- Cap rate
- 6.41%
- Cash-on-cash
- 0.43%
- DSCR
- 1.02
- GRM
- 10.7
CMA / ARV
No comps found within radius.
Projected returns pro-forma
-3.0% appreciation · 3.24% rent growth · sell at horizon
- IRR
- -15.4%
- Equity multiple
- 0.45×
- Total profit
- $-44,721
- Equity at exit
- $43,240
- IRR
- -6.7%
- Equity multiple
- 0.57×
- Total profit
- $-34,812
- Equity at exit
- $25,074
Cash invested: $81,200 (down + closing). Projections, not guarantees.
Landlord ↔ Tenant lean methodology
- Overall (STATE)
- 90 Strongly Landlord-Friendly
- State South Carolina
- 90 Strongly Landlord-Friendly · R+6
- County
- — inherits STATE
- City
- — inherits STATE
ZIP-level market 29073
- Home prices YoY
- -19.1%
- Rents YoY
- 3.2%
- Active inventory
- 572
- Price-to-rent
- 10.7×
Monthly cashflow live
- Estimated rent
- $2,251 high interval (Pro) →
- Mortgage (P&I)
- −$1,521
- Tax from tax record
- −$90 /mo · $1,075/yr
- Insurance
- −$121
- HOA
- −$18
- Vacancy / Maint / Mgmt
- −$473
- Net cashflow
- $29
Break-even live
Sensitivity live
| Price | -10% $193 | -5% $111 | +0% $29 | +5% $-53 | +10% $-135 |
|---|---|---|---|---|---|
| Rent | -10% $-149 | -5% $-60 | +0% $29 | +5% $118 | +10% $207 |
| Rate | -1.0pp $175 | -0.5pp $103 | base $29 | +0.5pp $-46 | +1.0pp $-123 |
UW: 25.0% down · 7.5% · 30yr · 1.5% tax · 5.0% vac · 8.0% maint · 8.0% mgmt
Financing live
Cash to close
- Down payment
- $72,500
- Closing costs
- $8,700
- Reserves months
- —
- Total cash needed
- —
Loan-product check · same deal, 3 products live
Conventional
25% down · 7.5% · 30yr
- Down + closing
- —
- Monthly P&I
- —
- Monthly cashflow
- —
- DSCR
- —
- Eligible?
- —
Personal DTI + credit; lowest rate.
DSCR
20% down · 8.5% · 30yr
- Down + closing
- —
- Monthly P&I
- —
- Monthly cashflow
- —
- DSCR
- —
- Eligible?
- —
No personal income docs; deal must DSCR.
Hard money
10% down · 12.0% · 12mo
- Down + closing
- —
- Monthly P&I
- —
- Monthly cashflow
- —
- DSCR
- —
- Eligible?
- —
Short-term bridge; refi at stabilization.
Rent comps 12 comps
| Address | Beds | Baths | Sqft | Rent | $/sqft | DOM | Units | Dist |
|---|---|---|---|---|---|---|---|---|
| 1603 Commendable Ct Lexington, SC | 3.0 | 2.0 | 1399 | $2,033 | $1.45 | 5d | 1 | 0.22mi |
| 1607 Commendable Ct Lexington, SC | 4.0 | 2.5 | 1783 | $2,238 | $1.26 | 25d | 1 | 0.23mi |
| 156 Secretariat St Lexington, SC | 4.0 | 2.5 | 2591 | $2,500 | $0.96 | 16d | 1 | 0.31mi |
| 110 Darian Dr Lexington, SC | 3.0 | 2.0 | 1364 | $1,949 | $1.43 | 16d | 1 | 0.49mi |
| 449 Lady Liberty Way Lexington, SC | 3.0 | 3.0 | 1635 | $1,995 | $1.22 | 25d | 1 | 0.50mi |
| 464 Lady Liberty Way Lexington, SC | 4.0 | 2.5 | 2100 | $2,150 | $1.02 | 25d | 1 | 0.51mi |
| 212 Pin Oak Dr Lexington, SC | 3.0 | 2.0 | 1349 | $1,710 | $1.27 | 16d | 1 | 0.73mi |
| 120 W Lake Dr Lexington, SC | 3.0 | 2.0 | 1476 | $1,880 | $1.27 | 5d | 1 | 0.75mi |
| 919 Dovefield Ln Lexington, SC | 4.0 | 2.5 | 2022 | $2,299 | $1.14 | 25d | 1 | 0.80mi |
| 140 Land of Lakes Cir Lexington, SC | 3.0 | 2.0 | 1452 | $1,925 | $1.33 | 5d | 1 | 0.81mi |
| 847 Dovefield Ln Lexington, SC | 3.0 | 2.0 | 1302 | $1,850 | $1.42 | 16d | 1 | 0.84mi |
| 128 S Wrenwood Dr Lexington, SC | 3.0 | 2.0 | 1250 | $1,695 | $1.36 | 25d | 1 | 1.28mi |
HOA detail
- Monthly dues
- $18 · $216/yr
Listing history 7 events
-
2026-06-22days on market $290,000 Active 10 DOM
-
2026-06-18days on market $290,000 Active 7 DOM
-
2026-06-17days on market $290,000 Active 6 DOM
-
2026-06-16days on market $290,000 Active 5 DOM
-
2026-06-15days on market $290,000 Active 4 DOM
-
2026-06-14remarks 687-char remark
-
2026-06-14$290,000 Active 2 DOM
ⓘ Source: listings_history table (triggers on properties + properties_extension) + one-shot
backfill from property_details.listing_events for pre-trigger history.
Tax reassessment forecast SC · Resets to sale price
- Current annual tax
- $1,075 · $90/mo
- Projected year-2 tax
- $1,653 · $138/mo
- Expected delta
- +$578/yr (+$48/mo · 53.8%)
ⓘ Screening estimate from a state-policy table — verify with the county assessor before closing.
Climate risk First Street
- Flood 1/10 Low FEMA zone X (unshaded) · 0% chance over 30 yrs
- Wildfire 4/10 Moderate
- Heat 6/10 Major 7 d/yr ≥107°F today · 16 d/yr by 30 yrs out
- Wind 6/10 Major 63% chance of damaging wind over 30 yrs
- Air quality 3/10 Moderate 2 unhealthy d/yr today · 2 by 30 yrs out
Nearby sold comps map
Loading sold comps map…
Walkable amenities ~0.75 mi
Loading nearby amenities…
Taxation est. · year 1
- Rental income
- $27,012
- − Mortgage interest
- −$16,245
- − Property taxes
- −$1,075
- − Insurance
- −$1,450
- − Repairs & maintenance
- −$2,161
- − Management
- −$2,161
- − HOA
- −$216
- − Depreciation
- −$8,436
- Taxable loss
- −$4,732
- Est. tax savings @ 24.0%
- +$1,136
- After-tax cash flow
- $1,484/yr
For passive investors: Depreciation is non-cash, so a rental often shows a tax loss while cash-flowing — sheltering income. Rental losses are passive: they offset passive income freely, and up to $25,000/yr can offset ordinary (W-2) income if you actively participate and your MAGI is under $100k (phasing out to $0 by $150k); unused losses carry forward. On sale, claimed depreciation is recaptured at up to 25%, and gains may owe capital-gains tax (a 1031 exchange can defer both). Figures are a year-1 estimate at your 24.0% rate — not tax advice; consult a CPA.
Schools (NCES district)
- District
- Lexington 01
- NCES district ID
- 4502700
- Math proficiency
- 42% ▼ -12.00%
- Reading proficiency
- 53% ▼ -2.00%
- Median HH income
- $61,298
- Composite
- 41.75/100
- National rank
- #3399
- State rank
- #11 of 80 in SC
Livability — Red Bank
- Score
- 66/100
- State rank
- #121
- US rank
- #11985
Category grades
Schools grade is shown separately in the Schools card above.
Census & demographics
- Census place
- Red Bank, SC
- County
- Lexington County · 232,571 people
- Metro
- Columbia, SC
- Population (ZIP)
- 53,156
- Household income
- $77,229
- Rent vs Own
- Severe rent burden
- 935.0
Population outlook (Lexington County) Hauer SSP2
- Today (2025)
- 322,999 people
- By 2030
- 342,356 · +6.0%
- By 2040
- 377,715 · +16.9%
- By 2050
- 406,984 · +26.0%
- By 2075
- 465,447 · +44.1%
- By 2100
- 485,674 · +50.4%
Race, ethnicity, and origin ACS 2023
- Neighborhood character
- Predominantly White (72%)
- Race & ethnicity
- White 72% Black 14% Two or more races 7% Hispanic / Latino 6% Asian 2%
- Hispanic origin (detail)
- Mexican 2% Puerto Rican 1%
- Common ancestry
- Romanian 3% Italian 2% Slovak 1%
- Foreign-born
- 4% · Canada, China
- Languages at home
- 93% English-only · Spanish 5% Other Indo-European 1%
Political lean MEDSL · Lexington
- 2024 margin
- Solid R (+33.5) · D 32.5% · R 66.0% · Other 1.4%
- 2008→2024 swing
- +4.6pp toward D · 2008: -38.0pp · 2024: -33.5pp
- All cycles
- 2024: R+33.5 2020: R+30.1 2016: R+36.7 2012: R+37.8 2008: R+38.0
Not yet ingested
- Civics
- —
Market trends
- HPI YoY
- ▼ -59.20%
- Current HPI
- 249.8957
- Rent YoY
- ▲ 3.24%
- Metro
- Columbia, SC
- State GDP YoY
- ▲ 4.51%
- F500 in state
- 2
Industry mix (Fortune 500 HQ in SC)
| Industry | F500 HQs | Revenue |
|---|---|---|
| Packaging | 1 | $7B |
|
||
Price history
+53.0% since first listed4 events — show timeline
- 2026-06-11 Listed $290,000 Consolidated MLS
- 2019-07-26 Sold (Public Records) $180,000 Public Records
- 2019-06-23 Delisted — Consolidated MLS
- 2019-06-18 Listed $189,500 Consolidated MLS
Property tax history
+31.4%/yrLatest (2024): $1,075 · +4.4% YoY. Source: county tax records.
Cash-flow waterfall
monthlySold comps — $/sqft
last 12 mo · ≤1 miLoading sold comps…