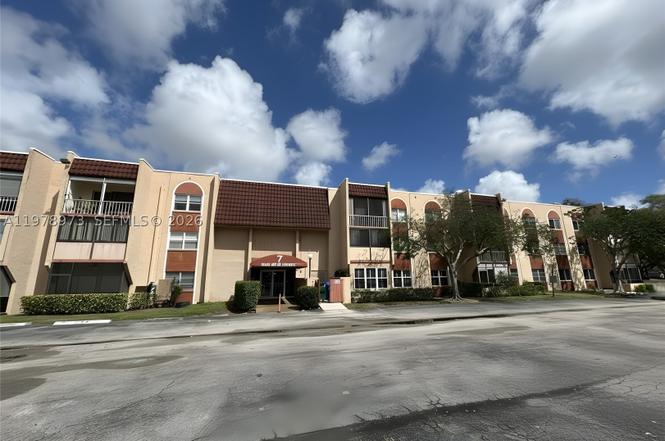
8280 SW 24th St #7104 · North Lauderdale, FL
Flood risk No data
- FEMA flood zone
- —
- Chance of flooding over 30 yrs
- —
- Est. flood insurance / yr
- —
Fire risk No data
- Est. fire insurance / yr
- —
Heat risk No data
- Hot days now (above threshold)
- —
- Hot days in 30 yrs
- —
Wind risk No data
- Chance of severe wind over 30 yrs
- —
Air-quality risk No data
- Unhealthy air days now
- —
- Unhealthy air days in 30 yrs
- —
Risk factors via First Street. Map © Google.
Why this score? — see what drove the B grade
The composite is a weighted blend of 9 inputs, each scored 0–100. Each bar is that input's sub-score; the figure is the points it added to the 100-point composite (weight × sub-score).
- Cash flow +30.0/30.0
- 1% rule +10.0/10.0
- DSCR +10.0/10.0
- ARV discount +7.5/15.0
- Schools +4.1/10.0
- Livability +3.8/5.0
- Condition / age +2.5/5.0
- Rent growth +2.3/5.0
- Appreciation +0.0/10.0
$95,000
🖨 Deal sheet (PDF) 📄 Offer letter ✓ Due diligence
Listing remarks
Spacious 2-bedroom, 2-bathroom 55+ condo located on the first floor in North Lauderdale. This comfortable residence offers a generous layout and is conveniently situated close to major highways, shopping, and everyday conveniences, making commuting and errands easy. A great opportunity to enjoy condo living in a central location.
Key facts
- Central location
- Generous layout
- $670 HOA
Tags
Property features AI
Finance
- Other: Senior community
- Financial info: Pets not allowed; Annual tax information available
- HOA & community: Monthly association fee; Association amenities: clubhouse, laundry, pool, elevators; Association fee covers amenities, common areas, cable TV, laundry, grounds maintenance, structure maintenance, pest control, pool(s), roof, sewer, security, trash, water
Exterior
- Parking: Guest parking; One assigned space
- Security: Intercom; Secured lobby; Security guard
- Utilities: Water included in association; Sewer included in association; Cable TV included in association; Electric service (central systems)
- Home design: Attached property; Entry level: 1
- Construction: Block construction; Resale property
- Exterior features: Courtyard; Enclosed porch; Porch (screened); Association pool
Interior
- Kitchen: Dishwasher; Electric range; Disposal; Refrigerator
- Bedrooms: Bedroom on main level; Total stories: 3
- Flooring: Tile flooring
- Bathrooms: 2 full bathrooms
- Heating & cooling: Central heating (electric); Central air conditioning (electric)
- Interior features: Blinds on windows; First-floor entry; Living/dining room combination; Tub with shower
- Laundry & utility: Washer and dryer included; Laundry located in common area
Neighborhood map
What this means for you Summary
Snapshot
- This is a 2-bed/2.0-bath condo listed at $95k.
Deal economics
- At list price, monthly cash flow is $511 ($6k/yr) — positive.
- The deal already cash-flows at list — no discount required.
- Meets the 1% rule at list price ($2k rent vs $95k).
- Recommended offer: $86k (9.0% below list) — sets the bar for market timing.
- Cap rate 12.7% vs local median 4.3% in North Lauderdale — top-decile yield for the area; either an underpriced asset or a hidden risk that comps aren't pricing in. Stress-test before assuming the spread holds.
Location & tenants
- Location reads 76/100 on livability (#230 in FL, #3,635 nationally) — a middle-class / working-renter tenant base. Strengths: housing A+, health & safety A+, cost of living A; Watch: commute C-, employment D, amenities F.
- Broward (suburban): math 42% / reading 53% proficiency, ranked #46 of 73 in FL (top 63%) — families likely to look elsewhere, expect single-tenant / working-renter base with shorter leases.
- Market conditions: Rents soft (-0.7%/yr); 298 active listings in the ZIP; 40 comparable units currently listed for rent nearby; rentals at typical pace (median 25d on market — plan ~3-4 weeks tenant-placement turnaround); 2,111 units permitted in Broward County in 2024 (1,265 in 5+ unit buildings).
- This rent runs 43% of the median local income ($64k/yr) — at the standard rent-burdened threshold; future hikes will face affordability resistance.
Forward outlook
- Local home prices are declining (-3.0%/yr); year-one equity from $657 of loan paydown is wiped out by about $3k of value loss. Plan a longer hold.
- Broward County population projected at +34% by 2050 — long-run rental-demand tailwind backs the buy-and-hold thesis.
- At projected returns (-3.0% appreciation + 0.0% rent growth), your $27k cash investment doubles in ~8 years — after that, you're playing with house money.
Negotiation context
- It's been on market 101 days — a 9% lower offer ($86k) is reasonable based on typical stale-listing flexibility.
- Current owner paid $75k; 27% above their basis — modest negotiation headroom, anchor on the comps not their cost.
Risks & watch-outs
- Watch-outs: HOA is 30% of rent.
Questions for the listing agent
- It's been on market 101 days. Have you received any prior offers? Is the seller open to a 9% concession, seller financing, or rate buy-down credit?
- Built in 1977 — when were the roof, HVAC, electrical panel, plumbing, and water heater last replaced?
- What does the HOA fee cover, when was the last increase, and are there any pending special assessments or reserve-fund shortfalls?
- Any open or pending special assessments — roof, HVAC, plumbing, elevator, façade? What's the per-unit balance and payoff schedule, and is the seller paying it off at close or rolling it to the buyer?
- Why hasn't it sold? Are there any deal-killer items the seller is aware of (foundation, flood, title, zoning, code violations)?
- Is there a deadline driving the sale (1031 exchange, divorce, estate, relocation)? That informs how much negotiation room exists.
- What's the average days-on-market for RENTAL listings here right now (not sales)? A rising rental-DOM trend means longer vacancies and softer asking-rent achievability than the comps imply.
- What's the recent tenant-quality profile in this submarket — average credit score on applications, eviction rate, late-payment / NSF rate, and stable-employment percentage? A property-management company in the area should have these aggregated.
- How much new apartment / multifamily construction is in the pipeline within 1–3 miles? Heavy new supply (>2% of stock underway) typically softens rents 12–24 months out; light construction supports rent growth.
Investment metrics
- 1% rule
- 2.39% ✓
- Cap rate
- 12.74%
- Cash-on-cash
- 23.04%
- DSCR
- 2.03
- GRM
- 3.5
CMA / ARV
No comps found within radius.
Projected returns pro-forma
-3.0% appreciation · 0.0% rent growth · sell at horizon
- IRR
- 10.9%
- Equity multiple
- 1.41×
- Total profit
- $10,896
- Equity at exit
- $14,165
- IRR
- 15.9%
- Equity multiple
- 2.03×
- Total profit
- $27,353
- Equity at exit
- $8,214
Cash invested: $26,600 (down + closing). Projections, not guarantees.
Landlord ↔ Tenant lean methodology
- Overall (STATE)
- 87 Strongly Landlord-Friendly
- State Florida
- 87 Strongly Landlord-Friendly · R+3
- County
- — inherits STATE
- City
- — inherits STATE
ZIP-level market 33068
- Rents YoY
- -0.7%
- Active inventory
- 298
- Price-to-rent
- 3.5×
Monthly cashflow live
- Estimated rent
- $2,271 high interval (Pro) →
- Mortgage (P&I)
- −$498
- Tax from tax record
- −$76 /mo · $909/yr
- Insurance
- −$40
- HOA
- −$670
- Vacancy / Maint / Mgmt
- −$477
- Net cashflow
- $511
Break-even live
Sensitivity live
| Price | -10% $564 | -5% $538 | +0% $511 | +5% $484 | +10% $457 |
|---|---|---|---|---|---|
| Rent | -10% $331 | -5% $421 | +0% $511 | +5% $600 | +10% $690 |
| Rate | -1.0pp $559 | -0.5pp $535 | base $511 | +0.5pp $486 | +1.0pp $461 |
UW: 25.0% down · 7.5% · 30yr · 1.5% tax · 5.0% vac · 8.0% maint · 8.0% mgmt
Financing live
Cash to close
- Down payment
- $23,750
- Closing costs
- $2,850
- Reserves months
- —
- Total cash needed
- —
Loan-product check · same deal, 3 products live
Conventional
25% down · 7.5% · 30yr
- Down + closing
- —
- Monthly P&I
- —
- Monthly cashflow
- —
- DSCR
- —
- Eligible?
- —
Personal DTI + credit; lowest rate.
DSCR
20% down · 8.5% · 30yr
- Down + closing
- —
- Monthly P&I
- —
- Monthly cashflow
- —
- DSCR
- —
- Eligible?
- —
No personal income docs; deal must DSCR.
Hard money
10% down · 12.0% · 12mo
- Down + closing
- —
- Monthly P&I
- —
- Monthly cashflow
- —
- DSCR
- —
- Eligible?
- —
Short-term bridge; refi at stabilization.
Rent comps 40 comps
| Address | Beds | Baths | Sqft | Rent | $/sqft | DOM | Units | Dist |
|---|---|---|---|---|---|---|---|---|
| 8103 SW 24th St Unit B-32 North Lauderdale, FL | 2.0 | 2.0 | 1530 | $2,400 | $1.57 | 25d | 1 | 0.10mi |
| 2306 SW 82nd Ter Unit 2306 North Lauderdale, FL | 2.0 | 2.5 | 1332 | $2,300 | $1.73 | 25d | 1 | 0.11mi |
| 5718 NW 66th Ave Unit n/a Tamarac, FL | 2.0 | 1.0 | 1118 | $2,700 | $2.42 | 25d | 1 | 0.18mi |
| 8140 SW 22nd St North Lauderdale, FL | 3.0 | 2.0 | 1084 | $2,750 | $2.54 | 21d | 1 | 0.20mi |
| 5713 NW 65th Ter Tamarac, FL | 2.0 | 1.0 | 884 | $2,200 | $2.49 | 25d | 1 | 0.21mi |
| 6710 NW 58th Ct Tamarac, FL | 2.0 | 2.0 | 1287 | $2,450 | $1.90 | 25d | 1 | 0.22mi |
| 6717 NW 59th St Tamarac, FL | 3.0 | 2.0 | 1587 | $3,700 | $2.33 | 21d | 1 | 0.22mi |
| 6020 NW 64th Ave Tamarac, FL | 1.0–2.0 | 1.0–2.0 | 770 | $1,700 | $2.21 | 5d | 3 | 0.24mi |
| 6020 NW 64th Ave Tamarac, FL | 1.0–2.0 | 1.0–2.0 | 770 | $1,700 | $2.21 | 25d | 4 | 0.24mi |
| 6300 NW 62nd St Tamarac, FL | 1.0–2.0 | 1.0–2.0 | 770 | $1,700 | $2.21 | 2d | 3 | 0.27mi |
| 6070 NW 64th Ave #204 Fort Lauderdale, FL | 2.0 | 2.0 | 880 | $1,700 | $1.93 | 3d | 1 | 0.29mi |
| 5860 NW 64th Ave Tamarac, FL | 1.0–2.0 | 1.0–2.0 | 770 | $1,700 | $2.21 | 8d | 3 | 0.30mi |
| 5860 NW 64th Ave Tamarac, FL | 1.0–2.0 | 1.0–2.0 | 770 | $1,700 | $2.21 | 25d | 2 | 0.30mi |
| 6051 NW 61st Ave Tamarac, FL | 2.0 | 2.0 | 965 | $1,675 | $1.74 | 16d | 2 | 0.34mi |
| 8172 S Coral Cir North Lauderdale, FL | 3.0 | 2.5 | 1460 | $2,699 | $1.85 | 25d | 1 | 0.35mi |
| 6161 NW 57th Ct #103 Tamarac, FL | 2.0 | 2.0 | 880 | $2,200 | $2.50 | 25d | 1 | 0.43mi |
| 1820 N Lauderdale Ave #3117 North Lauderdale, FL | 2.0 | 2.0 | 1000 | $1,850 | $1.85 | 25d | 1 | 0.44mi |
| 1820 N Lauderdale Ave #3416 North Lauderdale, FL | 2.0 | 2.0 | 1000 | $2,000 | $2.00 | 22d | 1 | 0.44mi |
| 1810 SW 81st Ave #2314 North Lauderdale, FL | 2.0 | 2.0 | 1000 | $1,850 | $1.85 | 14d | 1 | 0.46mi |
| 1810 SW 81st Ave Unit 2215 North Lauderdale, FL | 2.0 | 2.0 | 1000 | $1,900 | $1.90 | 25d | 1 | 0.46mi |
| 1810 SW 81st Ave Unit 2215 North Lauderdale, FL | 2.0 | 2.0 | 1000 | $1,850 | $1.85 | 8d | 1 | 0.46mi |
| 1810 SW 81st Ave Unit 2209 North Lauderdale, FL | 2.0 | 2.0 | 1000 | $1,700 | $1.70 | 21d | 1 | 0.46mi |
| 1721 SW 81st Ter North Lauderdale, FL | 3.0 | 2.5 | 1404 | $2,750 | $1.96 | 8d | 1 | 0.46mi |
| 1726 SW 81st Ter Unit 1726 North Lauderdale, FL | 3.0 | 2.5 | 1404 | $2,900 | $2.07 | 25d | 1 | 0.46mi |
| 1800 SW 81st Ave Unit 1307 North Lauderdale, FL | 2.0 | 2.0 | 1000 | $2,000 | $2.00 | 18d | 1 | 0.50mi |
| 1600 Coral Ave Unit 1600 North Lauderdale, FL | 3.0 | 2.5 | 1460 | $3,500 | $2.40 | 25d | 1 | 0.53mi |
| 8308 N Coral Cir Unit N/a North Lauderdale, FL | 3.0 | 2.5 | 1755 | $3,000 | $1.71 | 25d | 1 | 0.54mi |
| 5903 NW 57th Ct Tamarac, FL | 1.0–3.0 | 1.0–2.0 | 1080 | $2,330 | $2.16 | 3d | 30 | 0.58mi |
| 2707 Belmont Ln Unit 1 North Lauderdale, FL | 3.0 | 2.0 | 1553 | $2,250 | $1.45 | 25d | 1 | 0.60mi |
| 1002 Belmont Ln #1002 North Lauderdale, FL | 1.0 | 1.0 | 878 | $1,900 | $2.16 | 25d | 1 | 0.60mi |
| 1308 Belmont Ln #1308 North Lauderdale, FL | 2.0 | 2.0 | 1035 | $2,000 | $1.93 | 8d | 1 | 0.60mi |
| 1308 Belmont Ln #1308 North Lauderdale, FL | 2.0 | 2.0 | 1035 | $2,000 | $1.93 | 18d | 1 | 0.60mi |
| 1302 Belmont Ln #1302 North Lauderdale, FL | 1.0 | 1.0 | 878 | $1,850 | $2.11 | 25d | 1 | 0.60mi |
| 1204 Belmont Ln Unit 1204 North Lauderdale, FL | 1.0 | 1.0 | 878 | $1,800 | $2.05 | 25d | 1 | 0.60mi |
| 1307 Belmont Ln #1307 North Lauderdale, FL | 3.0 | 2.0 | 1480 | $2,350 | $1.59 | 25d | 1 | 0.60mi |
| 2008 Belmont Ln #2008 North Lauderdale, FL | 3.0 | 2.0 | 1480 | $2,400 | $1.62 | 25d | 1 | 0.60mi |
| 1507 Belmont Ln #1507 North Lauderdale, FL | 3.0 | 2.0 | 1553 | $2,300 | $1.48 | 21d | 1 | 0.60mi |
| 1507 Belmont Ln #1507 North Lauderdale, FL | 3.0 | 2.0 | 1553 | $2,300 | $1.48 | 25d | 1 | 0.60mi |
| 2303 Belmont Ln #2303 North Lauderdale, FL | 2.0 | 2.0 | 1154 | $1,900 | $1.65 | 25d | 1 | 0.61mi |
| 2202 Belmont Ln Unit 2202 North Lauderdale, FL | 1.0 | 1.0 | 878 | $2,150 | $2.45 | 15d | 1 | 0.61mi |
HOA detail condo
- Monthly dues
- $670 · $8,040/yr
- Assessments
- None detected in remarks — confirm with the listing agent.
Listing history 18 events
-
2026-06-18days on market $95,000 Active 101 DOM
-
2026-06-17days on market $95,000 Active 100 DOM
-
2026-06-16days on market $95,000 Active 99 DOM
-
2026-06-15days on market $95,000 Active 98 DOM
-
2026-06-13days on market $95,000 Active 96 DOM
-
2026-06-09days on market $95,000 Active 92 DOM
-
2026-06-07days on market $95,000 Active 90 DOM
-
2026-06-04days on market $95,000 Active 87 DOM
-
2026-06-03days on market $95,000 Active 86 DOM
-
2026-06-02days on market $95,000 Active 85 DOM
-
2026-06-01days on market $95,000 Active 84 DOM
-
2026-05-31days on market $95,000 Active 83 DOM
-
2026-04-16price $95,000
-
2026-04-06price $105,000
-
2026-03-09$115,000 Active
-
2007-02-02soldstatus $75,000
-
1978-03-01soldstatus $30,500
-
1978-03-01soldstatus $30,500
ⓘ Source: listings_history table (triggers on properties + properties_extension) + one-shot
backfill from property_details.listing_events for pre-trigger history.
Tax reassessment forecast FL · Resets to sale price
- Current annual tax
- $909 · $76/mo
- Projected year-2 tax
- $909 · $76/mo
- Expected delta
- $0/yr ($0/mo · 0.0%)
ⓘ Screening estimate from a state-policy table — verify with the county assessor before closing.
Nearby sold comps map
Loading sold comps map…
Walkable amenities ~0.75 mi
Loading nearby amenities…
Taxation est. · year 1
- Rental income
- $27,253
- − Mortgage interest
- −$5,321
- − Property taxes
- −$909
- − Insurance
- −$475
- − Repairs & maintenance
- −$2,180
- − Management
- −$2,180
- − HOA
- −$8,040
- − Depreciation
- −$2,764
- Taxable income
- $5,384
- Est. tax owed @ 24.0%
- −$1,292
- After-tax cash flow
- $4,836/yr
For passive investors: Depreciation is non-cash, so a rental often shows a tax loss while cash-flowing — sheltering income. Rental losses are passive: they offset passive income freely, and up to $25,000/yr can offset ordinary (W-2) income if you actively participate and your MAGI is under $100k (phasing out to $0 by $150k); unused losses carry forward. On sale, claimed depreciation is recaptured at up to 25%, and gains may owe capital-gains tax (a 1031 exchange can defer both). Figures are a year-1 estimate at your 24.0% rate — not tax advice; consult a CPA.
Schools (NCES district)
- District
- Broward
- NCES district ID
- 1200180
- Math proficiency
- 42% ▼ -18.00%
- Reading proficiency
- 53% ▼ -5.00%
- Median HH income
- $52,139
- Composite
- 40.88/100
- National rank
- #3621
- State rank
- #46 of 73 in FL
Livability — North Lauderdale
- Score
- 76/100
- State rank
- #230
- US rank
- #3635
Category grades
Schools grade is shown separately in the Schools card above.
Census & demographics
- Census place
- North Lauderdale, FL
- County
- Broward County · 1,963,430 people
- City population
- 54,439
- Metro
- Miami-Fort Lauderdale-Pompano Beach, FL
- Population (ZIP)
- 54,439
- Household income
- $64,051
- Rent vs Own
- Severe rent burden
- 3073.0
Population outlook (Broward County) Hauer SSP2
- Today (2025)
- 2,207,033 people
- By 2030
- 2,360,704 · +7.0%
- By 2040
- 2,661,208 · +20.6%
- By 2050
- 2,946,698 · +33.5%
- By 2075
- 3,602,273 · +63.2%
- By 2100
- 3,970,984 · +79.9%
Race, ethnicity, and origin ACS 2023
- Neighborhood character
- Diverse neighborhood (Simpson 0.61)
- Race & ethnicity
- Black 58% Hispanic / Latino 21% Two or more races 13% White 11% Asian 4%
- Hispanic origin (detail)
- Mexican 3% Puerto Rican 4% Cuban 1% Dominican 3%
- Common ancestry
- Hispanic 17% Estonian 1% Lithuanian 1%
- Foreign-born
- 47% · Canada, Jamaica, Vietnam
- Languages at home
- 59% English-only · Spanish 19% French/Haitian/Cajun 15% Other Indo-European 2%
Political lean MEDSL · Broward
- 2024 margin
- D (+17.0) · D 58.0% · R 41.0%
- 2008→2024 swing
- -17.8pp toward R · 2008: 34.7pp · 2024: 17.0pp
- All cycles
- 2024: D+17.0 2020: D+29.8 2016: D+35.0 2012: D+34.9 2008: D+34.7
Not yet ingested
- Civics
- —
Market trends
- HPI YoY
- ▼ -317.60%
- Current HPI
- 426.2972
- Rent YoY
- ▼ -0.74%
- Metro
- Miami-Fort Lauderdale-Pompano Beach, FL
- State GDP YoY
- ▲ 3.28%
- F500 in state
- 36
Industry mix (Fortune 500 HQ in FL)
| Industry | F500 HQs | Revenue |
|---|---|---|
| Industrial Technology | 2 | $29B |
|
||
| Insurance | 2 | $17B |
|
||
| Retail | 1 | $60B |
|
||
| Technology Distribution | 1 | $58B |
|
||
| Homebuilding | 1 | $35B |
|
||
| Technology Manufacturing | 1 | $35B |
|
||
Price history
+211.5% since first listed6 events — show timeline
- 2026-04-16 Price Changed $95,000 MARMLS
- 2026-04-06 Price Changed $105,000 MARMLS
- 2026-03-09 Listed $115,000 MARMLS
- 2007-02-02 Sold (Public Records) $75,000 Public Records
- 1978-03-01 Sold (Public Records) $30,500 Public Records
- 1978-03-01 Sold (Public Records) $30,500 Public Records
Property tax history
+5.7%/yrLatest (2025): $909 · +2.3% YoY. Source: county tax records.
Cash-flow waterfall
monthlySold comps — $/sqft
last 12 mo · ≤1 miLoading sold comps…