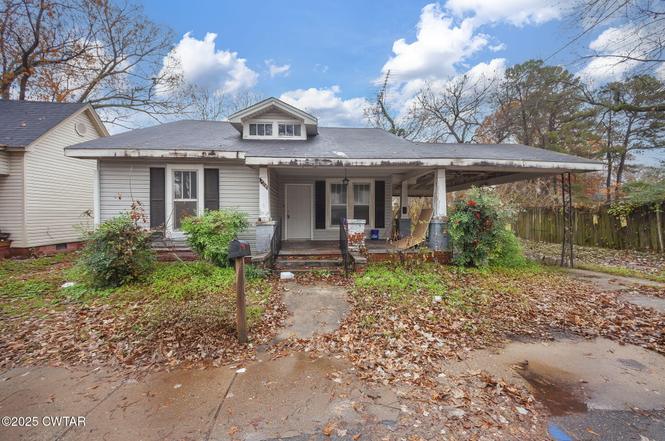
704 N 17th Ave · Humboldt, TN
Flood risk 6/10 · Moderate
- FEMA flood zone
- X (unshaded)
- Chance of flooding over 30 yrs
- 0.75%
- Est. flood insurance / yr
- $507 – $1,088
Fire risk 1/10 · Minimal
- Est. fire insurance / yr
- $949 – $1,763
Heat risk 6/10 · Moderate
- Hot days now (above 109°F)
- 7 days/yr
- Hot days in 30 yrs
- 20 days/yr
Wind risk 4/10 · Minor
- Chance of severe wind over 30 yrs
- 13.0%
Air-quality risk 1/10 · Minimal
- Unhealthy air days now
- 0 days/yr
- Unhealthy air days in 30 yrs
- 0 days/yr
Risk factors via First Street. Map © Google.
Why this score? — see what drove the B- grade
The composite is a weighted blend of 9 inputs, each scored 0–100. Each bar is that input's sub-score; the figure is the points it added to the 100-point composite (weight × sub-score).
- Cash flow +30.0/30.0
- 1% rule +10.0/10.0
- DSCR +10.0/10.0
- ARV discount +7.5/15.0
- Livability +3.0/5.0
- Rent growth +2.5/5.0
- Condition / age +2.5/5.0
- Schools +0.5/10.0
- Appreciation +0.0/10.0
$35,000
🖨 Deal sheet (PDF) 📄 Offer letter ✓ Due diligence
Listing remarks
Excellent opportunity to expand your existing rental portfolio. Central Humboldt location with new flooring. 1250 square feet of living space including an area that can be used as a third bedroom. Vacant for easy showings.
Key facts
- New flooring
- 7,200 sq ft lot
- Parking
Tags
Property features AI
Exterior
- Parking: 1 covered carport space; 1 total parking space
- Utilities: Public water; Public sewer; Electricity connected; Sewer connected; Water connected
- Home design: Single-family residence; One story
- Exterior features: Shed on property; City street frontage; Public maintained road
Interior
- Kitchen: Electric range; Refrigerator; Laminate countertops
- Bedrooms: 2 main-level bedrooms
- Bathrooms: 1 full bathroom (main level)
- Heating & cooling: Ceiling fans (cooling)
- Interior features: Ceiling fans; Laminate countertops; Electric range; Refrigerator
- Laundry & utility: Washer hookup; Electric dryer hookup
Neighborhood map
What this means for you Summary
Snapshot
- This is a 2-bed/1.0-bath single-family listed at $35k.
Deal economics
- At list price, monthly cash flow is $568 ($7k/yr) — positive.
- The deal already cash-flows at list — no discount required.
- Meets the 1% rule at list price ($985 rent vs $35k).
- Recommended offer: $31k (12.0% below list) — sets the bar for market timing.
Location & tenants
- Location reads 59/100 on livability (#289 in TN) — a working-class tenant base; expect higher turnover. Strengths: cost of living A+, housing A+; Watch: health & safety C-, schools F, crime F.
- Humboldt City Schools (town): math 4% / reading 9% proficiency, ranked #138 of 139 in TN (top 99%) — low school quality limits family demand, transient renter base, plan for 1-2y turnover; 86% free/reduced lunch — lower-income household profile, screen leases tightly.
- Market conditions: 153 active listings in the ZIP; 1 comparable units currently listed for rent nearby; 155 units permitted in Gibson County in 2024 (0 in 5+ unit buildings).
Forward outlook
- Local home prices are declining (-3.0%/yr); year-one equity from $242 of loan paydown is wiped out by about $1k of value loss. Plan a longer hold.
- Gibson County population projected to shrink 8% by 2050 — rents likely to lag national; underwrite the cash flow, not the appreciation.
- At projected returns (-3.0% appreciation + 3.0% rent growth), your $10k cash investment doubles in ~2 years — after that, you're playing with house money.
Negotiation context
- It's been on market 159 days — a 12% lower offer ($31k) is reasonable based on typical stale-listing flexibility.
Risks & watch-outs
- Watch-outs: built in 1939 — expect roof / HVAC / electrical / plumbing capex.
- Climate carrying-cost: major flood risk; extreme-heat days projected 7→20/yr by 2055 (HVAC capex compounding) — expect insurance premiums to compound above CPI over the hold.
Questions for the listing agent
- It's been on market 159 days. Have you received any prior offers? Is the seller open to a 12% concession, seller financing, or rate buy-down credit?
- Built in 1939 — when were the roof, HVAC, electrical panel, plumbing, and water heater last replaced?
- Why hasn't it sold? Are there any deal-killer items the seller is aware of (foundation, flood, title, zoning, code violations)?
- Is there a deadline driving the sale (1031 exchange, divorce, estate, relocation)? That informs how much negotiation room exists.
- Schools are F-rated, which usually means shorter tenancies and higher turnover. Who's the typical renter profile here, and what's been the actual vacancy rate?
- Crime grade is F in this area — have there been break-ins, vandalism, or insurance claims at this property in the last 3 years? What carrier currently insures it and at what premium?
- What's the average days-on-market for RENTAL listings here right now (not sales)? A rising rental-DOM trend means longer vacancies and softer asking-rent achievability than the comps imply.
- What's the recent tenant-quality profile in this submarket — average credit score on applications, eviction rate, late-payment / NSF rate, and stable-employment percentage? A property-management company in the area should have these aggregated.
- How much new for-sale + rental construction is in the pipeline within 1–3 miles? Heavy new supply typically softens prices + rents 12–24 months out; constrained supply supports both.
Investment metrics
- 1% rule
- 2.81% ✓
- Cap rate
- 25.78%
- Cash-on-cash
- 69.58%
- DSCR
- 4.10
- GRM
- 3.0
CMA / ARV
No comps found within radius.
Projected returns pro-forma
-3.0% appreciation · 3.0% rent growth · sell at horizon
- IRR
- 69.1%
- Equity multiple
- 4.11×
- Total profit
- $30,517
- Equity at exit
- $5,219
- IRR
- 73.1%
- Equity multiple
- 8.47×
- Total profit
- $73,159
- Equity at exit
- $3,026
Cash invested: $9,800 (down + closing). Projections, not guarantees.
Landlord ↔ Tenant lean methodology
- Overall (STATE)
- 87 Strongly Landlord-Friendly
- State Tennessee
- 87 Strongly Landlord-Friendly · R+13
- County
- — inherits STATE
- City
- — inherits STATE
ZIP-level market 38343
- Home prices YoY
- -18.1%
- Active inventory
- 153
- Price-to-rent
- 3.0×
Monthly cashflow live
- Estimated rent
- $985 medium interval (Pro) →
- Mortgage (P&I)
- −$184
- Tax from tax record
- −$12 /mo · $141/yr
- Insurance
- −$15
- HOA
- −$0
- Vacancy / Maint / Mgmt
- −$207
- Net cashflow
- $568
Break-even live
Sensitivity live
| Price | -10% $588 | -5% $578 | +0% $568 | +5% $558 | +10% $548 |
|---|---|---|---|---|---|
| Rent | -10% $490 | -5% $529 | +0% $568 | +5% $607 | +10% $646 |
| Rate | -1.0pp $586 | -0.5pp $577 | base $568 | +0.5pp $559 | +1.0pp $550 |
UW: 25.0% down · 7.5% · 30yr · 1.5% tax · 5.0% vac · 8.0% maint · 8.0% mgmt
Financing live
Cash to close
- Down payment
- $8,750
- Closing costs
- $1,050
- Reserves months
- —
- Total cash needed
- —
Loan-product check · same deal, 3 products live
Conventional
25% down · 7.5% · 30yr
- Down + closing
- —
- Monthly P&I
- —
- Monthly cashflow
- —
- DSCR
- —
- Eligible?
- —
Personal DTI + credit; lowest rate.
DSCR
20% down · 8.5% · 30yr
- Down + closing
- —
- Monthly P&I
- —
- Monthly cashflow
- —
- DSCR
- —
- Eligible?
- —
No personal income docs; deal must DSCR.
Hard money
10% down · 12.0% · 12mo
- Down + closing
- —
- Monthly P&I
- —
- Monthly cashflow
- —
- DSCR
- —
- Eligible?
- —
Short-term bridge; refi at stabilization.
Rent comps 1 comps
| Address | Beds | Baths | Sqft | Rent | $/sqft | DOM | Units | Dist |
|---|---|---|---|---|---|---|---|---|
| 739 N 3rd Ave Humboldt, TN | 3.0 | 2.0 | 1152 | $985 | $0.86 | 45d | 1 | 0.97mi |
Listing history 5 events
-
2026-05-04status Pending
-
2026-04-15price $35,000
-
2026-02-24price $45,000
-
2026-01-15price $60,000
-
2025-11-25$70,000 Active
ⓘ Source: listings_history table (triggers on properties + properties_extension) + one-shot
backfill from property_details.listing_events for pre-trigger history.
Tax reassessment forecast TN · Resets to sale price
- Current annual tax
- $141 · $12/mo
- Projected year-2 tax
- $249 · $21/mo
- Expected delta
- +$108/yr (+$9/mo · 76.2%)
ⓘ Screening estimate from a state-policy table — verify with the county assessor before closing.
Climate risk First Street
- Flood 6/10 Major FEMA zone X (unshaded) · 75% chance over 30 yrs
- Wildfire 1/10 Low
- Heat 6/10 Major 7 d/yr ≥109°F today · 20 d/yr by 30 yrs out
- Wind 4/10 Moderate 13% chance of damaging wind over 30 yrs
- Air quality 1/10 Low 0 unhealthy d/yr today · 0 by 30 yrs out
Nearby sold comps map
Loading sold comps map…
Walkable amenities ~0.75 mi
Loading nearby amenities…
Taxation est. · year 1
- Rental income
- $11,820
- − Mortgage interest
- −$1,961
- − Property taxes
- −$141
- − Insurance
- −$175
- − Repairs & maintenance
- −$946
- − Management
- −$946
- − Depreciation
- −$1,018
- Taxable income
- $6,634
- Est. tax owed @ 24.0%
- −$1,592
- After-tax cash flow
- $5,227/yr
For passive investors: Depreciation is non-cash, so a rental often shows a tax loss while cash-flowing — sheltering income. Rental losses are passive: they offset passive income freely, and up to $25,000/yr can offset ordinary (W-2) income if you actively participate and your MAGI is under $100k (phasing out to $0 by $150k); unused losses carry forward. On sale, claimed depreciation is recaptured at up to 25%, and gains may owe capital-gains tax (a 1031 exchange can defer both). Figures are a year-1 estimate at your 24.0% rate — not tax advice; consult a CPA.
Schools (NCES district)
- District
- Humboldt City Schools
- NCES district ID
- 4701950
- Math proficiency
- 4% ▼ -11.00%
- Reading proficiency
- 9% ▼ -6.00%
- Median HH income
- $30,717
- Composite
- 4.86/100
- National rank
- #10042
- State rank
- #138 of 139 in TN
Livability — Humboldt
- Score
- 59/100
- State rank
- #289
- US rank
- #20318
Category grades
Schools grade is shown separately in the Schools card above.
Census & demographics
- Census place
- Humboldt, TN
- City population
- 15,672
- Population (ZIP)
- 15,672
Population outlook (Gibson County) Hauer SSP2
- Today (2025)
- 48,793 people
- By 2030
- 48,221 · -1.2%
- By 2040
- 46,793 · -4.1%
- By 2050
- 44,909 · -8.0%
- By 2075
- 40,191 · -17.6%
- By 2100
- 33,574 · -31.2%
Race, ethnicity, and origin ACS 2023
- Neighborhood character
- Predominantly White (65%)
- Race & ethnicity
- White 65% Black 23% Two or more races 6% Hispanic / Latino 5% Native American 1%
- Hispanic origin (detail)
- Mexican 5%
- Common ancestry
- Serbian 2% Italian 1% Lithuanian 1%
- Foreign-born
- 3% · Canada
- Languages at home
- 94% English-only · Spanish 5% Other Indo-European 1%
Political lean MEDSL · Gibson
- 2024 margin
- Solid R (+52.0) · D 23.6% · R 75.5%
- 2008→2024 swing
- -23.2pp toward R · 2008: -28.8pp · 2024: -52.0pp
- All cycles
- 2024: R+52.0 2020: R+47.0 2016: R+43.8 2012: R+32.1 2008: R+28.8
Not yet ingested
- Civics
- —
Market trends
- HPI YoY
- ▼ -45.61%
- Current HPI
- 206.7365
- Rent YoY
- —
- Metro
- —
- State GDP YoY
- ▲ 2.78%
- F500 in state
- 22
Industry mix (Fortune 500 HQ in TN)
| Industry | F500 HQs | Revenue |
|---|---|---|
| Healthcare | 3 | $91B |
|
||
| Retail | 3 | $72B |
|
||
| Transportation / Logistics | 1 | $88B |
|
||
| Paper / Packaging | 1 | $19B |
|
||
| Insurance | 1 | $13B |
|
||
| Energy | 1 | $12B |
|
||
Price history
-50.0% since first listed5 events — show timeline
- 2026-05-04 Pending — CWTAR
- 2026-04-15 Price Changed $35,000 CWTAR
- 2026-02-24 Price Changed $45,000 CWTAR
- 2026-01-15 Price Changed $60,000 CWTAR
- 2025-11-25 Listed $70,000 CWTAR
Property tax history
-8.1%/yrLatest (2025): $141 · +0.0% YoY. Source: county tax records.
Cash-flow waterfall
monthlySold comps — $/sqft
last 12 mo · ≤1 miLoading sold comps…