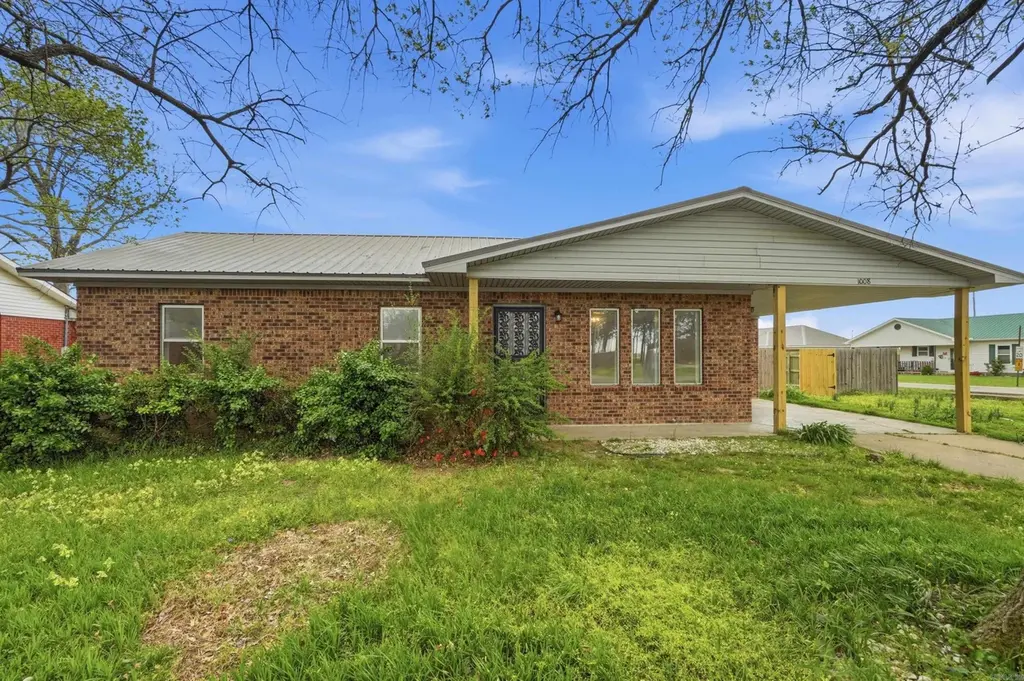
1008 Deanna Dr · Lake City, AR
Flood risk 1/10 · Minimal
- FEMA flood zone
- X
- Chance of flooding over 30 yrs
- 0.0%
- Est. flood insurance / yr
- $507 – $1,088
Fire risk 1/10 · Minimal
- Est. fire insurance / yr
- $1,499 – $2,785
Heat risk 6/10 · Moderate
- Hot days now (above 109°F)
- 7 days/yr
- Hot days in 30 yrs
- 22 days/yr
Wind risk 4/10 · Minor
- Chance of severe wind over 30 yrs
- 10.0%
Air-quality risk 1/10 · Minimal
- Unhealthy air days now
- 0 days/yr
- Unhealthy air days in 30 yrs
- 0 days/yr
Risk factors via First Street. Map © Google.
Why this score? — see what drove the C+ grade
The composite is a weighted blend of 9 inputs, each scored 0–100. Each bar is that input's sub-score; the figure is the points it added to the 100-point composite (weight × sub-score).
- Cash flow +25.1/30.0
- Appreciation +10.0/10.0
- DSCR +8.2/10.0
- 1% rule +5.5/10.0
- ARV discount +4.0/15.0
- Livability +3.2/5.0
- Schools +3.1/10.0
- Rent growth +2.5/5.0
- Condition / age +2.5/5.0
$149,900
🖨 Deal sheet (PDF) 📄 Offer letter ✓ Due diligence
Listing remarks
Recently updated 3 bed 1 bath home with carport and large fenced back yard. Updates include new HVAC, granite counter tops, new water heater, stainless steel appliances, paint, flooring, and more! Agent owned.
Key facts
- 9,583 sq ft lot
- Parking
- Built 1980
Property features AI
Finance
- Financial info: Financing options: VA, FHA, Conventional, Rural Development, or Cash
Exterior
- Parking: Carport for 1 car
- Utilities: Public water; Municipal electric (Entergy)
- Home design: Brick exterior
- Construction: Metal roof; Slab foundation
- Exterior features: Deck; Paved road access; Level lot
Interior
- Kitchen: Free-standing stove; Microwave; Dishwasher
- Flooring: Luxury vinyl
- Bathrooms: 1 full bathroom
- Heating & cooling: Central heat; Central cooling
- Interior features: Luxury vinyl flooring; Central heating; Central cooling
Neighborhood map
What this means for you Summary
Snapshot
- This is a 3-bed/1.0-bath single-family listed at $150k.
Deal economics
- At list price, monthly cash flow is $333 ($4k/yr) — positive.
- The deal already cash-flows at list — no discount required.
- Meets the 1% rule at list price ($2k rent vs $150k).
- Cap rate 9.0% vs local median 5.1% in Lake City — top-decile yield for the area; either an underpriced asset or a hidden risk that comps aren't pricing in. Stress-test before assuming the spread holds.
Location & tenants
- Location reads 64/100 on livability (#180 in AR) — a middle-class / working-renter tenant base. Strengths: cost of living A+, housing A+, crime A; Watch: amenities F, commute F, employment D-.
- Riverside School District (rural): math 32% / reading 42% proficiency, ranked #103 of 238 in AR (top 43%) — families likely to look elsewhere, expect single-tenant / working-renter base with shorter leases.
- Zoned schools: Riverside West Elem. School (math 47% / reading 52%, grade D, #93 of 454 statewide, top 23%, 296 students, 56% FRL); Riverside High School (math 27% / reading 40%, grade F, #112 of 292 statewide, top 39%, 331 students, 47% FRL) — zoned schools at 52% FRL track the district average.
- Market conditions: 34 active listings in the ZIP; 1 comparable units currently listed for rent nearby; 926 units permitted in Craighead County in 2024 (69 in 5+ unit buildings).
Forward outlook
- In year one you build about $16k of equity ($1k loan paydown + $15k appreciation (10.0% local appreciation)).
- Craighead County population projected at +38% by 2050 — long-run rental-demand tailwind backs the buy-and-hold thesis.
- At projected returns (10.0% appreciation + 3.0% rent growth), your $42k cash investment doubles in ~3 years — after that, you're playing with house money.
- By year 3, paydown + projected appreciation supports a ~$40k cash-out refi (75% LTV) — recoverable capital for the next deal without selling this one.
Negotiation context
- Only 6 days on market — expect competitive offers; lowballing is unlikely to land.
- Current owner paid $67k; list at $150k implies a 124% gain — meaningful room to come down on a strong offer.
Risks & watch-outs
- Climate carrying-cost: extreme-heat days projected 7→22/yr by 2055 (HVAC capex compounding) — expect insurance premiums to compound above CPI over the hold.
Questions for the listing agent
- Is there a deadline driving the sale (1031 exchange, divorce, estate, relocation)? That informs how much negotiation room exists.
- Schools are D-rated, which usually means shorter tenancies and higher turnover. Who's the typical renter profile here, and what's been the actual vacancy rate?
- What's the average days-on-market for RENTAL listings here right now (not sales)? A rising rental-DOM trend means longer vacancies and softer asking-rent achievability than the comps imply.
- What's the recent tenant-quality profile in this submarket — average credit score on applications, eviction rate, late-payment / NSF rate, and stable-employment percentage? A property-management company in the area should have these aggregated.
- How much new for-sale + rental construction is in the pipeline within 1–3 miles? Heavy new supply typically softens prices + rents 12–24 months out; constrained supply supports both.
Investment metrics
- 1% rule
- 1.05% ✓
- Cap rate
- 8.96%
- Cash-on-cash
- 9.52%
- DSCR
- 1.42
- GRM
- 7.9
CMA / ARV
- ARV (on-the-fly)
- $139,004
- Comps found
- 12
Show comp detail 12 sales within ~0.75 mi
| Address | Dist | Beds/Ba | Sqft | Sold | Price | $/sf | Match |
|---|---|---|---|---|---|---|---|
| 1009 Opal Cir | 0.05mi | 3/1.0 | 1,121 (0%) | 5mo | $133,900 | $119 | 94 |
| 911 Grimes St | 0.03mi | 3/1.0 | 1,121 (0%) | 10mo | $85,000 | $76 | 90 |
| 1008 Catfish St | 0.06mi | 3/1.0 | 1,121 (0%) | 15mo | $135,000 | $120 | 85 |
| 810 Grimes Rd | 0.13mi | 3/1.0 | 1,121 (0%) | 15mo | $129,900 | $116 | 81 |
| 1011 Opal Cir | 0.06mi | 3/1.0 | 1,076 (-4%) | 18mo | $150,000 | $139 | 76 |
| 1005 Opal Cir | 0.05mi | 2/1.0 (-1) | 1,121 (0%) | 21mo | $109,000 | $97 | 75 |
| 1102 Estelle | 0.60mi | 3/1.0 | 1,121 (0%) | 2mo | $145,000 | $129 | 70 |
| 204 Catfish Dr | 0.57mi | 3/2.0 | 1,161 (+4%) | 1mo | $167,500 | $144 | 63 |
| 505 Maumelle St | 0.52mi | 3/1.0 | 1,056 (-6%) | 11mo | $135,000 | $128 | 57 |
| 603 1/2 Lake St | 0.51mi | 3/1.0 | 975 (-13%) | 6mo | $119,000 | $122 | 50 |
| 105 Mead St | 0.50mi | 3/1.0 | 1,026 (-8%) | 17mo | $127,000 | $124 | 49 |
| 801 Pyland | 0.39mi | 3/2.0 | 1,254 (+12%) | 15mo | $207,000 | $165 | 46 |
Match score weights: distance 35% · size 25% · config 20% · recency 20%. Top-matched comps best support the ARV.
Projected returns pro-forma
9.97% appreciation · 3.0% rent growth · sell at horizon
- IRR
- 31.2%
- Equity multiple
- 3.44×
- Total profit
- $102,468
- Equity at exit
- $134,686
- IRR
- 27.0%
- Equity multiple
- 7.79×
- Total profit
- $284,871
- Equity at exit
- $290,079
Cash invested: $41,972 (down + closing). Projections, not guarantees.
Landlord ↔ Tenant lean methodology
- Overall (STATE)
- 92 Strongly Landlord-Friendly
- State Arkansas
- 92 Strongly Landlord-Friendly · R+14
- County
- — inherits STATE
- City
- — inherits STATE
ZIP-level market 72437
- Home prices YoY
- 3.5%
- Active inventory
- 34
- Price-to-rent
- 7.9×
Monthly cashflow live
- Estimated rent
- $1,575 medium interval (Pro) →
- Mortgage (P&I)
- −$786
- Tax from tax record
- −$63 /mo · $751/yr
- Insurance
- −$62
- HOA
- −$0
- Vacancy / Maint / Mgmt
- −$331
- Net cashflow
- $333
Break-even live
Sensitivity live
| Price | -10% $418 | -5% $376 | +0% $333 | +5% $291 | +10% $248 |
|---|---|---|---|---|---|
| Rent | -10% $209 | -5% $271 | +0% $333 | +5% $395 | +10% $458 |
| Rate | -1.0pp $409 | -0.5pp $371 | base $333 | +0.5pp $294 | +1.0pp $255 |
UW: 25.0% down · 7.5% · 30yr · 1.5% tax · 5.0% vac · 8.0% maint · 8.0% mgmt
Financing live
Cash to close
- Down payment
- $37,475
- Closing costs
- $4,497
- Reserves months
- —
- Total cash needed
- —
Loan-product check · same deal, 3 products live
Conventional
25% down · 7.5% · 30yr
- Down + closing
- —
- Monthly P&I
- —
- Monthly cashflow
- —
- DSCR
- —
- Eligible?
- —
Personal DTI + credit; lowest rate.
DSCR
20% down · 8.5% · 30yr
- Down + closing
- —
- Monthly P&I
- —
- Monthly cashflow
- —
- DSCR
- —
- Eligible?
- —
No personal income docs; deal must DSCR.
Hard money
10% down · 12.0% · 12mo
- Down + closing
- —
- Monthly P&I
- —
- Monthly cashflow
- —
- DSCR
- —
- Eligible?
- —
Short-term bridge; refi at stabilization.
Rent comps 1 comps
| Address | Beds | Baths | Sqft | Rent | $/sqft | DOM | Units | Dist |
|---|---|---|---|---|---|---|---|---|
| 1997 Teal Cv Lake City, AR | 3.0 | 2.0 | 1263 | $1,575 | $1.25 | 45d | 1 | 1.22mi |
Listing history 3 events
-
2026-04-17status Under Contract
-
2026-04-10$149,900 New Listing
-
2025-11-07soldstatus $67,000
ⓘ Source: listings_history table (triggers on properties + properties_extension) + one-shot
backfill from property_details.listing_events for pre-trigger history.
Tax reassessment forecast AR · Resets to sale price
- Current annual tax
- $751 · $63/mo
- Projected year-2 tax
- $959 · $80/mo
- Expected delta
- +$208/yr (+$17/mo · 27.7%)
ⓘ Screening estimate from a state-policy table — verify with the county assessor before closing.
Climate risk First Street
- Flood 1/10 Low FEMA zone X · 0% chance over 30 yrs
- Wildfire 1/10 Low
- Heat 6/10 Major 7 d/yr ≥109°F today · 22 d/yr by 30 yrs out
- Wind 4/10 Moderate 10% chance of damaging wind over 30 yrs
- Air quality 1/10 Low 0 unhealthy d/yr today · 0 by 30 yrs out
Nearby sold comps map
Loading sold comps map…
Walkable amenities ~0.75 mi
Loading nearby amenities…
Taxation est. · year 1
- Rental income
- $18,900
- − Mortgage interest
- −$8,397
- − Property taxes
- −$751
- − Insurance
- −$750
- − Repairs & maintenance
- −$1,512
- − Management
- −$1,512
- − Depreciation
- −$4,361
- Taxable income
- $1,618
- Est. tax owed @ 24.0%
- −$388
- After-tax cash flow
- $3,609/yr
For passive investors: Depreciation is non-cash, so a rental often shows a tax loss while cash-flowing — sheltering income. Rental losses are passive: they offset passive income freely, and up to $25,000/yr can offset ordinary (W-2) income if you actively participate and your MAGI is under $100k (phasing out to $0 by $150k); unused losses carry forward. On sale, claimed depreciation is recaptured at up to 25%, and gains may owe capital-gains tax (a 1031 exchange can defer both). Figures are a year-1 estimate at your 24.0% rate — not tax advice; consult a CPA.
Schools (NCES district)
- District
- Riverside School District
- NCES district ID
- 0500012
- Math proficiency
- 32% ▼ -14.00%
- Reading proficiency
- 42% ▼ -9.00%
- Median HH income
- $37,959
- Composite
- 30.82/100
- National rank
- #6136
- State rank
- #103 of 238 in AR
Livability — Lake City
- Score
- 64/100
- State rank
- #180
- US rank
- #14568
Category grades
Schools grade is shown separately in the Schools card above.
Census & demographics
- Census place
- Lake City, AR
- Population (ZIP)
- 3,386
Population outlook (Craighead County) Hauer SSP2
- Today (2025)
- 122,235 people
- By 2030
- 131,338 · +7.4%
- By 2040
- 149,862 · +22.6%
- By 2050
- 168,034 · +37.5%
- By 2075
- 208,094 · +70.2%
- By 2100
- 233,251 · +90.8%
Race, ethnicity, and origin ACS 2023
- Neighborhood character
- Predominantly White (94%)
- Race & ethnicity
- White 94% Two or more races 4% Black 1%
- Common ancestry
- Italian 2% Slovak 2% Iranian 1%
- Languages at home
- 99% English-only · Spanish 1%
Political lean MEDSL · Craighead
- 2024 margin
- Solid R (+37.4) · D 30.1% · R 67.5% · Other 2.4%
- 2008→2024 swing
- -12.9pp toward R · 2008: -24.5pp · 2024: -37.4pp
- All cycles
- 2024: R+37.4 2020: R+35.4 2016: R+35.2 2012: R+31.1 2008: R+24.5
Not yet ingested
- Civics
- —
Market trends
- HPI YoY
- ▲ 9.97%
- Current HPI
- 295.1637
- Rent YoY
- —
- Metro
- —
- State GDP YoY
- ▲ 3.80%
- F500 in state
- 10
Industry mix (Fortune 500 HQ in AR)
| Industry | F500 HQs | Revenue |
|---|---|---|
| Retail | 1 | $681B |
|
||
| Food / Agriculture | 1 | $53B |
|
||
| Retail / Energy | 1 | $22B |
|
||
| Transportation / Logistics | 1 | $12B |
|
||
| Energy | 1 | $4B |
|
||
Price history
+123.7% since first listed3 events — show timeline
- 2026-04-17 Pending — CARMLS
- 2026-04-10 Listed $149,900 CARMLS
- 2025-11-07 Sold (Public Records) $67,000 Public Records
Property tax history
+10.3%/yrLatest (2025): $751 · +291.7% YoY. Source: county tax records.
Cash-flow waterfall
monthlySold comps — $/sqft
last 12 mo · ≤1 miLoading sold comps…