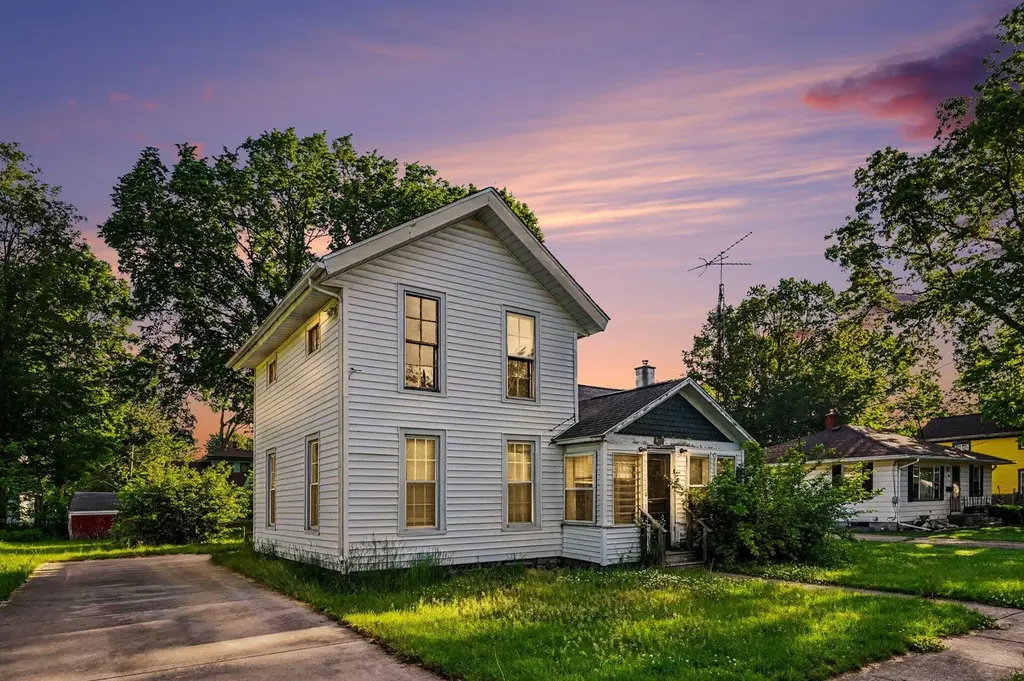
307 E State St · Brady, MI
Flood risk 1/10 · Minimal
- FEMA flood zone
- X (unshaded)
- Chance of flooding over 30 yrs
- 0.0%
- Est. flood insurance / yr
- $473 – $860
Fire risk 1/10 · Minimal
- Est. fire insurance / yr
- $784 – $1,456
Heat risk 2/10 · Minimal
- Hot days now (above 99°F)
- 7 days/yr
- Hot days in 30 yrs
- 16 days/yr
Wind risk 2/10 · Minimal
- Chance of severe wind over 30 yrs
- —
Air-quality risk 2/10 · Minimal
- Unhealthy air days now
- 1 days/yr
- Unhealthy air days in 30 yrs
- 2 days/yr
Risk factors via First Street. Map © Google.
Why this score? — see what drove the B- grade
The composite is a weighted blend of 9 inputs, each scored 0–100. Each bar is that input's sub-score; the figure is the points it added to the 100-point composite (weight × sub-score).
- Cash flow +26.7/30.0
- ARV discount +15.0/15.0
- DSCR +9.2/10.0
- 1% rule +7.0/10.0
- Schools +4.3/10.0
- Rent growth +2.5/5.0
- Livability +2.5/5.0
- Condition / age +2.5/5.0
- Appreciation +0.0/10.0
$129,900
🖨 Deal sheet 📄 Offer letter ✓ Due diligence
Listing remarks MLS
Situated a great lot in the Village of Vicksburg, this charming 1,260 sq. ft. two-story home offers plenty of potential for investors, flippers, or buyers looking for their next renovation project. Features include a newer roof, vinyl siding, central air conditioning, a spacious living room, formal dining room, and convenient main-floor laundry. A large storage shed provides additional space for tools and equipment. Located within walking distance of downtown Vicksburg, local shops, restaurants, the Farmers Market, and Vicksburg schools. The electrical system has been recently updated, though this handyman special still requires significant repairs and updating and is being sold as-is. Cash or renovation financing may be best suited for this property. Bring your vision and transform this property into something special!
Key facts
- Newer roof
- Vinyl siding
- Main-floor laundry
Tags
Property features AI
Finance
- Other: Property type: Residential — Single family residence; Lot size about 0.19 acres
- Financial info: Financial details not specified
- HOA & community: HOA information not specified
Exterior
- Parking: Parking details not specified
- Security: Security details not specified
- Utilities: Public water; Natural gas available and connected; Electricity available
- Home design: Traditional style single-family residence; Built in 1900
- Construction: Vinyl siding; Composition roof; Crawl space / Michigan basement
- Exterior features: Sidewalk; Shed(s); Paved road access
Interior
- Kitchen: Microwave; Refrigerator
- Bedrooms: Bedrooms not specified
- Flooring: Flooring not specified
- Bathrooms: 1 full bathroom
- Heating & cooling: Forced air heating; Has central cooling
- Interior features: Ramped entrance; 6 total rooms
- Laundry & utility: Natural gas water heater
Neighborhood map
What this means for you Summary
Snapshot
- This is a 3-bed/1.0-bath single-family listed at $130k.
Deal economics
- At list price, monthly cash flow is $353 ($4k/yr) — positive.
- The deal already cash-flows at list — no discount required.
- Meets the 1% rule at list price ($2k rent vs $130k).
Location & tenants
- Location reads: area grade B — affects rentability + tenant quality, not the cash-flow math above.
- Vicksburg Community Schools (suburban): math 42% / reading 56% proficiency, ranked #100 of 540 in MI (top 18%) — families likely to look elsewhere, expect single-tenant / working-renter base with shorter leases.
- Market conditions: 141 active listings in the ZIP; solid renter incomes; 339 units permitted in Kalamazoo County in 2024 (22 in 5+ unit buildings).
Forward outlook
- Local home prices are declining (-3.0%/yr); year-one equity from $898 of loan paydown is wiped out by about $4k of value loss. Plan a longer hold.
- Kalamazoo County population projected at +18% by 2050 — long-run rental-demand tailwind backs the buy-and-hold thesis.
- At projected returns (-3.0% appreciation + 3.0% rent growth), your $36k cash investment doubles in ~10 years — after that, you're playing with house money.
Negotiation context
- Only 10 days on market — expect competitive offers; lowballing is unlikely to land.
- 6 sale attempts with the ask held roughly flat each time — persistent listings suggest the price (not the market) is what's stuck; bring a comps-based counter.
Risks & watch-outs
- Watch-outs: built in 1900 — expect roof / HVAC / electrical / plumbing capex.
Questions for the listing agent
- Built in 1900 — when were the roof, HVAC, electrical panel, plumbing, and water heater last replaced?
- Is there a deadline driving the sale (1031 exchange, divorce, estate, relocation)? That informs how much negotiation room exists.
- What's the average days-on-market for RENTAL listings here right now (not sales)? A rising rental-DOM trend means longer vacancies and softer asking-rent achievability than the comps imply.
- What's the recent tenant-quality profile in this submarket — average credit score on applications, eviction rate, late-payment / NSF rate, and stable-employment percentage? A property-management company in the area should have these aggregated.
- How much new for-sale + rental construction is in the pipeline within 1–3 miles? Heavy new supply typically softens prices + rents 12–24 months out; constrained supply supports both.
Investment metrics
- 1% rule
- 1.20% ✓
- Cap rate
- 9.55%
- Cash-on-cash
- 11.65%
- DSCR
- 1.52
- GRM
- 6.9
CMA / ARV
- ARV (on-the-fly)
- $185,220
- Comps found
- 12
Show comp detail 12 sales within ~0.75 mi
| Address | Dist | Beds/Ba | Sqft | Sold | Price | $/sf | Match |
|---|---|---|---|---|---|---|---|
| 327 Prairie St | 0.07mi | 3/1.5 | 1,286 (+2%) | 15mo | $191,000 | $149 | 79 |
| 307 E State St | 0.00mi | 3/1.0 | 1,440 (+14%) | 9mo | $120,000 | $83 | 69 |
| 426 E Division St | 0.12mi | 3/1.0 | 1,400 (+11%) | 9mo | $195,000 | $139 | 68 |
| 108 S Michigan Ave | 0.29mi | 2/1.0 (-1) | 1,356 (+8%) | 1mo | $98,000 | $72 | 68 |
| 614 State St | 0.28mi | 3/1.0 | 1,192 (-5%) | 13mo | $165,000 | $138 | 67 |
| 419 E Vine St | 0.17mi | 3/1.5 | 1,408 (+12%) | 5mo | $225,000 | $160 | 66 |
| 304 N Wilson St | 0.25mi | 3/1.5 | 1,152 (-9%) | 7mo | $208,000 | $181 | 66 |
| 107 E Maple St | 0.27mi | 3/1.0 | 1,170 (-7%) | 13mo | $186,000 | $159 | 64 |
| 432 E Vine St | 0.18mi | 3/2.0 | 1,448 (+15%) | 3mo | $247,000 | $171 | 60 |
| 621 State St | 0.29mi | 3/1.0 | 1,428 (+13%) | 8mo | $210,000 | $147 | 58 |
| 734 Best St | 0.67mi | 3/1.0 | 1,300 (+3%) | 13mo | $180,000 | $138 | 52 |
| 327 Mckain St | 0.59mi | 2/1.0 (-1) | 1,350 (+7%) | 7mo | $85,000 | $63 | 50 |
Match score weights: distance 35% · size 25% · config 20% · recency 20%. Top-matched comps best support the ARV.
Projected returns pro-forma
-3.0% appreciation · 3.0% rent growth · sell at horizon
- IRR
- 1.0%
- Equity multiple
- 1.04×
- Total profit
- $1,448
- Equity at exit
- $19,369
- IRR
- 10.7%
- Equity multiple
- 1.83×
- Total profit
- $30,270
- Equity at exit
- $11,231
Cash invested: $36,372 (down + closing). Projections, not guarantees.
Landlord ↔ Tenant lean methodology
- Overall (STATE)
- 62 Landlord-Friendly
- State Michigan
- 62 Landlord-Friendly · EVEN
- County
- — inherits STATE
- City
- — inherits STATE
ZIP-level market 49097
- Active inventory
- 141
- Price-to-rent
- 6.9×
Monthly cashflow live
- Estimated rent
- $1,564 medium interval (Pro) →
- Mortgage (P&I)
- −$681
- Tax from tax record
- −$147 /mo · $1,769/yr
- Insurance
- −$54
- HOA
- −$0
- Vacancy / Maint / Mgmt
- −$328
- Net cashflow
- $353
Break-even live
UW: 25.0% down · 7.5% · 30yr · 1.5% tax · 5.0% vac · 8.0% maint · 8.0% mgmt
Financing live
Cash to close
- Down payment
- $32,475
- Closing costs
- $3,897
- Reserves months
- —
- Total cash needed
- —
Loan-product check · same deal, 3 products live
Conventional
25% down · 7.5% · 30yr
- Down + closing
- —
- Monthly P&I
- —
- Monthly cashflow
- —
- DSCR
- —
- Eligible?
- —
Personal DTI + credit; lowest rate.
DSCR
20% down · 8.5% · 30yr
- Down + closing
- —
- Monthly P&I
- —
- Monthly cashflow
- —
- DSCR
- —
- Eligible?
- —
No personal income docs; deal must DSCR.
Hard money
10% down · 12.0% · 12mo
- Down + closing
- —
- Monthly P&I
- —
- Monthly cashflow
- —
- DSCR
- —
- Eligible?
- —
Short-term bridge; refi at stabilization.
Listing history 9 events
-
2026-06-18days on market $129,900 Active 10 DOM
-
2026-06-17days on market $129,900 Active 9 DOM
-
2026-06-16days on market $129,900 Active 8 DOM
-
2026-06-15days on market $129,900 Active 7 DOM
-
2026-06-14days on market $129,900 Active 5 DOM
-
2026-06-13days on market $129,900 Active 4 DOM
-
2026-06-10days on market $129,900 Active 2 DOM
-
2026-06-09remarks 699-char remark
-
2026-06-09$129,900 Active 1 DOM
ⓘ Source: listings_history table (triggers on properties + properties_extension) + one-shot
backfill from property_details.listing_events for pre-trigger history.
Tax reassessment forecast MI · Partial reset (capped growth)
- Current annual tax
- $1,769 · $147/mo
- Projected year-2 tax
- $1,885 · $157/mo
- Expected delta
- +$116/yr (+$10/mo · 6.6%)
ⓘ Screening estimate from a state-policy table — verify with the county assessor before closing.
Climate risk First Street
- Flood 1/10 Low FEMA zone X (unshaded) · 0% chance over 30 yrs
- Wildfire 1/10 Low
- Heat 2/10 Low 7 d/yr ≥99°F today · 16 d/yr by 30 yrs out
- Wind 2/10 Low
- Air quality 2/10 Low 1 unhealthy d/yr today · 2 by 30 yrs out
Nearby sold comps map
Loading sold comps map…
Walkable amenities ~0.75 mi
Loading nearby amenities…
Taxation est. · year 1
- Rental income
- $18,771
- − Mortgage interest
- −$7,276
- − Property taxes
- −$1,769
- − Insurance
- −$650
- − Repairs & maintenance
- −$1,502
- − Management
- −$1,502
- − Depreciation
- −$3,779
- Taxable income
- $2,294
- Est. tax owed @ 24.0%
- −$550
- After-tax cash flow
- $3,686/yr
For passive investors: Depreciation is non-cash, so a rental often shows a tax loss while cash-flowing — sheltering income. Rental losses are passive: they offset passive income freely, and up to $25,000/yr can offset ordinary (W-2) income if you actively participate and your MAGI is under $100k (phasing out to $0 by $150k); unused losses carry forward. On sale, claimed depreciation is recaptured at up to 25%, and gains may owe capital-gains tax (a 1031 exchange can defer both). Figures are a year-1 estimate at your 24.0% rate — not tax advice; consult a CPA.
Schools (NCES district)
- District
- Vicksburg Community Schools
- NCES district ID
- 2634950
- Math proficiency
- 42% ▼ -10.00%
- Reading proficiency
- 56% ▼ -4.00%
- Median HH income
- $59,299
- Composite
- 42.79/100
- National rank
- #3146
- State rank
- #100 of 540 in MI
Livability — Brady
No livability data for this city. (Only ~50 U.S. cities are tracked.)
Census & demographics
- Census place
- Vicksburg, MI
- County
- Kalamazoo County · 224,317 people
- Metro
- Kalamazoo-Portage, MI
- Population (ZIP)
- 11,754
- Household income
- $88,208
- Rent vs Own
- Severe rent burden
- 110.0
Population outlook (Kalamazoo County) Hauer SSP2
- Today (2025)
- 280,982 people
- By 2030
- 292,068 · +3.9%
- By 2040
- 312,191 · +11.1%
- By 2050
- 331,196 · +17.9%
- By 2075
- 379,021 · +34.9%
- By 2100
- 396,579 · +41.1%
Race, ethnicity, and origin ACS 2023
- Neighborhood character
- Predominantly White (92%)
- Race & ethnicity
- White 92% Two or more races 5% Hispanic / Latino 2%
- Common ancestry
- Iranian 9% Romanian 3% Slovak 3%
- Foreign-born
- 1% · Canada
- Languages at home
- 97% English-only · Spanish 1% French/Haitian/Cajun 1%
Political lean MEDSL · Kalamazoo
- 2024 margin
- D (+17.7) · D 58.0% · R 40.3% · Other 1.7%
- 2008→2024 swing
- -1.8pp toward R · 2008: 19.5pp · 2024: 17.7pp
- All cycles
- 2024: D+17.7 2020: D+18.7 2016: D+12.8 2012: D+13.3 2008: D+19.5
Not yet ingested
- Civics
- —
Market trends
- HPI YoY
- ▼ -136.53%
- Current HPI
- 196.1338
- Rent YoY
- —
- Metro
- Kalamazoo-Portage, MI
- State GDP YoY
- ▲ 1.37%
- F500 in state
- 28
Industry mix (Fortune 500 HQ in MI)
| Industry | F500 HQs | Revenue |
|---|---|---|
| Automotive Parts | 3 | $48B |
|
||
| Automotive | 2 | $372B |
|
||
| Chemicals | 1 | $45B |
|
||
| Automotive Retail | 1 | $29B |
|
||
| Healthcare / Medical Devices | 1 | $23B |
|
||
| Automotive Technology | 1 | $20B |
|
||
Price history
-10.4% since first listed16 events — show timeline
- 2026-06-08 Listed $129,900 REALCOMP
- 2026-06-08 Listed $129,900 SW Michigan MLS
- 2026-06-08 Listed $129,900 MiRealSource-MiMLS
- 2025-10-06 Sold (Public Records) $120,000 Public Records
- 2025-09-26 Sold (MLS) $120,000 MiRealSource-MiMLS
- 2025-09-26 Sold (MLS) $120,000 SW Michigan MLS
- 2025-09-26 Sold (MLS) $120,000 REALCOMP
- 2025-08-26 Pending — REALCOMP
- 2025-08-26 Pending — MiRealSource-MiMLS
- 2025-08-26 Pending — SW Michigan MLS
- 2025-08-22 Price Changed $125,000 MiRealSource-MiMLS
- 2025-08-21 Price Changed $125,000 REALCOMP
- 2025-08-21 Price Changed $125,000 SW Michigan MLS
- 2025-07-29 Listed $145,000 REALCOMP
- 2025-07-29 Listed $145,000 MiRealSource-MiMLS
- 2025-07-29 Listed $145,000 SW Michigan MLS
Property tax history
+3.6%/yrLatest (2025): $1,769 · +224.8% YoY. Source: county tax records.
Cash-flow waterfall
monthlySold comps — $/sqft
last 12 mo · ≤1 miLoading sold comps…