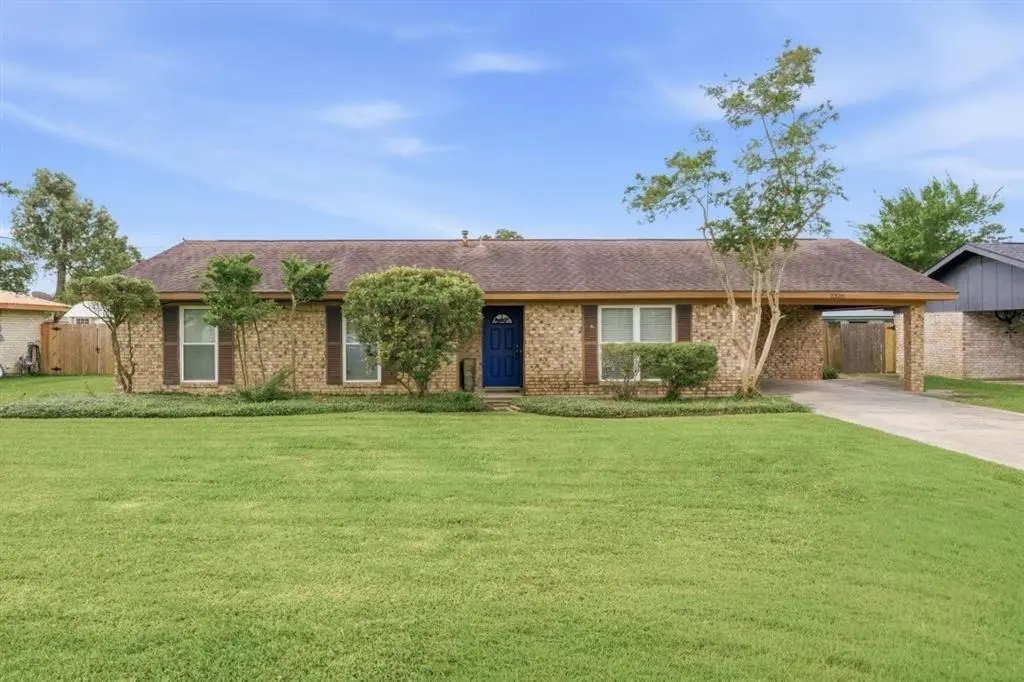
2328 Acadienne St · Sulphur, LA
Flood risk 5/10 · Moderate
- FEMA flood zone
- X (shaded)
- Chance of flooding over 30 yrs
- 0.24%
- Est. flood insurance / yr
- $507 – $1,088
Fire risk 2/10 · Minimal
- Est. fire insurance / yr
- $1,269 – $2,357
Heat risk 9/10 · Severe
- Hot days now (above 109°F)
- 7 days/yr
- Hot days in 30 yrs
- 24 days/yr
Wind risk 9/10 · Severe
- Chance of severe wind over 30 yrs
- 99.0%
Air-quality risk 2/10 · Minimal
- Unhealthy air days now
- 1 days/yr
- Unhealthy air days in 30 yrs
- 1 days/yr
Risk factors via First Street. Map © Google.
Why this score? — see what drove the C grade
The composite is a weighted blend of 9 inputs, each scored 0–100. Each bar is that input's sub-score; the figure is the points it added to the 100-point composite (weight × sub-score).
- Cash flow +23.5/30.0
- ARV discount +9.7/15.0
- DSCR +7.6/10.0
- 1% rule +5.3/10.0
- Rent growth +4.4/5.0
- Livability +3.6/5.0
- Schools +3.1/10.0
- Condition / age +2.5/5.0
- Appreciation +0.0/10.0
$215,000
🖨 Deal sheet (PDF) 📄 Offer letter ✓ Due diligence
Listing remarks
Homes in the highly sought-after Rosepark neighborhood sell incredibly fast! Do not miss your opportunity to own this well maintained, single-owner property nestled in a well-established, family-friendly neighborhood. Approximately 2,000 square feet of functional living space featuring Sunlit Family Room with cathedral ceiling and expansive windows that flood the room with natural light. The spacious kitchen design is perfect for meal prep and entertaining that flows into the breakfast/keeping area, ideal for casual dining or a cozy secondary seating spot. The living room offers more of a quiet retreat. Enjoy the fully fenced private backyard and large patio for outdoor relaxation! Storage
Key facts
- Expansive windows
- Cathedral ceiling
- Sunlit family room
Tags
Property features AI
Exterior
- Parking: Attached carport; Carport (1 covered space); Open parking (1 total parking space)
- Utilities: Public water; Public sewer; Electricity connected; Natural gas connected; Water connected; Sewer connected
- Home design: Single-family house; One story; Slab foundation
- Construction: Brick construction; Shingle roof
- Exterior features: Rain gutters; Patio; French doors; Sliding doors; Fenced yard with wood privacy fencing; Outbuilding / Storage; Has a view
Interior
- Kitchen: Dishwasher; Electric range / Oven / Range; Disposal; Refrigerator
- Bedrooms: 3 bedrooms on the main level
- Bathrooms: 2 full bathrooms; 1 half bathroom; 2 bathrooms on the main level
- Heating & cooling: Central heating (natural gas); Central air conditioning; Ceiling fans; Wall/window unit(s)
- Interior features: Ceiling fan(s); Kitchen island
- Laundry & utility: Washer hookup; Dedicated laundry room
Neighborhood map
What this means for you Summary
Snapshot
- This is a 3-bed/2.5-bath single-family listed at $215k.
Deal economics
- At list price, monthly cash flow is $403 ($5k/yr) — positive.
- The deal already cash-flows at list — no discount required.
- Meets the 1% rule at list price ($2k rent vs $215k).
- Recommended offer: $212k (1.5% below list) — sets the bar for market timing.
Location & tenants
- Location reads 71/100 on livability (#48 in LA) — a middle-class / working-renter tenant base. Strengths: cost of living A+, housing A+, health & safety A; Watch: crime D-, amenities F, commute F.
- Calcasieu Parish (other): math 30% / reading 44% proficiency, ranked #29 of 98 in LA (top 30%) — families likely to look elsewhere, expect single-tenant / working-renter base with shorter leases.
- Zoned schools: Maplewood Elementary (math 23% / reading 38%, grade F, #324 of 646 statewide, top 51%, 651 students, 55% FRL); Maplewood Middle School (math 31% / reading 50%, grade F, #62 of 218 statewide, top 29%, 335 students, 50% FRL); Sulphur High School (math 36% / reading 53%, grade F, #58 of 265 statewide, top 23%, 2,043 students, 47% FRL) — zoned schools at 51% FRL track the district average.
- Market conditions: Rents rising fast (+7.7%/yr); 294 active listings in the ZIP; 4 comparable units currently listed for rent nearby; rentals lingering (median 46d on market — plan ~5-8 weeks vacancy on turnover, expect pricing pressure); 75% of comp listings sitting > 30 days — soft ceiling on asking rent; 1,298 units permitted in Calcasieu Parish in 2024 (526 in 5+ unit buildings).
- This rent runs 41% of the median local income ($65k/yr) — at the standard rent-burdened threshold; future hikes will face affordability resistance.
Forward outlook
- Local home prices are declining (-3.0%/yr); year-one equity from $1k of loan paydown is wiped out by about $6k of value loss. Plan a longer hold.
- Calcasieu County population projected at +11% by 2050 — modest demand growth; plan on rents tracking national, not racing it.
- At projected returns (-3.0% appreciation + 7.7% rent growth), your $60k cash investment doubles in ~9 years — after that, you're playing with house money.
Negotiation context
- It's been on market 23 days — a 2% lower offer ($212k) is reasonable based on typical stale-listing flexibility.
Risks & watch-outs
- Climate carrying-cost: moderate flood risk; severe wind risk, 99% chance of damaging wind over 30y; extreme-heat days projected 7→24/yr by 2055 (HVAC capex compounding) — expect insurance premiums to compound above CPI over the hold.
Questions for the listing agent
- Is there a deadline driving the sale (1031 exchange, divorce, estate, relocation)? That informs how much negotiation room exists.
- Schools are A-rated — typically a magnet for longer-tenancy family renters. What's the average tenant stay here, and is there a school-zone premium baked into asking?
- Crime grade is D in this area — have there been break-ins, vandalism, or insurance claims at this property in the last 3 years? What carrier currently insures it and at what premium?
- What's the average days-on-market for RENTAL listings here right now (not sales)? A rising rental-DOM trend means longer vacancies and softer asking-rent achievability than the comps imply.
- What's the recent tenant-quality profile in this submarket — average credit score on applications, eviction rate, late-payment / NSF rate, and stable-employment percentage? A property-management company in the area should have these aggregated.
- How much new for-sale + rental construction is in the pipeline within 1–3 miles? Heavy new supply typically softens prices + rents 12–24 months out; constrained supply supports both.
Investment metrics
- 1% rule
- 1.03% ✓
- Cap rate
- 8.54%
- Cash-on-cash
- 8.03%
- DSCR
- 1.36
- GRM
- 8.1
CMA / ARV
- ARV (on-the-fly)
- $226,000
- Comps found
- 12
Show comp detail 12 sales within ~0.75 mi
| Address | Dist | Beds/Ba | Sqft | Sold | Price | $/sf | Match |
|---|---|---|---|---|---|---|---|
| 2618 Roxton St | 0.29mi | 3/2.0 | 2,190 (+10%) | 2mo | $180,500 | $82 | 67 |
| 2200 Tammy St | 0.14mi | 3/2.0 | 1,700 (-15%) | 9mo | $191,000 | $112 | 59 |
| 868 S Post Oak Rd S | 0.57mi | 4/2.0 (+1) | 1,910 (-4%) | 5mo | $234,000 | $123 | 55 |
| 608 Shady Ln | 0.61mi | 3/3.0 | 1,903 (-5%) | 8mo | $215,000 | $113 | 54 |
| 2807 Mary Ann Dr | 0.50mi | 4/2.0 (+1) | 1,870 (-6%) | 8mo | $209,000 | $112 | 52 |
| 2505 Jayson St | 0.74mi | 4/2.0 (+1) | 1,913 (-4%) | 1mo | $195,000 | $102 | 51 |
| 1415 Beth St | 0.71mi | 3/2.0 | 1,832 (-8%) | 3mo | $225,000 | $123 | 49 |
| 2917 Weil Dr | 0.64mi | 3/2.0 | 1,840 (-8%) | 11mo | $207,000 | $113 | 46 |
| 515 N Lebanon St N | 0.62mi | 3/2.0 | 1,728 (-14%) | 7mo | $179,700 | $104 | 41 |
| 1404 Forest Ln | 0.61mi | 3/3.5 | 2,232 (+12%) | 11mo | $230,000 | $103 | 39 |
| 2922 Weil Dr Dr | 0.70mi | 4/2.0 (+1) | 1,750 (-12%) | 5mo | $215,000 | $123 | 35 |
| 1409 Beth St | 0.66mi | 4/2.0 (+1) | 2,236 (+12%) | 12mo | $269,000 | $120 | 33 |
Match score weights: distance 35% · size 25% · config 20% · recency 20%. Top-matched comps best support the ARV.
Projected returns pro-forma
-3.0% appreciation · 7.65% rent growth · sell at horizon
- IRR
- 0.6%
- Equity multiple
- 1.03×
- Total profit
- $1,555
- Equity at exit
- $32,057
- IRR
- 14.3%
- Equity multiple
- 2.38×
- Total profit
- $82,962
- Equity at exit
- $18,589
Cash invested: $60,200 (down + closing). Projections, not guarantees.
Landlord ↔ Tenant lean methodology
- Overall (STATE)
- 90 Strongly Landlord-Friendly
- State Louisiana
- 90 Strongly Landlord-Friendly · R+12
- County
- — inherits STATE
- City
- — inherits STATE
ZIP-level market 70663
- Rents YoY
- 7.7%
- Active inventory
- 294
- Price-to-rent
- 8.1×
Monthly cashflow live
- Estimated rent
- $2,206 medium interval (Pro) →
- Mortgage (P&I)
- −$1,127
- Tax from tax record
- −$123 /mo · $1,475/yr
- Insurance
- −$90
- HOA
- −$0
- Vacancy / Maint / Mgmt
- −$463
- Net cashflow
- $403
Break-even live
Sensitivity live
| Price | -10% $524 | -5% $464 | +0% $403 | +5% $342 | +10% $281 |
|---|---|---|---|---|---|
| Rent | -10% $228 | -5% $316 | +0% $403 | +5% $490 | +10% $577 |
| Rate | -1.0pp $511 | -0.5pp $457 | base $403 | +0.5pp $347 | +1.0pp $290 |
UW: 25.0% down · 7.5% · 30yr · 1.5% tax · 5.0% vac · 8.0% maint · 8.0% mgmt
Financing live
Cash to close
- Down payment
- $53,750
- Closing costs
- $6,450
- Reserves months
- —
- Total cash needed
- —
Loan-product check · same deal, 3 products live
Conventional
25% down · 7.5% · 30yr
- Down + closing
- —
- Monthly P&I
- —
- Monthly cashflow
- —
- DSCR
- —
- Eligible?
- —
Personal DTI + credit; lowest rate.
DSCR
20% down · 8.5% · 30yr
- Down + closing
- —
- Monthly P&I
- —
- Monthly cashflow
- —
- DSCR
- —
- Eligible?
- —
No personal income docs; deal must DSCR.
Hard money
10% down · 12.0% · 12mo
- Down + closing
- —
- Monthly P&I
- —
- Monthly cashflow
- —
- DSCR
- —
- Eligible?
- —
Short-term bridge; refi at stabilization.
Rent comps 4 comps
| Address | Beds | Baths | Sqft | Rent | $/sqft | DOM | Units | Dist |
|---|---|---|---|---|---|---|---|---|
| 608 Shady Ln Sulphur, LA | 3.0 | 3.0 | 1903 | $2,200 | $1.16 | 45d | 1 | 0.58mi |
| 708 Alabama St Sulphur, LA | 4.0 | 2.5 | 2335 | $2,800 | $1.20 | 22d | 1 | 0.94mi |
| 1016 Jacques Dr Sulphur, LA | 4.0 | 3.0 | 2350 | $3,000 | $1.28 | 45d | 1 | 1.05mi |
| 1141 Mosswood Dr Sulphur, LA | 2.0–3.0 | 2.0–3.5 | 1332 | $2,195 | $1.65 | 45d | 1 | 1.38mi |
Listing history 18 events
-
2026-06-21days on market $215,000 Active 23 DOM
-
2026-06-19days on market $215,000 Active 21 DOM
-
2026-06-18days on market $215,000 Active 20 DOM
-
2026-06-17days on market $215,000 Active 19 DOM
-
2026-06-16days on market $215,000 Active 18 DOM
-
2026-06-15days on market $215,000 Active 17 DOM
-
2026-06-14days on market $215,000 Active 15 DOM
-
2026-06-13days on market $215,000 Active 14 DOM
-
2026-06-10days on market $215,000 Active 12 DOM
-
2026-06-09days on market $215,000 Active 11 DOM
-
2026-06-08days on market $215,000 Active 10 DOM
-
2026-06-07days on market $215,000 Active 9 DOM
-
2026-06-05days on market $215,000 Active 6 DOM
-
2026-06-02days on market $215,000 Active 4 DOM
-
2026-06-01days on market $215,000 Active 3 DOM
-
2026-05-31days on market $215,000 Active 2 DOM
-
2026-05-30remarks 699-char remark
-
2026-05-30$215,000 Active 1 DOM
ⓘ Source: listings_history table (triggers on properties + properties_extension) + one-shot
backfill from property_details.listing_events for pre-trigger history.
Tax reassessment forecast LA · Resets to sale price
- Current annual tax
- $1,475 · $123/mo
- Projected year-2 tax
- $1,475 · $123/mo
- Expected delta
- $0/yr ($0/mo · 0.0%)
ⓘ Screening estimate from a state-policy table — verify with the county assessor before closing.
Climate risk First Street
- Flood 5/10 Major FEMA zone X (shaded) · 24% chance over 30 yrs
- Wildfire 2/10 Low
- Heat 9/10 Extreme 7 d/yr ≥109°F today · 24 d/yr by 30 yrs out
- Wind 9/10 Extreme 99% chance of damaging wind over 30 yrs
- Air quality 2/10 Low 1 unhealthy d/yr today · 1 by 30 yrs out
Nearby sold comps map
Loading sold comps map…
Walkable amenities ~0.75 mi
Loading nearby amenities…
Taxation est. · year 1
- Rental income
- $26,471
- − Mortgage interest
- −$12,043
- − Property taxes
- −$1,475
- − Insurance
- −$1,075
- − Repairs & maintenance
- −$2,118
- − Management
- −$2,118
- − Depreciation
- −$6,255
- Taxable income
- $1,387
- Est. tax owed @ 24.0%
- −$333
- After-tax cash flow
- $4,499/yr
For passive investors: Depreciation is non-cash, so a rental often shows a tax loss while cash-flowing — sheltering income. Rental losses are passive: they offset passive income freely, and up to $25,000/yr can offset ordinary (W-2) income if you actively participate and your MAGI is under $100k (phasing out to $0 by $150k); unused losses carry forward. On sale, claimed depreciation is recaptured at up to 25%, and gains may owe capital-gains tax (a 1031 exchange can defer both). Figures are a year-1 estimate at your 24.0% rate — not tax advice; consult a CPA.
Schools (NCES district)
- District
- Calcasieu Parish
- NCES district ID
- 2200330
- Math proficiency
- 30% ▼ -39.00%
- Reading proficiency
- 44% ▼ -33.00%
- Median HH income
- $44,700
- Composite
- 31.45/100
- National rank
- #5979
- State rank
- #29 of 98 in LA
Livability — Sulphur
- Score
- 71/100
- State rank
- #48
- US rank
- #7164
Category grades
Schools grade is shown separately in the Schools card above.
Census & demographics
- Census place
- Sulphur, LA
- County
- Calcasieu Parish · 170,889 people
- City population
- 27,799
- Metro
- Lake Charles, LA
- Population (ZIP)
- 27,799
- Household income
- $64,707
- Rent vs Own
- Severe rent burden
- 197.0
Population outlook (Calcasieu County) Hauer SSP2
- Today (2025)
- 212,179 people
- By 2030
- 218,199 · +2.8%
- By 2040
- 228,486 · +7.7%
- By 2050
- 236,208 · +11.3%
- By 2075
- 251,696 · +18.6%
- By 2100
- 247,848 · +16.8%
Race, ethnicity, and origin ACS 2023
- Neighborhood character
- Predominantly White (82%)
- Race & ethnicity
- White 82% Black 8% Hispanic / Latino 5% Two or more races 4%
- Common ancestry
- Lithuanian 13% Slovak 2% Scandinavian 1%
- Foreign-born
- 3% · Canada, Vietnam
- Languages at home
- 94% English-only · Spanish 2% French/Haitian/Cajun 2% Other Indo-European 1%
Political lean MEDSL · Calcasieu
- 2024 margin
- Solid R (+39.6) · D 29.5% · R 69.0% · Other 1.5%
- 2008→2024 swing
- -15.0pp toward R · 2008: -24.6pp · 2024: -39.6pp
- All cycles
- 2024: R+39.6 2020: R+35.2 2016: R+33.3 2012: R+28.7 2008: R+24.6
Not yet ingested
- Civics
- —
Market trends
- HPI YoY
- ▼ -104.29%
- Current HPI
- 100.0895
- Rent YoY
- ▲ 7.65%
- Metro
- Lake Charles, LA
- State GDP YoY
- ▲ 3.29%
- F500 in state
- 10
Industry mix (Fortune 500 HQ in LA)
| Industry | F500 HQs | Revenue |
|---|---|---|
| Telecommunications | 2 | $23B |
|
||
| Utilities | 1 | $12B |
|
||
| Wholesale / Distribution | 1 | $5B |
|
||
| Advertising | 1 | $2B |
|
||
Price history
1 event — show timeline
- 2026-05-29 Listed $215,000 SWLAR
Property tax history
-0.7%/yrLatest (2025): $1,475 · +0.8% YoY. Source: county tax records.
Cash-flow waterfall
monthlySold comps — $/sqft
last 12 mo · ≤1 miLoading sold comps…