 🏷️ Likely Rental
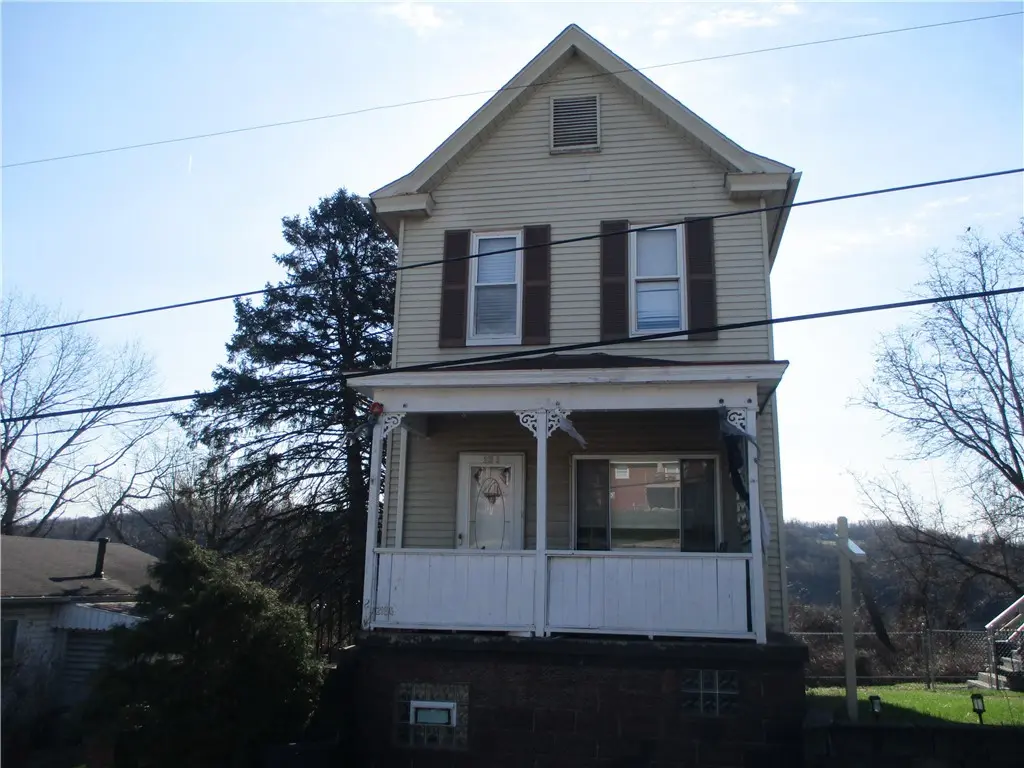
218 S Mellon Ave · Donora, PA
Flood risk 1/10 · Minimal
- FEMA flood zone
- X (unshaded)
- Chance of flooding over 30 yrs
- 0.0%
- Est. flood insurance / yr
- $473 – $860
Fire risk 1/10 · Minimal
- Est. fire insurance / yr
- $511 – $949
Heat risk 4/10 · Minor
- Hot days now (above 98°F)
- 7 days/yr
- Hot days in 30 yrs
- 19 days/yr
Wind risk 2/10 · Minimal
- Chance of severe wind over 30 yrs
- —
Air-quality risk 2/10 · Minimal
- Unhealthy air days now
- 1 days/yr
- Unhealthy air days in 30 yrs
- 2 days/yr
Risk factors via First Street. Map © Google.
Why this score? — see what drove the A- grade
The composite is a weighted blend of 9 inputs, each scored 0–100. Each bar is that input's sub-score; the figure is the points it added to the 100-point composite (weight × sub-score).
- Cash flow +30.0/30.0
- ARV discount +15.0/15.0
- 1% rule +10.0/10.0
- DSCR +10.0/10.0
- Appreciation +7.5/10.0
- Livability +3.2/5.0
- Rent growth +2.5/5.0
- Condition / age +2.5/5.0
- Schools +2.4/10.0
$44,900
🖨 Deal sheet 📄 Offer letter ✓ Due diligence
Listing remarks
Attention Investors! Check out this large 3 bedroom home two story home in Donora. Long time month to month tenant occupied. Large kitchen and interior is in good condition. 3 generous sized bedrooms on top floor. Small side yard and private back yard. Covered front porch. Low taxes!! Add this property to your portfolio.
Key facts
- Covered front porch
- Private back yard
- Large kitchen
Tags
Neighborhood map
What this means for you Summary
Snapshot
- This is a 3-bed/1.0-bath single-family listed at $45k.
Deal economics
- At list price, monthly cash flow is $560 ($7k/yr) — positive.
- The deal already cash-flows at list — no discount required.
- Meets the 1% rule at list price ($1k rent vs $45k).
- Recommended offer: $44k (1.5% below list) — sets the bar for market timing.
Location & tenants
- Location reads 64/100 on livability (#1,198 in PA) — a middle-class / working-renter tenant base. Strengths: cost of living A+, housing A+, crime A-; Watch: health & safety D, schools F, amenities F.
- Ringgold SD (suburban): math 19% / reading 36% proficiency, ranked #452 of 539 in PA (top 84%) — low school quality limits family demand, transient renter base, plan for 1-2y turnover.
- Market conditions: 21 active listings in the ZIP; 2 comparable units currently listed for rent nearby; lower-income renter base — watch delinquency; 489 units permitted in Washington County in 2024 (30 in 5+ unit buildings).
- This rent runs 34% of the median local income ($40k/yr) — at the standard rent-burdened threshold; future hikes will face affordability resistance.
Forward outlook
- In year one you build about $3k of equity ($310 loan paydown + $2k appreciation (5.0% local appreciation)).
- Washington County population projected to shrink 6% by 2050 — rents likely to lag national; underwrite the cash flow, not the appreciation.
- At projected returns (5.0% appreciation + 3.0% rent growth), your $13k cash investment doubles in ~2 years — after that, you're playing with house money.
Negotiation context
- It's been on market 25 days — a 2% lower offer ($44k) is reasonable based on typical stale-listing flexibility.
Risks & watch-outs
- Watch-outs: built in 1907 — expect roof / HVAC / electrical / plumbing capex.
Questions for the listing agent
- Built in 1907 — when were the roof, HVAC, electrical panel, plumbing, and water heater last replaced?
- Is there a deadline driving the sale (1031 exchange, divorce, estate, relocation)? That informs how much negotiation room exists.
- Schools are F-rated, which usually means shorter tenancies and higher turnover. Who's the typical renter profile here, and what's been the actual vacancy rate?
- What's the average days-on-market for RENTAL listings here right now (not sales)? A rising rental-DOM trend means longer vacancies and softer asking-rent achievability than the comps imply.
- What's the recent tenant-quality profile in this submarket — average credit score on applications, eviction rate, late-payment / NSF rate, and stable-employment percentage? A property-management company in the area should have these aggregated.
- How much new for-sale + rental construction is in the pipeline within 1–3 miles? Heavy new supply typically softens prices + rents 12–24 months out; constrained supply supports both.
Investment metrics
- 1% rule
- 2.49% ✓
- Cap rate
- 21.27%
- Cash-on-cash
- 53.48%
- DSCR
- 3.38
- GRM
- 3.4
CMA / ARV
- ARV (on-the-fly)
- $59,904
- Comps found
- 9
Show comp detail 9 sales within ~0.75 mi
| Address | Dist | Beds/Ba | Sqft | Sold | Price | $/sf | Match |
|---|---|---|---|---|---|---|---|
| 832 Walnut St | 0.34mi | 3/2.0 | 1,107 (-4%) | 9mo | $162,000 | $146 | 66 |
| 85 Castner Ave | 0.35mi | 2/1.5 (-1) | 1,163 (+1%) | 15mo | $8,700 | $7 | 63 |
| 37 Watkins Ave | 0.25mi | 3/2.0 | 1,176 (+2%) | 23mo | $57,000 | $48 | 62 |
| 127 Cherry Way | 0.41mi | 2/1.0 (-1) | 1,092 (-5%) | 8mo | $66,250 | $61 | 61 |
| 329 3rd St | 0.53mi | 2/1.0 (-1) | 1,211 (+5%) | 9mo | $8,500 | $7 | 54 |
| 30 Manor Rd | 0.68mi | 3/2.0 | 1,230 (+7%) | 10mo | $190,000 | $154 | 44 |
| 401 Short St | 0.60mi | 3/2.0 | 1,264 (+10%) | 10mo | $19,900 | $16 | 44 |
| 400 Waddell Ave | 0.64mi | 2/1.0 (-1) | 1,120 (-3%) | 21mo | $89,000 | $79 | 43 |
| 425 4th St | 0.58mi | 2/2.0 (-1) | 1,260 (+9%) | 23mo | $65,000 | $52 | 29 |
Match score weights: distance 35% · size 25% · config 20% · recency 20%. Top-matched comps best support the ARV.
Projected returns pro-forma
5.03% appreciation · 3.0% rent growth · sell at horizon
- IRR
- 60.9%
- Equity multiple
- 4.67×
- Total profit
- $46,134
- Equity at exit
- $25,523
- IRR
- 58.6%
- Equity multiple
- 9.64×
- Total profit
- $108,630
- Equity at exit
- $44,116
Cash invested: $12,572 (down + closing). Projections, not guarantees.
Landlord ↔ Tenant lean methodology
- Overall (STATE)
- 62 Landlord-Friendly
- State Pennsylvania
- 62 Landlord-Friendly · EVEN
- County
- — inherits STATE
- City
- — inherits STATE
ZIP-level market 15033
- Home prices YoY
- 4.8%
- Active inventory
- 21
- Price-to-rent
- 3.4×
Monthly cashflow live
- Estimated rent
- $1,116 medium interval (Pro) →
- Mortgage (P&I)
- −$235
- Tax from tax record
- −$67 /mo · $809/yr
- Insurance
- −$19
- HOA
- −$0
- Vacancy / Maint / Mgmt
- −$234
- Net cashflow
- $560
Break-even live
UW: 25.0% down · 7.5% · 30yr · 1.5% tax · 5.0% vac · 8.0% maint · 8.0% mgmt
Financing live
Cash to close
- Down payment
- $11,225
- Closing costs
- $1,347
- Reserves months
- —
- Total cash needed
- —
Loan-product check · same deal, 3 products live
Conventional
25% down · 7.5% · 30yr
- Down + closing
- —
- Monthly P&I
- —
- Monthly cashflow
- —
- DSCR
- —
- Eligible?
- —
Personal DTI + credit; lowest rate.
DSCR
20% down · 8.5% · 30yr
- Down + closing
- —
- Monthly P&I
- —
- Monthly cashflow
- —
- DSCR
- —
- Eligible?
- —
No personal income docs; deal must DSCR.
Hard money
10% down · 12.0% · 12mo
- Down + closing
- —
- Monthly P&I
- —
- Monthly cashflow
- —
- DSCR
- —
- Eligible?
- —
Short-term bridge; refi at stabilization.
Rent comps 2 comps
| Address | Beds | Baths | Sqft | Rent | $/sqft | DOM | Units | Dist |
|---|---|---|---|---|---|---|---|---|
| 404 1st St Unit 404 Donora, PA | 2.0 | 1.0 | 900 | $1,150 | $1.28 | 1d | 1 | 0.38mi |
| 641 3rd St Donora, PA | 2.0 | 1.5 | 950 | $1,000 | $1.05 | 43d | 1 | 0.55mi |
Listing history 4 events
-
2026-04-10status Pending
-
2026-04-03price $44,900
-
2026-03-15$49,900 Active
-
2014-09-18soldstatus $164,990
ⓘ Source: listings_history table (triggers on properties + properties_extension) + one-shot
backfill from property_details.listing_events for pre-trigger history.
Tax reassessment forecast PA · Partial reset (capped growth)
- Current annual tax
- $809 · $67/mo
- Projected year-2 tax
- $809 · $67/mo
- Expected delta
- $0/yr ($0/mo · 0.0%)
ⓘ Screening estimate from a state-policy table — verify with the county assessor before closing.
Climate risk First Street
- Flood 1/10 Low FEMA zone X (unshaded) · 0% chance over 30 yrs
- Wildfire 1/10 Low
- Heat 4/10 Moderate 7 d/yr ≥98°F today · 19 d/yr by 30 yrs out
- Wind 2/10 Low
- Air quality 2/10 Low 1 unhealthy d/yr today · 2 by 30 yrs out
Nearby sold comps map
Loading sold comps map…
Walkable amenities ~0.75 mi
Loading nearby amenities…
Taxation est. · year 1
- Rental income
- $13,396
- − Mortgage interest
- −$2,515
- − Property taxes
- −$809
- − Insurance
- −$224
- − Repairs & maintenance
- −$1,072
- − Management
- −$1,072
- − Depreciation
- −$1,306
- Taxable income
- $6,398
- Est. tax owed @ 24.0%
- −$1,536
- After-tax cash flow
- $5,188/yr
For passive investors: Depreciation is non-cash, so a rental often shows a tax loss while cash-flowing — sheltering income. Rental losses are passive: they offset passive income freely, and up to $25,000/yr can offset ordinary (W-2) income if you actively participate and your MAGI is under $100k (phasing out to $0 by $150k); unused losses carry forward. On sale, claimed depreciation is recaptured at up to 25%, and gains may owe capital-gains tax (a 1031 exchange can defer both). Figures are a year-1 estimate at your 24.0% rate — not tax advice; consult a CPA.
Schools (NCES district)
- District
- Ringgold SD
- NCES district ID
- 4220400
- Math proficiency
- 19% ▼ -20.00%
- Reading proficiency
- 36% ▼ -18.00%
- Median HH income
- $46,754
- Composite
- 23.75/100
- National rank
- #7819
- State rank
- #452 of 539 in PA
Livability — Donora
- Score
- 64/100
- State rank
- #1198
- US rank
- #14079
Category grades
Schools grade is shown separately in the Schools card above.
Census & demographics
- Census place
- Donora, PA
- County
- Washington County · 106,469 people
- City population
- 4,572
- Metro
- Pittsburgh, PA
- Population (ZIP)
- 4,572
- Household income
- $39,921
- Rent vs Own
- Severe rent burden
- 363.0
Population outlook (Washington County) Hauer SSP2
- Today (2025)
- 208,060 people
- By 2030
- 207,168 · -0.4%
- By 2040
- 202,738 · -2.6%
- By 2050
- 195,269 · -6.1%
- By 2075
- 175,588 · -15.6%
- By 2100
- 145,827 · -29.9%
Race, ethnicity, and origin ACS 2023
- Neighborhood character
- Predominantly White (73%)
- Race & ethnicity
- White 73% Black 16% Two or more races 9% Hispanic / Latino 3%
- Common ancestry
- Scotch-Irish 5% Romanian 5% Subsaharan African 1%
- Foreign-born
- 1%
Political lean MEDSL · Washington
- 2024 margin
- Strong R (+25.5) · D 36.9% · R 62.4%
- 2008→2024 swing
- -20.8pp toward R · 2008: -4.7pp · 2024: -25.5pp
- All cycles
- 2024: R+25.5 2020: R+22.8 2016: R+25.3 2012: R+13.3 2008: R+4.7
Not yet ingested
- Civics
- —
Market trends
- HPI YoY
- ▲ 5.03%
- Current HPI
- 110.5976
- Rent YoY
- —
- Metro
- Pittsburgh, PA
- State GDP YoY
- ▲ 1.68%
- F500 in state
- 34
Industry mix (Fortune 500 HQ in PA)
| Industry | F500 HQs | Revenue |
|---|---|---|
| Healthcare | 2 | $309B |
|
||
| Insurance | 2 | $27B |
|
||
| Telecommunications / Media | 1 | $124B |
|
||
| Industrial Distribution | 1 | $22B |
|
||
| Financial Services | 1 | $20B |
|
||
| Chemicals / Materials | 1 | $18B |
|
||
Price history
-72.8% since first listed4 events — show timeline
- 2026-04-10 Pending — West Penn MLS
- 2026-04-03 Price Changed $44,900 West Penn MLS
- 2026-03-15 Listed $49,900 West Penn MLS
- 2014-09-18 Sold (Public Records) $164,990 Public Records
Property tax history
-1.2%/yrLatest (2026): $809 · +2.8% YoY. Source: county tax records.
Cash-flow waterfall
monthlySold comps — $/sqft
last 12 mo · ≤1 miLoading sold comps…