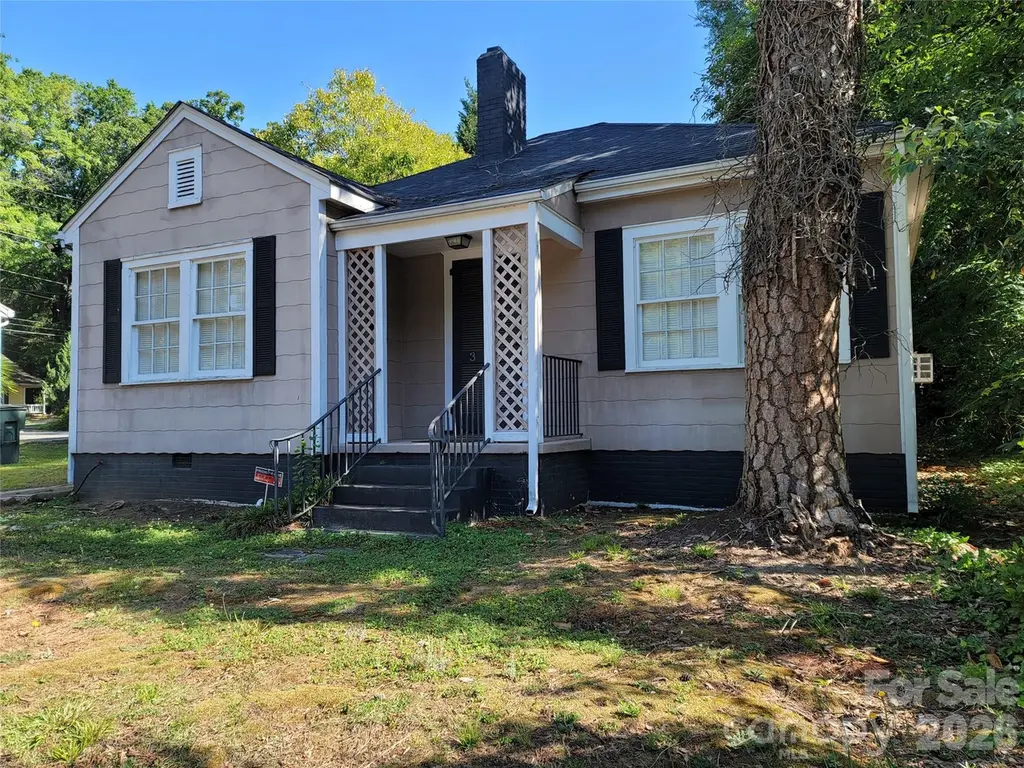
318 W Sixth Ave · Gastonia, NC
Flood risk 1/10 · Minimal
- FEMA flood zone
- X (unshaded)
- Chance of flooding over 30 yrs
- 0.0%
- Est. flood insurance / yr
- $507 – $1,088
Fire risk 1/10 · Minimal
- Est. fire insurance / yr
- $906 – $1,684
Heat risk 6/10 · Moderate
- Hot days now (above 104°F)
- 7 days/yr
- Hot days in 30 yrs
- 17 days/yr
Wind risk 5/10 · Moderate
- Chance of severe wind over 30 yrs
- 22.0%
Air-quality risk 3/10 · Minor
- Unhealthy air days now
- 3 days/yr
- Unhealthy air days in 30 yrs
- 3 days/yr
Risk factors via First Street. Map © Google.
Why this score? — see what drove the C- grade
The composite is a weighted blend of 9 inputs, each scored 0–100. Each bar is that input's sub-score; the figure is the points it added to the 100-point composite (weight × sub-score).
- Cash flow +16.4/30.0
- ARV discount +15.0/15.0
- DSCR +5.1/10.0
- Rent growth +3.9/5.0
- 1% rule +3.8/10.0
- Schools +3.6/10.0
- Livability +3.0/5.0
- Condition / age +2.5/5.0
- Appreciation +0.0/10.0
$175,000
🖨 Deal sheet (PDF) 📄 Offer letter ✓ Due diligence
Listing remarks
Cute bungalow located in the York Chester Historic District. Approx. 1300 heated square feet. 2 bedroom, 1 full bath, living room, dining room, kitchen with breakfast area, den. Nice floor plan with some hardwood floors, fireplace, wood shutters to remain along with range and refrigerator. This home is ready for a new owner but it does need some TLC. The heat is oil and the air conditioner is window units. Seller is selling this home "As Is" and will do no repairs. This is a must show!
Key facts
- Wood shutters
- Hardwood floors
- Breakfast area
Tags
Property features AI
Finance
- Other: Located in York Chester Historic District — must comply with local historic district restrictions
- HOA & community: No HOA
Exterior
- Parking: Driveway
- Security: Security system
- Utilities: City water; Public sewer
- Home design: Single-family residence; One level
- Construction: Site-built construction; Asbestos exterior materials; Composition roof; Crawl space foundation; Built as a one-story home
- Exterior features: Front porch; Rear porch; Publicly maintained paved road access; Lot approximately 0.11 acres
Interior
- Kitchen: Electric range; Refrigerator
- Bedrooms: 2 bedrooms on the main level
- Flooring: Tile flooring; Wood flooring
- Bathrooms: 1 full bathroom on the main level
- Heating & cooling: Oil heating; Window unit air conditioning
- Interior features: 8 total rooms; Window treatments; Living room fireplace; Security system
- Laundry & utility: Washer and dryer; Main-level laundry
Neighborhood map
What this means for you Summary
Snapshot
- This is a 3-bed/1.0-bath single-family listed at $175k.
Deal economics
- At list price, monthly cash flow is $99 ($1k/yr) — positive.
- The deal already cash-flows at list — no discount required.
- To meet the 1% rule (rent ≥ 1% of price), the offer needs to be $155k (11.5% below list).
- Recommended offer: $155k (11.5% below list) — sets the bar for 1% rule.
- Cap rate 7.0% vs local median 3.7% in Gastonia — top-decile yield for the area; either an underpriced asset or a hidden risk that comps aren't pricing in. Stress-test before assuming the spread holds.
Location & tenants
- Location reads 59/100 on livability (#528 in NC) — a working-class tenant base; expect higher turnover. Strengths: cost of living A+, housing A+; Watch: employment D, crime F, amenities F.
- Gaston County Schools (suburban): math 44% / reading 42% proficiency, ranked #93 of 178 in NC (top 52%) — families likely to look elsewhere, expect single-tenant / working-renter base with shorter leases.
- Zoned schools: Sherwood Elementary (math 19% / reading 22%, grade F, #1,228 of 1,410 statewide, top 87%, 514 students, 84% FRL); York Chester Middle (math 27% / reading 24%, grade F, #388 of 475 statewide, top 83%, 431 students, 98% FRL); Hunter Huss High (math 37% / reading 38%, grade F, #411 of 535 statewide, top 77%, 1,120 students, 80% FRL) — zoned schools average 87% FRL vs 37% district-wide (51 pts higher); higher-poverty schools than district average — tighter screening recommended.
- Zoned-school proficiency averages 28% at this address vs 43% district-wide (-15 pts) — the specific schools serving this property underperform the Gaston County Schools average; the district grade overstates school quality for this exact location.
- Market conditions: Rents rising fast (+5.6%/yr); 352 active listings in the ZIP; 33 comparable units currently listed for rent nearby; rentals at typical pace (median 23d on market — plan ~3-4 weeks tenant-placement turnaround); 2,069 units permitted in Gaston County in 2024 (142 in 5+ unit buildings).
- This rent runs 37% of the median local income ($50k/yr) — at the standard rent-burdened threshold; future hikes will face affordability resistance.
Forward outlook
- Local home prices are declining (-3.0%/yr); year-one equity from $1k of loan paydown is wiped out by about $5k of value loss. Plan a longer hold.
- Gaston County population projected at +12% by 2050 — modest demand growth; plan on rents tracking national, not racing it.
Negotiation context
- It's been on market 25 days — a 2% lower offer ($172k) is reasonable based on typical stale-listing flexibility.
- Current owner paid $58k; list at $175k implies a 202% gain — meaningful room to come down on a strong offer.
Risks & watch-outs
- Watch-outs: built in 1939 — expect roof / HVAC / electrical / plumbing capex.
- Climate carrying-cost: moderate wind risk, 22% chance of damaging wind over 30y; extreme-heat days projected 7→17/yr by 2055 (HVAC capex compounding) — expect insurance premiums to compound above CPI over the hold.
Questions for the listing agent
- Built in 1939 — when were the roof, HVAC, electrical panel, plumbing, and water heater last replaced?
- Is there a deadline driving the sale (1031 exchange, divorce, estate, relocation)? That informs how much negotiation room exists.
- Schools are D-rated, which usually means shorter tenancies and higher turnover. Who's the typical renter profile here, and what's been the actual vacancy rate?
- Crime grade is F in this area — have there been break-ins, vandalism, or insurance claims at this property in the last 3 years? What carrier currently insures it and at what premium?
- What's the average days-on-market for RENTAL listings here right now (not sales)? A rising rental-DOM trend means longer vacancies and softer asking-rent achievability than the comps imply.
- What's the recent tenant-quality profile in this submarket — average credit score on applications, eviction rate, late-payment / NSF rate, and stable-employment percentage? A property-management company in the area should have these aggregated.
- How much new for-sale + rental construction is in the pipeline within 1–3 miles? Heavy new supply typically softens prices + rents 12–24 months out; constrained supply supports both.
Investment metrics
- 1% rule
- 0.88% ✗
- Cap rate
- 6.97%
- Cash-on-cash
- 2.43%
- DSCR
- 1.11
- GRM
- 9.4
CMA / ARV
- ARV (on-the-fly)
- $262,404
- Comps found
- 12
Show comp detail 12 sales within ~0.75 mi
| Address | Dist | Beds/Ba | Sqft | Sold | Price | $/sf | Match |
|---|---|---|---|---|---|---|---|
| 902 W 6th Ave | 0.39mi | 3/2.0 | 1,344 (+1%) | 1mo | $250,000 | $186 | 76 |
| 703 S South St | 0.26mi | 2/1.0 (-1) | 1,390 (+4%) | 5mo | $200,000 | $144 | 71 |
| 410 S Hill St | 0.38mi | 3/2.0 | 1,200 (-10%) | 1mo | $250,000 | $208 | 61 |
| 924 Springdale Ln | 0.61mi | 3/2.0 | 1,380 (+4%) | 5mo | $285,000 | $207 | 57 |
| 408 S Hill St | 0.39mi | 3/2.0 | 1,200 (-10%) | 6mo | $246,395 | $205 | 56 |
| 425 S Columbia St | 0.74mi | 3/1.0 | 1,285 (-4%) | 7mo | $150,000 | $117 | 54 |
| 205 E 8th Ave | 0.58mi | 3/2.0 | 1,219 (-8%) | 6mo | $240,000 | $197 | 50 |
| 403 Hillcrest Ave | 0.74mi | 2/2.0 (-1) | 1,291 (-3%) | 6mo | $289,000 | $224 | 47 |
| 722 Hillcrest Ave | 0.64mi | 2/1.0 (-1) | 1,462 (+10%) | 4mo | $240,000 | $164 | 46 |
| 609 Hillcrest Ave | 0.71mi | 2/1.5 (-1) | 1,210 (-9%) | 3mo | $218,000 | $180 | 42 |
| 411 Willow St | 0.69mi | 3/2.0 | 1,172 (-12%) | 3mo | $165,000 | $141 | 41 |
| 1401 S York Rd | 0.73mi | 3/2.0 | 1,480 (+11%) | 7mo | $320,000 | $216 | 37 |
Match score weights: distance 35% · size 25% · config 20% · recency 20%. Top-matched comps best support the ARV.
Projected returns pro-forma
-3.0% appreciation · 5.63% rent growth · sell at horizon
- IRR
- -9.7%
- Equity multiple
- 0.64×
- Total profit
- $-17,859
- Equity at exit
- $26,093
- IRR
- 2.7%
- Equity multiple
- 1.22×
- Total profit
- $10,683
- Equity at exit
- $15,131
Cash invested: $49,000 (down + closing). Projections, not guarantees.
Landlord ↔ Tenant lean methodology
- Overall (STATE)
- 85 Strongly Landlord-Friendly
- State North Carolina
- 85 Strongly Landlord-Friendly · R+3
- County
- — inherits STATE
- City
- — inherits STATE
ZIP-level market 28052
- Rents YoY
- 5.6%
- Active inventory
- 352
- Price-to-rent
- 9.4×
Monthly cashflow live
- Estimated rent
- $1,548 high interval (Pro) →
- Mortgage (P&I)
- −$918
- Tax from tax record
- −$133 /mo · $1,600/yr
- Insurance
- −$73
- HOA
- −$0
- Lot rent
- −$0
- Vacancy / Maint / Mgmt
- −$325
- Net cashflow
- $99
Break-even live
Sensitivity live
| Price | -10% $198 | -5% $149 | +0% $99 | +5% $50 | +10% $0 |
|---|---|---|---|---|---|
| Rent | -10% $-23 | -5% $38 | +0% $99 | +5% $160 | +10% $222 |
| Rate | -1.0pp $187 | -0.5pp $144 | base $99 | +0.5pp $54 | +1.0pp $8 |
UW: 25.0% down · 7.5% · 30yr · 1.5% tax · 5.0% vac · 8.0% maint · 8.0% mgmt
Financing live
Cash to close
- Down payment
- $43,750
- Closing costs
- $5,250
- Reserves months
- —
- Total cash needed
- —
Loan-product check · same deal, 3 products live
Conventional
25% down · 7.5% · 30yr
- Down + closing
- —
- Monthly P&I
- —
- Monthly cashflow
- —
- DSCR
- —
- Eligible?
- —
Personal DTI + credit; lowest rate.
DSCR
20% down · 8.5% · 30yr
- Down + closing
- —
- Monthly P&I
- —
- Monthly cashflow
- —
- DSCR
- —
- Eligible?
- —
No personal income docs; deal must DSCR.
Hard money
10% down · 12.0% · 12mo
- Down + closing
- —
- Monthly P&I
- —
- Monthly cashflow
- —
- DSCR
- —
- Eligible?
- —
Short-term bridge; refi at stabilization.
Rent comps 33 comps
| Address | Beds | Baths | Sqft | Rent | $/sqft | DOM | Units | Dist |
|---|---|---|---|---|---|---|---|---|
| 710 Neil St Gastonia, NC | 3.0 | 2.5 | 1505 | $1,675 | $1.11 | 17d | 1 | 0.18mi |
| 407 S Chester St Gastonia, NC | 2.0 | 1.5 | 1060 | $1,262 | $1.19 | 5d | 2 | 0.24mi |
| 511 S South St Gastonia, NC | 2.0 | 1.0 | 950 | $1,195 | $1.26 | 26d | 1 | 0.24mi |
| 903 W 6th Avenue B Gastonia, NC | 2.0 | 1.0 | 1111 | $1,450 | $1.31 | 23d | 1 | 0.48mi |
| 1216 Jackson Rd Gastonia, NC | 3.0 | 2.0 | 1254 | $1,825 | $1.46 | 26d | 1 | 0.50mi |
| 147 W Main Ave Gastonia, NC | 3.0 | 1.0–2.0 | 1080 | $2,250 | $2.08 | 26d | 8 | 0.64mi |
| 315 S Ransom St Gastonia, NC | 3.0 | 1.0 | 1012 | $1,399 | $1.38 | 17d | 1 | 0.65mi |
| 141 W Main Ave Gastonia, NC | 2.0 | 1.5 | 1200 | $1,599 | $1.33 | 26d | 1 | 0.66mi |
| 112 Miller St Gastonia, NC | 3.0 | 1.0 | 950 | $1,395 | $1.47 | 1d | 1 | 0.73mi |
| 112 Miller St Gastonia, NC | 3.0 | 1.0 | 950 | $1,395 | $1.47 | 26d | 1 | 0.73mi |
| 300 S Firestone St Gastonia, NC | 2.0 | 2.0 | 1488 | $1,825 | $1.23 | 13d | 1 | 0.76mi |
| 105 Summit St Gastonia, NC | 2.0 | 1.0 | 894 | $995 | $1.11 | 20d | 1 | 0.77mi |
| 106 S Dalton St Gastonia, NC | 3.0 | 2.0 | 1395 | $1,550 | $1.11 | 24d | 1 | 0.81mi |
| 112 Dean St Gastonia, NC | 2.0 | 2.0 | 882 | $1,400 | $1.59 | 26d | 1 | 0.83mi |
| 214 N King St Gastonia, NC | 3.0 | 1.0 | 1200 | $1,400 | $1.17 | 0d | 1 | 0.92mi |
| 401 N Highland St Gastonia, NC | 2.0 | 2.0 | 944 | $1,471 | $1.56 | 7d | 1 | 1.08mi |
| 1272 Union Rd Gastonia, NC | 3.0 | 1.0–2.0 | 708 | $1,526 | $2.16 | 0d | 11 | 1.10mi |
| 508 Pryor St Gastonia, NC | 3.0 | 1.0 | 1076 | $1,350 | $1.25 | 26d | 1 | 1.12mi |
| 118 W Harrison Ave Gastonia, NC | 2.0 | 1.0 | 1500 | $1,295 | $0.86 | 26d | 1 | 1.21mi |
| 412 N Scruggs St Gastonia, NC | 3.0 | 2.5 | 1338 | $1,695 | $1.27 | 26d | 1 | 1.21mi |
| 636 Stevens St Apt C Gastonia, NC | 2.0 | 1.5 | 925 | $1,250 | $1.35 | 26d | 1 | 1.23mi |
| 807 N Morris St Gastonia, NC | 3.0 | 1.0 | 1196 | $1,350 | $1.13 | 26d | 1 | 1.23mi |
| 636 Stevens St Apt P Gastonia, NC | 2.0 | 1.5 | 925 | $1,300 | $1.41 | 26d | 1 | 1.23mi |
| 817 W Davidson Ave Gastonia, NC | 3.0 | 2.0 | 1244 | $1,600 | $1.29 | 26d | 1 | 1.25mi |
| 516 Beacon St Gastonia, NC | 3.0 | 2.0 | 1347 | $1,800 | $1.34 | 26d | 1 | 1.27mi |
| 604 Westwood Cir Gastonia, NC | 2.0 | 1.0 | 886 | $1,450 | $1.64 | 1d | 1 | 1.28mi |
| 913 Nottingham Dr Unit 33 Gastonia, NC | 2.0 | 1.5 | 1120 | $1,000 | $0.89 | 19d | 1 | 1.30mi |
| 1613 Greenview Dr Gastonia, NC | 2.0 | 2.0 | 960 | $1,255 | $1.31 | 13d | 1 | 1.35mi |
| 1613 Greenview Dr Gastonia, NC | 2.0 | 2.0 | 960 | $1,255 | $1.31 | 6d | 1 | 1.35mi |
| 910 E Davis Ave Gastonia, NC | 2.0 | 1.0 | 900 | $1,288 | $1.43 | 7d | 2 | 1.39mi |
| 814 Dewey St Gastonia, NC | 3.0 | 2.0 | 1104 | $1,740 | $1.58 | 1d | 1 | 1.45mi |
| 917 N Oakland St Gastonia, NC | 2.0 | 1.0 | 1410 | $1,150 | $0.82 | 24d | 1 | 1.46mi |
| 1731 Parkdale Ave Gastonia, NC | 3.0 | 2.0 | 1159 | $1,475 | $1.27 | 15d | 1 | 1.48mi |
Listing history 17 events
-
2026-06-22days on market $175,000 Active 25 DOM
-
2026-06-21days on market $175,000 Active 24 DOM
-
2026-06-18days on market $175,000 Active 21 DOM
-
2026-06-17days on market $175,000 Active 20 DOM
-
2026-06-16days on market $175,000 Active 19 DOM
-
2026-06-15days on market $175,000 Active 18 DOM
-
2026-06-13pricedays on market $175,000 Active 16 DOM
-
2026-06-09days on market $185,000 Active 12 DOM
-
2026-06-08days on market $185,000 Active 11 DOM
-
2026-06-07days on market $185,000 Active 10 DOM
-
2026-06-04days on market $185,000 Active 7 DOM
-
2026-06-03days on market $185,000 Active 6 DOM
-
2026-06-02days on market $185,000 Active 5 DOM
-
2026-06-01days on market $185,000 Active 4 DOM
-
2026-05-31days on market $185,000 Active 3 DOM
-
2026-05-28$185,000 Active
-
1998-08-31soldstatus $58,000
ⓘ Source: listings_history table (triggers on properties + properties_extension) + one-shot
backfill from property_details.listing_events for pre-trigger history.
Tax reassessment forecast NC · Resets to sale price
- Current annual tax
- $1,600 · $133/mo
- Projected year-2 tax
- $1,600 · $133/mo
- Expected delta
- $0/yr ($0/mo · 0.0%)
ⓘ Screening estimate from a state-policy table — verify with the county assessor before closing.
Climate risk First Street
- Flood 1/10 Low FEMA zone X (unshaded) · 0% chance over 30 yrs
- Wildfire 1/10 Low
- Heat 6/10 Major 7 d/yr ≥104°F today · 17 d/yr by 30 yrs out
- Wind 5/10 Major 22% chance of damaging wind over 30 yrs
- Air quality 3/10 Moderate 3 unhealthy d/yr today · 3 by 30 yrs out
Nearby sold comps map
Loading sold comps map…
Walkable amenities ~0.75 mi
Loading nearby amenities…
Taxation est. · year 1
- Rental income
- $18,580
- − Mortgage interest
- −$9,803
- − Property taxes
- −$1,600
- − Insurance
- −$875
- − Repairs & maintenance
- −$1,486
- − Management
- −$1,486
- − Depreciation
- −$5,091
- Taxable loss
- −$1,761
- Est. tax savings @ 24.0%
- +$423
- After-tax cash flow
- $1,614/yr
For passive investors: Depreciation is non-cash, so a rental often shows a tax loss while cash-flowing — sheltering income. Rental losses are passive: they offset passive income freely, and up to $25,000/yr can offset ordinary (W-2) income if you actively participate and your MAGI is under $100k (phasing out to $0 by $150k); unused losses carry forward. On sale, claimed depreciation is recaptured at up to 25%, and gains may owe capital-gains tax (a 1031 exchange can defer both). Figures are a year-1 estimate at your 24.0% rate — not tax advice; consult a CPA.
Schools (NCES district)
- District
- Gaston County Schools
- NCES district ID
- 3701620
- Math proficiency
- 44% ▲ 4.00%
- Reading proficiency
- 42% ▲ 1.00%
- Median HH income
- $43,644
- Composite
- 36.39/100
- National rank
- #4680
- State rank
- #93 of 178 in NC
Livability — Gastonia
- Score
- 59/100
- State rank
- #528
- US rank
- #19444
Category grades
Schools grade is shown separately in the Schools card above.
Census & demographics
- Census place
- Gastonia, NC
- County
- Gaston County · 201,497 people
- City population
- 114,179
- Metro
- Charlotte-Concord-Gastonia, NC-SC
- Population (ZIP)
- 36,272
- Household income
- $49,643
- Rent vs Own
- Severe rent burden
- 1521.0
Population outlook (Gaston County) Hauer SSP2
- Today (2025)
- 230,027 people
- By 2030
- 237,300 · +3.2%
- By 2040
- 249,659 · +8.5%
- By 2050
- 257,806 · +12.1%
- By 2075
- 272,163 · +18.3%
- By 2100
- 268,652 · +16.8%
Race, ethnicity, and origin ACS 2023
- Neighborhood character
- Diverse neighborhood (Simpson 0.65)
- Race & ethnicity
- White 46% Black 33% Hispanic / Latino 16% Two or more races 9%
- Hispanic origin (detail)
- Mexican 6% Puerto Rican 2%
- Common ancestry
- Serbian 2% Slovak 1% Italian 1%
- Foreign-born
- 7% · Canada, Dominican Republic, Jamaica
- Languages at home
- 86% English-only · Spanish 13%
Political lean MEDSL · Gaston
- 2024 margin
- Strong R (+25.0) · D 37.0% · R 62.1%
- 2008→2024 swing
- 0.0pp no change · 2008: -25.0pp · 2024: -25.0pp
- All cycles
- 2024: R+25.0 2020: R+27.8 2016: R+32.1 2012: R+25.6 2008: R+25.0
Not yet ingested
- Civics
- —
Market trends
- HPI YoY
- ▼ -348.71%
- Current HPI
- 252.912
- Rent YoY
- ▲ 5.63%
- Metro
- Charlotte-Concord-Gastonia, NC-SC
- State GDP YoY
- ▲ 3.28%
- F500 in state
- 26
Industry mix (Fortune 500 HQ in NC)
| Industry | F500 HQs | Revenue |
|---|---|---|
| Financial Services | 2 | $213B |
|
||
| Retail | 2 | $95B |
|
||
| Industrial Conglomerate | 1 | $38B |
|
||
| Metals / Steel | 1 | $35B |
|
||
| Utilities | 1 | $30B |
|
||
| Industrial Machinery | 1 | $19B |
|
||
Price history
+219.0% since first listed2 events — show timeline
- 2026-05-28 Listed $185,000 CANOPYMLS as Distributed by MLS Grid
- 1998-08-31 Sold (Public Records) $58,000 Public Records
Property tax history
+3.7%/yrLatest (2025): $1,600 · +0.0% YoY. Source: county tax records.
Cash-flow waterfall
monthlySold comps — $/sqft
last 12 mo · ≤1 miLoading sold comps…