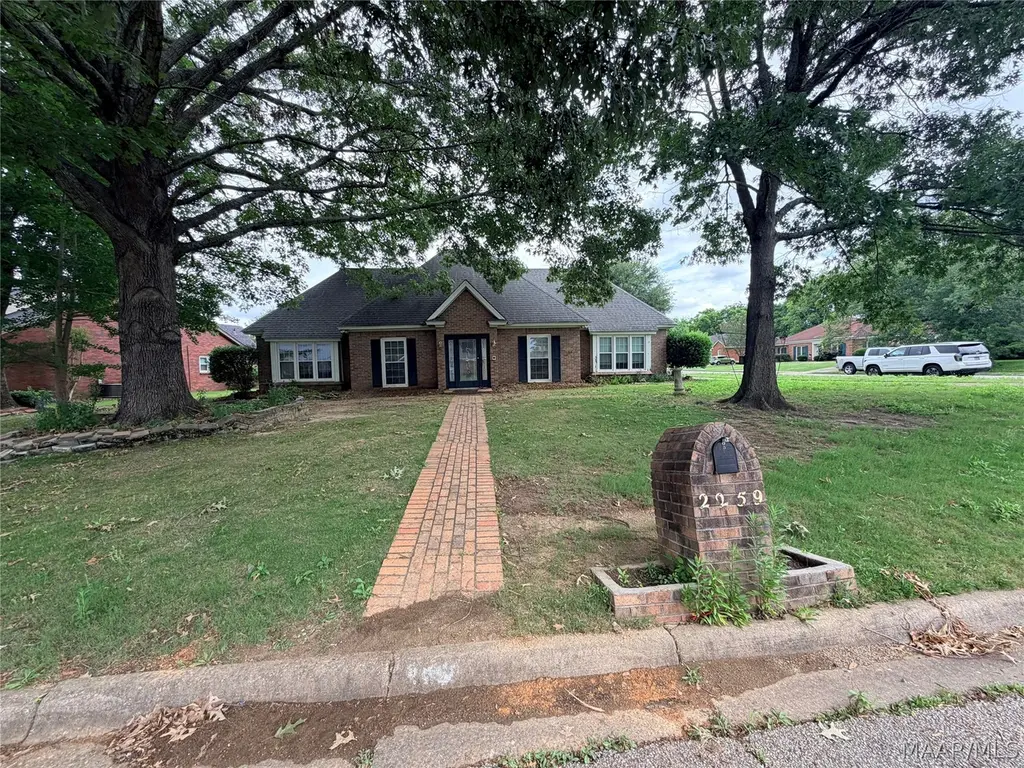
2259 Cannonball Dr · Montgomery, AL
Flood risk 1/10 · Minimal
- FEMA flood zone
- X (unshaded)
- Chance of flooding over 30 yrs
- 0.0%
- Est. flood insurance / yr
- $507 – $1,088
Fire risk 3/10 · Minor
- Est. fire insurance / yr
- $916 – $1,700
Heat risk 8/10 · Major
- Hot days now (above 108°F)
- 7 days/yr
- Hot days in 30 yrs
- 20 days/yr
Wind risk 8/10 · Major
- Chance of severe wind over 30 yrs
- 80.0%
Air-quality risk 2/10 · Minimal
- Unhealthy air days now
- 1 days/yr
- Unhealthy air days in 30 yrs
- 3 days/yr
Risk factors via First Street. Map © Google.
Why this score? — see what drove the B- grade
The composite is a weighted blend of 9 inputs, each scored 0–100. Each bar is that input's sub-score; the figure is the points it added to the 100-point composite (weight × sub-score).
- Cash flow +27.0/30.0
- ARV discount +15.0/15.0
- DSCR +9.3/10.0
- 1% rule +6.4/10.0
- Rent growth +3.9/5.0
- Livability +3.2/5.0
- Condition / age +2.5/5.0
- Schools +1.7/10.0
- Appreciation +0.0/10.0
$169,900
🖨 Deal sheet 📄 Offer letter ✓ Due diligence
Listing remarks MLS
Entered for comp purposes only.
Key facts
- Large corner lot
- Extra-large den
- Backyard pool
Tags
Property features AI
Exterior
- Parking: Driveway; Parking pad (3 pads)
- Security: Fire alarm
- Utilities: Public water; Public sewer; Utilities: Unknown
- Home design: One-story home; Brick construction; Slab foundation
- Construction: Brick exterior; Built according to public records
- Exterior features: Fully fenced yard with privacy fencing; Covered porch; Covered patio; Porch; Patio; Storage structure
Interior
- Kitchen: Dishwasher; Electric cooktop; Electric oven; Microwave; Refrigerator; Plumbed for ice maker; Smooth cooktop; Breakfast bar
- Bedrooms: Bedrooms located on the first floor
- Flooring: Carpet; Plank flooring; Tile; Vinyl
- Bathrooms: 2 full bathrooms; Double vanity; Separate shower; Garden/roman tub; Jetted tub
- Interior features: Wet bar; Tray ceilings; Double vanity; Garden/roman tub; Jetted tub; Linen closet; Separate shower; Walk-in closets; Window treatments; Breakfast bar; Blinds
- Laundry & utility: Washer hookup; Dryer hookup; Water heater
Neighborhood map
What this means for you Summary
Snapshot
- This is a 3-bed/2.0-bath single-family listed at $170k.
Deal economics
- At list price, monthly cash flow is $476 ($6k/yr) — positive.
- The deal already cash-flows at list — no discount required.
- Meets the 1% rule at list price ($2k rent vs $170k).
- Cap rate 9.7% vs local median 6.0% in Montgomery — top-decile yield for the area; either an underpriced asset or a hidden risk that comps aren't pricing in. Stress-test before assuming the spread holds.
Location & tenants
- Location reads 65/100 on livability (#138 in AL) — a middle-class / working-renter tenant base. Strengths: cost of living A+, housing A+; Watch: schools C-, employment D, crime F.
- Montgomery County (urban): math 9% / reading 31% proficiency, ranked #106 of 129 in AL (top 82%) — low school quality limits family demand, transient renter base, plan for 1-2y turnover; 70% free/reduced lunch — lower-income household profile, screen leases tightly.
- Market conditions: Rents rising fast (+5.7%/yr); 293 active listings in the ZIP; 18 comparable units currently listed for rent nearby; rentals at typical pace (median 21d on market — plan ~3-4 weeks tenant-placement turnaround); 460 units permitted in Montgomery County in 2024 (37 in 5+ unit buildings).
- This rent runs 42% of the median local income ($55k/yr) — at the standard rent-burdened threshold; future hikes will face affordability resistance.
Forward outlook
- Local home prices are declining (-3.0%/yr); year-one equity from $1k of loan paydown is wiped out by about $5k of value loss. Plan a longer hold.
- Montgomery County population projected to shrink 8% by 2050 — rents likely to lag national; underwrite the cash flow, not the appreciation.
- At projected returns (-3.0% appreciation + 5.7% rent growth), your $48k cash investment doubles in ~8 years — after that, you're playing with house money.
Negotiation context
- Only 7 days on market — expect competitive offers; lowballing is unlikely to land.
- 3 sale attempts with the ask held roughly flat each time — persistent listings suggest the price (not the market) is what's stuck; bring a comps-based counter.
- Current owner paid $60k; list at $170k implies a 183% gain — meaningful room to come down on a strong offer.
Risks & watch-outs
- Climate carrying-cost: severe wind risk, 80% chance of damaging wind over 30y; extreme-heat days projected 7→20/yr by 2055 (HVAC capex compounding) — expect insurance premiums to compound above CPI over the hold.
Questions for the listing agent
- Is there a deadline driving the sale (1031 exchange, divorce, estate, relocation)? That informs how much negotiation room exists.
- Crime grade is F in this area — have there been break-ins, vandalism, or insurance claims at this property in the last 3 years? What carrier currently insures it and at what premium?
- What's the average days-on-market for RENTAL listings here right now (not sales)? A rising rental-DOM trend means longer vacancies and softer asking-rent achievability than the comps imply.
- What's the recent tenant-quality profile in this submarket — average credit score on applications, eviction rate, late-payment / NSF rate, and stable-employment percentage? A property-management company in the area should have these aggregated.
- How much new for-sale + rental construction is in the pipeline within 1–3 miles? Heavy new supply typically softens prices + rents 12–24 months out; constrained supply supports both.
Investment metrics
- 1% rule
- 1.14% ✓
- Cap rate
- 9.66%
- Cash-on-cash
- 12.02%
- DSCR
- 1.53
- GRM
- 7.3
CMA / ARV
- ARV (on-the-fly)
- $268,125
- Comps found
- 12
Show comp detail 12 sales within ~0.75 mi
| Address | Dist | Beds/Ba | Sqft | Sold | Price | $/sf | Match |
|---|---|---|---|---|---|---|---|
| 2259 Cannonball Dr | 0.00mi | 4/2.0 (+1) | 2,145 (0%) | 1mo | $60,000 | $28 | 94 |
| 2219 Walbash Dr | 0.06mi | 4/2.0 (+1) | 2,182 (+2%) | 6mo | $255,000 | $117 | 84 |
| 2030 Short Line Dr | 0.14mi | 3/2.0 | 2,006 (-6%) | 1mo | $253,800 | $127 | 82 |
| 3317 Knotts Dr | 0.35mi | 4/2.5 (+1) | 2,256 (+5%) | 1mo | $334,400 | $148 | 67 |
| 3936 Claiborne Cir | 0.55mi | 4/2.0 (+1) | 2,169 (+1%) | 2mo | $285,000 | $131 | 66 |
| 3143 Leo Ln | 0.36mi | 4/2.5 (+1) | 2,256 (+5%) | 7mo | $331,400 | $147 | 62 |
| 2131 Walbash Dr | 0.15mi | 4/2.0 (+1) | 2,466 (+15%) | 3mo | $269,500 | $109 | 61 |
| 7105 Fair Oaks Ct | 0.40mi | 4/2.0 (+1) | 1,952 (-9%) | 4mo | $229,900 | $118 | 58 |
| 3712 Claiborne Cir | 0.57mi | 3/2.0 | 1,924 (-10%) | 2mo | $264,000 | $137 | 54 |
| 6413 Patrick Ct | 0.62mi | 4/2.5 (+1) | 2,365 (+10%) | 2mo | $295,500 | $125 | 45 |
| 2316 Haddington Rd | 0.58mi | 4/2.0 (+1) | 1,850 (-14%) | 4mo | $198,000 | $107 | 42 |
| 2725 W Aberdeen Dr | 0.75mi | 4/2.0 (+1) | 1,894 (-12%) | 4mo | $202,000 | $107 | 37 |
Match score weights: distance 35% · size 25% · config 20% · recency 20%. Top-matched comps best support the ARV.
Projected returns pro-forma
-3.0% appreciation · 5.65% rent growth · sell at horizon
- IRR
- 4.3%
- Equity multiple
- 1.17×
- Total profit
- $8,062
- Equity at exit
- $25,333
- IRR
- 15.9%
- Equity multiple
- 2.45×
- Total profit
- $68,845
- Equity at exit
- $14,690
Cash invested: $47,572 (down + closing). Projections, not guarantees.
Landlord ↔ Tenant lean methodology
- Overall (STATE)
- 90 Strongly Landlord-Friendly
- State Alabama
- 90 Strongly Landlord-Friendly · R+15
- County
- — inherits STATE
- City
- — inherits STATE
ZIP-level market 36116
- Home prices YoY
- -9.7%
- Rents YoY
- 5.7%
- Active inventory
- 293
- Price-to-rent
- 7.3×
Monthly cashflow live
- Estimated rent
- $1,934 high interval (Pro) →
- Mortgage (P&I)
- −$891
- Tax from tax record
- −$90 /mo · $1,078/yr
- Insurance
- −$71
- HOA
- −$0
- Vacancy / Maint / Mgmt
- −$406
- Net cashflow
- $476
Break-even live
UW: 25.0% down · 7.5% · 30yr · 1.5% tax · 5.0% vac · 8.0% maint · 8.0% mgmt
Financing live
Cash to close
- Down payment
- $42,475
- Closing costs
- $5,097
- Reserves months
- —
- Total cash needed
- —
Loan-product check · same deal, 3 products live
Conventional
25% down · 7.5% · 30yr
- Down + closing
- —
- Monthly P&I
- —
- Monthly cashflow
- —
- DSCR
- —
- Eligible?
- —
Personal DTI + credit; lowest rate.
DSCR
20% down · 8.5% · 30yr
- Down + closing
- —
- Monthly P&I
- —
- Monthly cashflow
- —
- DSCR
- —
- Eligible?
- —
No personal income docs; deal must DSCR.
Hard money
10% down · 12.0% · 12mo
- Down + closing
- —
- Monthly P&I
- —
- Monthly cashflow
- —
- DSCR
- —
- Eligible?
- —
Short-term bridge; refi at stabilization.
Rent comps 18 comps
| Address | Beds | Baths | Sqft | Rent | $/sqft | DOM | Units | Dist |
|---|---|---|---|---|---|---|---|---|
| 7104 Fair Oaks Ct Montgomery, AL | 3.0 | 2.0 | 1656 | $1,881 | $1.14 | 43d | 1 | 0.34mi |
| 7406 Mill Ridge Ct Montgomery, AL | 3.0 | 2.0 | 1785 | $2,250 | $1.26 | 44d | 1 | 0.45mi |
| 3712 Claiborne Cir Montgomery, AL | 3.0 | 2.0 | 1924 | $2,100 | $1.09 | 43d | 1 | 0.58mi |
| 2224 W Aberdeen Dr Montgomery, AL | 4.0 | 2.0 | 1994 | $1,600 | $0.80 | 21d | 1 | 0.69mi |
| 2420 Haddington Rd Unit 1519890P Montgomery, AL | 4.0 | 1.0 | 1679 | $4,483 | $2.67 | 13d | 1 | 0.69mi |
| 1530 Laurelwood Ln Montgomery, AL | 3.0 | 2.0 | 2274 | $2,295 | $1.01 | 13d | 1 | 1.03mi |
| 5540 Ash Grove Cir Montgomery, AL | 4.0 | 2.0 | 1904 | $2,200 | $1.16 | 21d | 1 | 1.06mi |
| 1944 Woodrun Dr Montgomery, AL | 3.0 | 2.0 | 1689 | $1,595 | $0.94 | 13d | 1 | 1.17mi |
| 8318 Chadburn Way Montgomery, AL | 4.0 | 2.5 | 2621 | $3,100 | $1.18 | 43d | 1 | 1.33mi |
| 8636 Harvest Ridge Dr Montgomery, AL | 3.0 | 2.0 | 2216 | $2,100 | $0.95 | 13d | 1 | 1.36mi |
| 8636 Harvest Ridge Dr Montgomery, AL | 3.0 | 2.0 | 2216 | $2,200 | $0.99 | 21d | 1 | 1.36mi |
| 8706 Twelve Oaks Ln Montgomery, AL | 3.0 | 2.0 | 2050 | $2,100 | $1.02 | 21d | 1 | 1.41mi |
| 2140 Rexford Rd Montgomery, AL | 2.0 | 2.5 | 1428 | $1,275 | $0.89 | 43d | 1 | 1.43mi |
| 2229 Halcyon Downs Loop Unit 1525028P Montgomery, AL | 3.0 | 2.0 | 1571 | $5,675 | $3.61 | 13d | 1 | 1.47mi |
| 1857 Still Oaks Dr Montgomery, AL | 4.0 | 2.0 | 1791 | $1,850 | $1.03 | 21d | 1 | 1.48mi |
| 2066 Rexford Rd Montgomery, AL | 3.0 | 2.5 | 1632 | $1,250 | $0.77 | 21d | 1 | 1.48mi |
| 2060 Rexford Rd Montgomery, AL | 3.0 | 2.5 | 1566 | $925 | $0.59 | 21d | 1 | 1.49mi |
| 4647 Broadwick St Unit 4647 Montgomery, AL | 2.0 | 2.5 | 1750 | $2,400 | $1.37 | 43d | 1 | 1.49mi |
Listing history 10 events
-
2026-06-03days on market $169,900 Active 7 DOM
-
2026-06-02days on market $169,900 Active 6 DOM
-
2026-06-01days on market $169,900 Active 5 DOM
-
2026-05-31days on market $169,900 Active 4 DOM
-
2026-05-30days on market $169,900 Active 3 DOM
-
2026-05-27$169,900 Active
-
2026-05-20soldstatus $60,000 Closed 31-char remark
Show marketing remark (31 chars)
Entered for comp purposes only.
-
2026-05-16status Pending 31-char remark
Show marketing remark (31 chars)
Entered for comp purposes only.
-
2026-05-04Contingent 31-char remark
Show marketing remark (31 chars)
Entered for comp purposes only.
-
2026-05-04$100,000 31-char remark
Show marketing remark (31 chars)
Entered for comp purposes only.
ⓘ Source: listings_history table (triggers on properties + properties_extension) + one-shot
backfill from property_details.listing_events for pre-trigger history.
Tax reassessment forecast AL · Resets to sale price
- Current annual tax
- $1,078 · $90/mo
- Projected year-2 tax
- $1,078 · $90/mo
- Expected delta
- $0/yr ($0/mo · 0.0%)
ⓘ Screening estimate from a state-policy table — verify with the county assessor before closing.
Climate risk First Street
- Flood 1/10 Low FEMA zone X (unshaded) · 0% chance over 30 yrs
- Wildfire 3/10 Moderate
- Heat 8/10 Severe 7 d/yr ≥108°F today · 20 d/yr by 30 yrs out
- Wind 8/10 Severe 80% chance of damaging wind over 30 yrs
- Air quality 2/10 Low 1 unhealthy d/yr today · 3 by 30 yrs out
Nearby sold comps map
Loading sold comps map…
Walkable amenities ~0.75 mi
Loading nearby amenities…
Taxation est. · year 1
- Rental income
- $23,211
- − Mortgage interest
- −$9,517
- − Property taxes
- −$1,078
- − Insurance
- −$850
- − Repairs & maintenance
- −$1,857
- − Management
- −$1,857
- − Depreciation
- −$4,943
- Taxable income
- $3,110
- Est. tax owed @ 24.0%
- −$746
- After-tax cash flow
- $4,971/yr
For passive investors: Depreciation is non-cash, so a rental often shows a tax loss while cash-flowing — sheltering income. Rental losses are passive: they offset passive income freely, and up to $25,000/yr can offset ordinary (W-2) income if you actively participate and your MAGI is under $100k (phasing out to $0 by $150k); unused losses carry forward. On sale, claimed depreciation is recaptured at up to 25%, and gains may owe capital-gains tax (a 1031 exchange can defer both). Figures are a year-1 estimate at your 24.0% rate — not tax advice; consult a CPA.
Schools (NCES district)
- District
- Montgomery County
- NCES district ID
- 0102430
- Math proficiency
- 9% ▼ -21.00%
- Reading proficiency
- 31% ▼ -1.00%
- Median HH income
- $43,902
- Composite
- 17.24/100
- National rank
- #9093
- State rank
- #106 of 129 in AL
Livability — Montgomery
- Score
- 65/100
- State rank
- #138
- US rank
- #13416
Category grades
Schools grade is shown separately in the Schools card above.
Census & demographics
- Census place
- Montgomery, AL
- County
- Montgomery County · 190,016 people
- City population
- 175,913
- Metro
- Montgomery, AL
- Population (ZIP)
- 45,250
- Household income
- $55,160
- Rent vs Own
- Severe rent burden
- 2786.0
Population outlook (Montgomery County) Hauer SSP2
- Today (2025)
- 224,008 people
- By 2030
- 221,460 · -1.1%
- By 2040
- 214,179 · -4.4%
- By 2050
- 204,912 · -8.5%
- By 2075
- 177,821 · -20.6%
- By 2100
- 145,134 · -35.2%
Race, ethnicity, and origin ACS 2023
- Neighborhood character
- Predominantly Black (80%)
- Race & ethnicity
- Black 80% White 12% Two or more races 4% Asian 3% Hispanic / Latino 2%
- Common ancestry
- Italian 1%
- Foreign-born
- 5% · Canada, South Korea
- Languages at home
- 94% English-only · Spanish 2% Other Indo-European 1% Korean 1%
Political lean MEDSL · Montgomery
- 2024 margin
- Solid D (+30.7) · D 64.8% · R 34.1% · Other 1.1%
- 2008→2024 swing
- +11.5pp toward D · 2008: 19.2pp · 2024: 30.7pp
- All cycles
- 2024: D+30.7 2020: D+31.5 2016: D+26.2 2012: D+24.3 2008: D+19.2
Not yet ingested
- Civics
- —
Market trends
- HPI YoY
- ▼ -16.31%
- Current HPI
- 151.8598
- Rent YoY
- ▲ 5.65%
- Metro
- Montgomery, AL
- State GDP YoY
- ▲ 2.94%
- F500 in state
- 4
Industry mix (Fortune 500 HQ in AL)
| Industry | F500 HQs | Revenue |
|---|---|---|
| Financial Services | 1 | $8B |
|
||
| Healthcare | 1 | $5B |
|
||
Price history
+69.9% since first listed5 events — show timeline
- 2026-05-27 Listed $169,900 MAAR
- 2026-05-20 Sold (MLS) $60,000 MAAR
- 2026-05-16 Pending — MAAR
- 2026-05-04 Listed — MAAR
- 2026-05-04 Listed $100,000 MAAR
Property tax history
+6.8%/yrLatest (2025): $1,078 · +7.2% YoY. Source: county tax records.
Cash-flow waterfall
monthlySold comps — $/sqft
last 12 mo · ≤1 miLoading sold comps…