 Fourplex
242 Kendall Ave · Crockett, CA
Flood risk 1/10 · Minimal
- FEMA flood zone
- X (unshaded)
- Chance of flooding over 30 yrs
- 0.0%
- Est. flood insurance / yr
- $507 – $1,088
Fire risk 5/10 · Moderate
- Est. fire insurance / yr
- $659 – $1,223
Heat risk 4/10 · Minor
- Hot days now (above 93°F)
- 7 days/yr
- Hot days in 30 yrs
- 15 days/yr
Wind risk 1/10 · Minimal
- Chance of severe wind over 30 yrs
- —
Air-quality risk 9/10 · Severe
- Unhealthy air days now
- 16 days/yr
- Unhealthy air days in 30 yrs
- 17 days/yr
Risk factors via First Street. Map © Google.
Why this score? — see what drove the C grade
The composite is a weighted blend of 9 inputs, each scored 0–100. Each bar is that input's sub-score; the figure is the points it added to the 100-point composite (weight × sub-score).
- Cash flow +25.5/30.0
- DSCR +8.5/10.0
- ARV discount +7.5/15.0
- 1% rule +6.7/10.0
- Livability +3.4/5.0
- Schools +3.3/10.0
- Rent growth +2.5/5.0
- Condition / age +1.0/5.0
- Appreciation +0.0/10.0
$785,000
🖨 Deal sheet (PDF) 📄 Offer letter ✓ Due diligence
Multi-family units
County records classify this as Multi-Family (5+ Unit). Listing-text estimate: 4 units. estimate disagrees with records
5+ unit building — per-unit beds/baths from public records are typically unavailable; the breakdown below (if shown) is an estimate from the listing text.
Listing remarks MLS
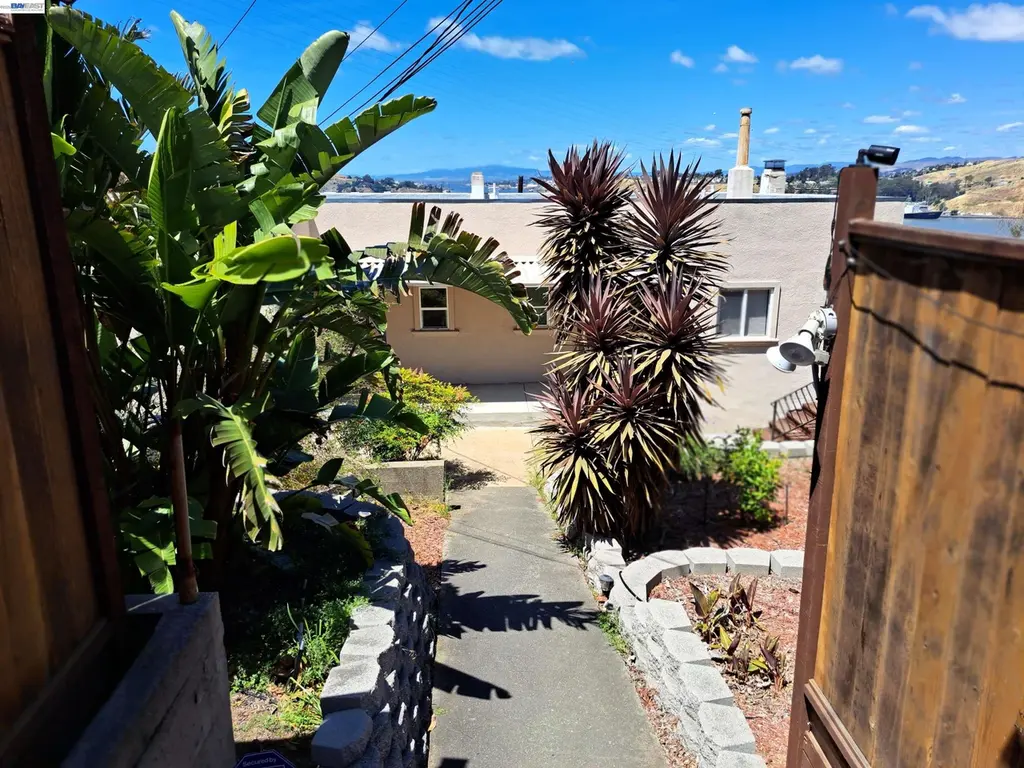
UNIQUE & RARE INVESTMENT OPPORTUNITY. ALL UNITS HAVE UNOBSTRUCTED WATER & BRIDGE VIEWS. FULLY OCCUPIED WITH LONG TIME TENANTS. HOME WARRANTY OFFERED TO BUYERS.
Key facts
- 7,535 sq ft lot
- Built 1948
- Listed 7 days
Property features AI
Exterior
- Parking: Parking lot
- Utilities: Public water; Public sewer; Separate meters for electric, gas, and water
- Home design: Residential income property (quadruplex); Built in 1948
- Construction: Stucco construction; Total building area about 2,415
- Exterior features: Front yard; Landscaped front and back; Low maintenance landscaping
Interior
- Kitchen: Some units include a dishwasher
- Bedrooms: Four separate units (bedroom counts per unit not provided)
- Flooring: Hardwood; Tile; Carpet
- Bathrooms: Each unit has 1 bathroom (4 total)
- Heating & cooling: Forced air heating (natural gas); No air conditioning
- Interior features: Window coverings; Front and back landscaping; Low maintenance yard
- Laundry & utility: Separate meters for electric, gas, and water
Neighborhood map
What this means for you Summary
Snapshot
- This is a 4 × 4-bed/4.0-bath units multifamily listed at $785k. Condition is rated poor.
Deal economics
- At list price, monthly cash flow is $2k ($22k/yr) — positive. Per door: $460/mo.
- The deal already cash-flows at list — no discount required.
- Meets the 1% rule at list price ($9k rent vs $785k).
Location & tenants
- Location reads 68/100 on livability (#291 in CA) — a middle-class / working-renter tenant base. Strengths: crime A+, commute A+, employment A+; Watch: amenities F, cost of living F, health & safety F.
- John Swett Unified (suburban): math 26% / reading 38% proficiency, ranked #899 of 1,400 in CA (top 64%) — families likely to look elsewhere, expect single-tenant / working-renter base with shorter leases.
- Market conditions: 17 active listings in the ZIP; 2,169 units permitted in Contra Costa County in 2024 (896 in 5+ unit buildings).
Forward outlook
- Local home prices are declining (-3.0%/yr); year-one equity from $5k of loan paydown is wiped out by about $24k of value loss. Plan a longer hold.
- Contra Costa County population projected at +26% by 2050 — long-run rental-demand tailwind backs the buy-and-hold thesis.
Negotiation context
- Only 7 days on market — expect competitive offers; lowballing is unlikely to land.
- 2 sale attempts since 28y ago; this cycle's ask is 26% above the opening price — seller raised mid-cycle; expect resistance to lowballs.
- Current owner paid $610k; 29% above their basis — modest negotiation headroom, anchor on the comps not their cost.
Risks & watch-outs
- Watch-outs: built in 1948 — expect roof / HVAC / electrical / plumbing capex.
- Climate carrying-cost: moderate wildfire risk — expect insurance premiums to compound above CPI over the hold.
Questions for the listing agent
- Can we see the unit-by-unit rent roll, current vacancy, and any below-market leases? What's the average tenancy length?
- What capital expenditures (roof, boiler, parking lot, exteriors) have been made in the last 5 years, and what's planned in the next 2?
- Have any recent inspections been done? Can we get a copy of the seller's disclosures and any deferred-maintenance estimates?
- Built in 1948 — when were the roof, HVAC, electrical panel, plumbing, and water heater last replaced?
- Is there a deadline driving the sale (1031 exchange, divorce, estate, relocation)? That informs how much negotiation room exists.
- Schools are B-rated — typically a magnet for longer-tenancy family renters. What's the average tenant stay here, and is there a school-zone premium baked into asking?
- What's the average days-on-market for RENTAL listings here right now (not sales)? A rising rental-DOM trend means longer vacancies and softer asking-rent achievability than the comps imply.
- What's the recent tenant-quality profile in this submarket — average credit score on applications, eviction rate, late-payment / NSF rate, and stable-employment percentage? A property-management company in the area should have these aggregated.
- How much new apartment / multifamily construction is in the pipeline within 1–3 miles? Heavy new supply (>2% of stock underway) typically softens rents 12–24 months out; light construction supports rent growth.
Investment metrics
- 1% rule
- 1.17% ✓
- Cap rate
- 9.10%
- Cash-on-cash
- 10.04%
- DSCR
- 1.45
- GRM
- 7.1
CMA / ARV
No comps found within radius.
Projected returns pro-forma
-3.0% appreciation · 3.0% rent growth · sell at horizon
- IRR
- -1.2%
- Equity multiple
- 0.95×
- Total profit
- $-9,932
- Equity at exit
- $117,046
- IRR
- 8.5%
- Equity multiple
- 1.65×
- Total profit
- $142,742
- Equity at exit
- $67,872
Cash invested: $219,800 (down + closing). Projections, not guarantees.
Landlord ↔ Tenant lean methodology
- Overall (STATE)
- 18 Strongly Tenant-Friendly
- State California
- 18 Strongly Tenant-Friendly · D+13
- County
- — inherits STATE
- City
- — inherits STATE
ZIP-level market 94525
- Active inventory
- 17
- Price-to-rent
- 28.5×
Monthly cashflow live
- Estimated rent
- $9,195 medium interval (Pro) →
- Mortgage (P&I)
- −$4,117
- Tax est. 1.5%
- −$981 /mo · $11,775/yr
- Insurance
- −$327
- HOA
- −$0
- Vacancy / Maint / Mgmt
- −$1,931
- Net cashflow
- $1,839
Break-even live
Sensitivity live
| Price | -10% $2,382 | -5% $2,110 | +0% $1,839 | +5% $1,568 | +10% $1,297 |
|---|---|---|---|---|---|
| Rent | -10% $1,113 | -5% $1,476 | +0% $1,839 | +5% $2,202 | +10% $2,565 |
| Rate | -1.0pp $2,234 | -0.5pp $2,039 | base $1,839 | +0.5pp $1,636 | +1.0pp $1,429 |
4-unit breakdown (identical units grouped — click to expand)
| Units | Beds | Baths | Est. rent |
|---|---|---|---|
| 4× units | 4 | 4 | $9,196 |
| #1 | 4 | 4 | $2,299 |
| #2 | 4 | 4 | $2,299 |
| #3 | 4 | 4 | $2,299 |
| #4 | 4 | 4 | $2,299 |
| Total (4 units) | $9,195 | ||
UW: 25.0% down · 7.5% · 30yr · 1.5% tax · 5.0% vac · 8.0% maint · 8.0% mgmt
Financing live
Cash to close
- Down payment
- $196,250
- Closing costs
- $23,550
- Reserves months
- —
- Total cash needed
- —
Loan-product check · same deal, 3 products live
Conventional
25% down · 7.5% · 30yr
- Down + closing
- —
- Monthly P&I
- —
- Monthly cashflow
- —
- DSCR
- —
- Eligible?
- —
Personal DTI + credit; lowest rate.
DSCR
20% down · 8.5% · 30yr
- Down + closing
- —
- Monthly P&I
- —
- Monthly cashflow
- —
- DSCR
- —
- Eligible?
- —
No personal income docs; deal must DSCR.
Hard money
10% down · 12.0% · 12mo
- Down + closing
- —
- Monthly P&I
- —
- Monthly cashflow
- —
- DSCR
- —
- Eligible?
- —
Short-term bridge; refi at stabilization.
Listing history 7 events
-
2026-06-15status $785,000 Pending 7 DOM
-
2026-06-15days on market $785,000 Active 7 DOM
-
2026-06-13days on market $785,000 Active 5 DOM
-
2026-06-13days on market $785,000 Active 4 DOM
-
2026-06-08statusdays on market $785,000 Active 1 DOM
-
2026-06-07remarks 695-char remark
-
2026-06-07$785,000 Coming Soon 3 DOM
ⓘ Source: listings_history table (triggers on properties + properties_extension) + one-shot
backfill from property_details.listing_events for pre-trigger history.
Climate risk First Street
- Flood 1/10 Low FEMA zone X (unshaded) · 0% chance over 30 yrs
- Wildfire 5/10 Major
- Heat 4/10 Moderate 7 d/yr ≥93°F today · 15 d/yr by 30 yrs out
- Wind 1/10 Low
- Air quality 9/10 Extreme 16 unhealthy d/yr today · 17 by 30 yrs out
Nearby sold comps map
Loading sold comps map…
Walkable amenities ~0.75 mi
Loading nearby amenities…
Taxation est. · year 1
- Rental income
- $110,340
- − Mortgage interest
- −$43,972
- − Property taxes
- −$11,775
- − Insurance
- −$3,925
- − Repairs & maintenance
- −$8,827
- − Management
- −$8,827
- − Depreciation
- −$22,836
- Taxable income
- $10,177
- Est. tax owed @ 24.0%
- −$2,442
- After-tax cash flow
- $19,627/yr
For passive investors: Depreciation is non-cash, so a rental often shows a tax loss while cash-flowing — sheltering income. Rental losses are passive: they offset passive income freely, and up to $25,000/yr can offset ordinary (W-2) income if you actively participate and your MAGI is under $100k (phasing out to $0 by $150k); unused losses carry forward. On sale, claimed depreciation is recaptured at up to 25%, and gains may owe capital-gains tax (a 1031 exchange can defer both). Figures are a year-1 estimate at your 24.0% rate — not tax advice; consult a CPA.
Condition & rehab AI · 1 photo
This multi-family property requires extensive repairs and updates to its exterior, interior, and HVAC systems, significantly impacting its current condition and value. Significant investments are needed to bring it up to a livable and marketable standard.
Repairs flagged
- Major exterior siding — Significant wear and tear
- Major roof — Significant wear and tear
- Major interior walls/paint — Significant wear and tear
- Major HVAC/mechanicals — Significant wear and tear
Value-add opportunities
- Both exterior siding and paint — Enhances curb appeal and value
- Both new roof — Improves structural integrity and value
- Both new interior walls and paint — Enhances interior aesthetics and value
- Both new HVAC system — Improves comfort and energy efficiency
Renovation cost estimate screening
| Repair item | Severity | Est. cost |
|---|---|---|
| exterior siding · Significant wear and tear | Major | $15,000–50,000 |
| roof · Significant wear and tear | Major | $15,000–50,000 |
| interior walls/paint · Significant wear and tear | Major | $15,000–50,000 |
| HVAC/mechanicals · Significant wear and tear | Major | $15,000–50,000 |
| Total estimated repair cost · 4 items | $60,000–200,000 |
Value-add ROI direction
- Both exterior siding and paint — Enhances curb appeal and value ↑
- Both new roof — Improves structural integrity and value ↑
- Both new interior walls and paint — Enhances interior aesthetics and value ↑
- Both new HVAC system — Improves comfort and energy efficiency ↑
ⓘ Cost ranges are severity-bucket heuristics (US national rule-of-thumb). Get contractor quotes + a written scope before underwriting a rehab budget.
Schools (NCES district)
- District
- John Swett Unified
- NCES district ID
- 0618990
- Math proficiency
- 26% ▬ 0.00%
- Reading proficiency
- 38% ▲ 1.00%
- Median HH income
- $70,527
- Composite
- 32.55/100
- National rank
- #10824
- State rank
- #899 of 1400 in CA
Livability — Crockett
- Score
- 68/100
- State rank
- #291
- US rank
- #9786
Category grades
Schools grade is shown separately in the Schools card above.
Census & demographics
- Census place
- Crockett, CA
- City population
- 3,665
- Population (ZIP)
- 3,665
Population outlook (Contra Costa County) Hauer SSP2
- Today (2025)
- 1,287,720 people
- By 2030
- 1,364,937 · +6.0%
- By 2040
- 1,506,209 · +17.0%
- By 2050
- 1,624,373 · +26.1%
- By 2075
- 1,853,193 · +43.9%
- By 2100
- 1,901,231 · +47.6%
Race, ethnicity, and origin ACS 2023
- Neighborhood character
- Majority White (63%)
- Race & ethnicity
- White 63% Hispanic / Latino 18% Black 10% Two or more races 9% Asian 8%
- Hispanic origin (detail)
- Mexican 16%
- Common ancestry
- Portuguese 4% Lithuanian 3% Iranian 3%
- Foreign-born
- 12% · Canada, South Korea, Philippines
- Languages at home
- 90% English-only · Tagalog/Filipino 4% Spanish 4% Korean 1%
Political lean MEDSL · Contra Costa
- 2024 margin
- Solid D (+38.0) · D 67.3% · R 29.4% · Other 3.3%
- 2008→2024 swing
- +0.2pp no change · 2008: 37.8pp · 2024: 38.0pp
- All cycles
- 2024: D+38.0 2020: D+45.3 2016: D+43.5 2012: D+33.7 2008: D+37.8
Not yet ingested
- Civics
- —
Market trends
- HPI YoY
- ▼ -208.49%
- Current HPI
- 130.197
- Rent YoY
- —
- Metro
- —
- State GDP YoY
- ▲ 3.21%
- F500 in state
- 116
Industry mix (Fortune 500 HQ in CA)
| Industry | F500 HQs | Revenue |
|---|---|---|
| Technology | 27 | $1,492B |
|
||
| Financial Services | 3 | $174B |
|
||
| Retail | 3 | $44B |
|
||
| Insurance | 3 | $26B |
|
||
| Media / Entertainment | 2 | $115B |
|
||
| Pharmaceuticals / Biotech | 2 | $62B |
|
||
Price history
+390.8% since first listed9 events — show timeline
- 2026-06-04 Coming Soon $785,000 bridgeMLS, Bay East AOR, or Contra Costa AOR
- 2026-06-04 Price Changed $785,000 Coming Soon
- 2004-06-17 Sold (MLS) $610,000 bridgeMLS, Bay East AOR, or Contra Costa AOR
- 2004-02-17 Listing Removed — bridgeMLS, Bay East AOR, or Contra Costa AOR
- 2004-01-27 Listed $624,950 bridgeMLS, Bay East AOR, or Contra Costa AOR
- 2004-01-26 Listing Removed — bridgeMLS, Bay East AOR, or Contra Costa AOR
- 1998-07-17 Sold (MLS) $150,000 bridgeMLS, Bay East AOR, or Contra Costa AOR
- 1998-06-15 Listing Removed — bridgeMLS, Bay East AOR, or Contra Costa AOR
- 1998-04-22 Listed $159,950 bridgeMLS, Bay East AOR, or Contra Costa AOR
Cash-flow waterfall
monthlySold comps — $/sqft
last 12 mo · ≤1 miLoading sold comps…