 🔨 Auction
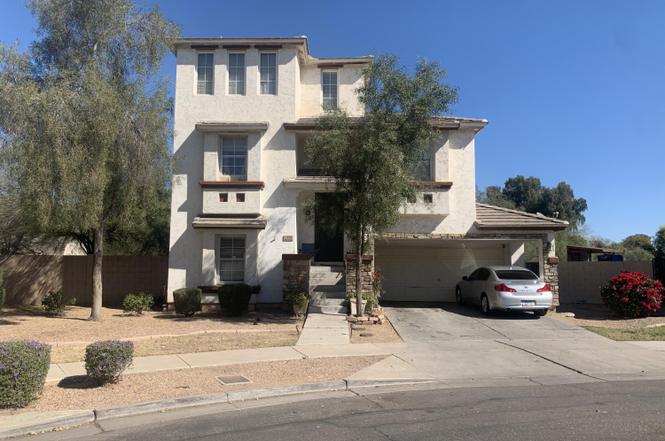
123 N 65th Dr · Phoenix, AZ
Flood risk 1/10 · Minimal
- FEMA flood zone
- X (shaded)
- Chance of flooding over 30 yrs
- 0.0%
- Est. flood insurance / yr
- $507 – $1,088
Fire risk 1/10 · Minimal
- Est. fire insurance / yr
- $610 – $1,132
Heat risk 9/10 · Severe
- Hot days now (above 112°F)
- 7 days/yr
- Hot days in 30 yrs
- 19 days/yr
Wind risk 1/10 · Minimal
- Chance of severe wind over 30 yrs
- —
Air-quality risk 1/10 · Minimal
- Unhealthy air days now
- 0 days/yr
- Unhealthy air days in 30 yrs
- 0 days/yr
Risk factors via First Street. Map © Google.
Why this score? — see what drove the F grade
The composite is a weighted blend of 9 inputs, each scored 0–100. Each bar is that input's sub-score; the figure is the points it added to the 100-point composite (weight × sub-score).
- ARV discount +7.5/15.0
- Livability +3.8/5.0
- Cash flow +2.8/30.0
- Condition / age +2.5/5.0
- Rent growth +2.0/5.0
- Schools +1.6/10.0
- 1% rule +0.0/10.0
- DSCR +0.0/10.0
- Appreciation +0.0/10.0
$1
🖨 Deal sheet 📄 Offer letter ✓ Due diligence
Listing remarks
The list price is not indicative of seller's final reserve amount. This property is part of an online bidding event. Inspections of this property and contact with occupants are strictly prohibited. Property is sold ''as is'' and no for sale sign allowed.
Key facts
- 9,407 sq ft lot
- 2 garage spots
- Built 2005
Property features AI
Finance
- HOA & community: Homeowners association with $125 monthly fee; HOA covers grounds maintenance and front yard maintenance
Exterior
- Parking: 2 covered parking spaces; 2 open parking spaces; 2-car garage
- Utilities: City water; Public sewer; 220 volts in kitchen (electric)
- Home design: Single family residence; Fee simple ownership
- Construction: Construction: Stucco and wood frame; Tile roof; Lot about 9,407 sq ft (per assessor)
- Exterior features: Stucco and painted wood-frame exterior; Block fencing; Tile roof
Interior
- Kitchen: Built-in microwave; 220-volt outlet in kitchen
- Bedrooms: Up to 4 possible bedrooms
- Bathrooms: 2 full bathrooms
- Heating & cooling: Electric heating; Central air conditioning
- Interior features: Eat-in kitchen; Full bathroom in primary bedroom
- Laundry & utility: Laundry area (other)
Neighborhood map
What this means for you Summary
Snapshot
- This is a 4-bed/2.0-bath single-family listed at $1.
Deal economics
- At list price, monthly cash flow is $-2k ($-19k/yr) — negative.
- The deal already cash-flows at list — no discount required.
- Meets the 1% rule at list price ($2k rent vs $1).
- Cap rate 2.3% vs local median 3.3% in Phoenix — below-typical yield; the buyer is paying a premium for something (appreciation thesis, condition, location) that the cap rate doesn't capture.
Location & tenants
- Location reads 75/100 on livability (#16 in AZ, #3,924 nationally) — a middle-class / working-renter tenant base. Strengths: amenities A+, commute A+, housing A+; Watch: health & safety C-, crime F.
- Tolleson Union High School District (4288) (suburban): math 14% / reading 22% proficiency, ranked #188 of 249 in AZ (top 76%) — low school quality limits family demand, transient renter base, plan for 1-2y turnover.
- Zoned schools: La Joya Community High School (math 13% / reading 20%, grade F, #257 of 381 statewide, top 67%, 2,078 students, 53% FRL).
- Market conditions: Rents soft (-1.8%/yr); 120 active listings in the ZIP; 10 comparable units currently listed for rent nearby; rentals leasing fast (median 10d on market — plan ~1-2 weeks tenant-placement turnaround); solid renter incomes; 36,011 units permitted in Maricopa County in 2024 (12,801 in 5+ unit buildings).
- This rent runs 35% of the median local income ($78k/yr) — at the standard rent-burdened threshold; future hikes will face affordability resistance.
Forward outlook
- Local home prices are declining (-3.0%/yr); year-one equity from $3k of loan paydown is wiped out by about $14k of value loss. Plan a longer hold.
- Maricopa County population projected at +38% by 2050 — long-run rental-demand tailwind backs the buy-and-hold thesis.
Negotiation context
- Only 3 days on market — expect competitive offers; lowballing is unlikely to land.
- 18 sale attempts since 20y ago with the ask held roughly flat each time — persistent listings suggest the price (not the market) is what's stuck; bring a comps-based counter.
Risks & watch-outs
- Watch-outs: property tax is 707487.0% of price.
- Climate carrying-cost: extreme-heat days projected 7→19/yr by 2055 (HVAC capex compounding) — expect insurance premiums to compound above CPI over the hold.
Questions for the listing agent
- What do current leases actually rent for vs. the listed asking? Can we see a recent rent roll and the last 12 months of T-12 income?
- Property tax is high relative to price — has the assessment been appealed recently, and will the sale trigger a re-assessment?
- What does the HOA fee cover, when was the last increase, and are there any pending special assessments or reserve-fund shortfalls?
- Is there a deadline driving the sale (1031 exchange, divorce, estate, relocation)? That informs how much negotiation room exists.
- Crime grade is F in this area — have there been break-ins, vandalism, or insurance claims at this property in the last 3 years? What carrier currently insures it and at what premium?
- The area grade is low — what's the realistic commute time and amenity access for the typical tenant pool here? Any planned neighborhood developments (good or bad) we should know about?
- What's the average days-on-market for RENTAL listings here right now (not sales)? A rising rental-DOM trend means longer vacancies and softer asking-rent achievability than the comps imply.
- What's the recent tenant-quality profile in this submarket — average credit score on applications, eviction rate, late-payment / NSF rate, and stable-employment percentage? A property-management company in the area should have these aggregated.
- How much new for-sale + rental construction is in the pipeline within 1–3 miles? Heavy new supply typically softens prices + rents 12–24 months out; constrained supply supports both.
Investment metrics
- 1% rule
- 0.49% ✗
- Cap rate
- 2.30%
- Cash-on-cash
- -14.26%
- DSCR
- 0.37
- GRM
- 17.1
CMA / ARV
- ARV (on-the-fly)
- $471,658
- Comps found
- 1
Show comp detail 1 sale within ~0.75 mi
| Address | Dist | Beds/Ba | Sqft | Sold | Price | $/sf | Match |
|---|---|---|---|---|---|---|---|
| 6319 W Mckinley St | 0.55mi | 4/2.0 | 1,706 (-12%) | 18mo | $412,000 | $242 | 38 |
Match score weights: distance 35% · size 25% · config 20% · recency 20%. Top-matched comps best support the ARV.
Projected returns pro-forma
-3.0% appreciation · 0.0% rent growth · sell at horizon
- IRR
- -46.7%
- Equity multiple
- -0.39×
- Total profit
- $-182,999
- Equity at exit
- $70,326
- IRR
- —
- Equity multiple
- -1.37×
- Total profit
- $-313,623
- Equity at exit
- $40,780
Cash invested: $132,064 (down + closing). Projections, not guarantees.
Landlord ↔ Tenant lean methodology
- Overall (STATE)
- 87 Strongly Landlord-Friendly
- State Arizona
- 87 Strongly Landlord-Friendly · R+3
- County
- — inherits STATE
- City
- — inherits STATE
ZIP-level market 85043
- Home prices YoY
- -28.6%
- Rents YoY
- -1.8%
- Active inventory
- 120
Monthly cashflow live
- Estimated rent
- $2,298 high interval (Pro) →
- Mortgage (P&I)
- −$2,473
- Tax est. 1.5%
- −$590 /mo · $7,075/yr
- Insurance
- −$197
- HOA
- −$125
- Vacancy / Maint / Mgmt
- −$483
- Net cashflow
- $-1,569
Break-even live
UW: 25.0% down · 7.5% · 30yr · 1.5% tax · 5.0% vac · 8.0% maint · 8.0% mgmt
Financing live
Cash to close
- Down payment
- $117,914
- Closing costs
- $14,150
- Reserves months
- —
- Total cash needed
- —
Loan-product check · same deal, 3 products live
Conventional
25% down · 7.5% · 30yr
- Down + closing
- —
- Monthly P&I
- —
- Monthly cashflow
- —
- DSCR
- —
- Eligible?
- —
Personal DTI + credit; lowest rate.
DSCR
20% down · 8.5% · 30yr
- Down + closing
- —
- Monthly P&I
- —
- Monthly cashflow
- —
- DSCR
- —
- Eligible?
- —
No personal income docs; deal must DSCR.
Hard money
10% down · 12.0% · 12mo
- Down + closing
- —
- Monthly P&I
- —
- Monthly cashflow
- —
- DSCR
- —
- Eligible?
- —
Short-term bridge; refi at stabilization.
Rent comps 10 comps
| Address | Beds | Baths | Sqft | Rent | $/sqft | DOM | Units | Dist |
|---|---|---|---|---|---|---|---|---|
| 6628 W Monroe St Phoenix, AZ | 3.0 | 2.0 | 1656 | $2,100 | $1.27 | 1d | 1 | 0.15mi |
| 7044 W Taylor St Phoenix, AZ | 4.0 | 2.0 | 1588 | $1,869 | $1.18 | 10d | 1 | 0.76mi |
| 1602 S 65th Gln Phoenix, AZ | 3.0 | 2.0 | 1587 | $1,829 | $1.15 | 21d | 1 | 1.09mi |
| 6161 W McDowell Rd Phoenix, AZ | 1.0–3.0 | 1.0–2.0 | 987 | $1,955 | $1.98 | 1d | 38 | 1.22mi |
| 1801 N 63rd Dr Phoenix, AZ | 3.0 | 2.0 | 1770 | $1,845 | $1.04 | 14d | 1 | 1.31mi |
| 7205 W McDowell Rd Phoenix, AZ | 2.0–3.0 | 2.0 | 1291 | $1,940 | $1.50 | 1d | 6 | 1.35mi |
| 5821 W McDowell Rd Phoenix, AZ | 1.0–3.0 | 1.0–2.0 | 998 | $2,324 | $2.33 | 1d | 11 | 1.38mi |
| 6334 W Hilton Ave Phoenix, AZ | 3.0 | 2.0 | 2068 | $1,255 | $0.61 | 16d | 1 | 1.45mi |
| 6351 W Hilton Ave Phoenix, AZ | 3.0 | 2.0 | 1535 | $1,795 | $1.17 | 16d | 1 | 1.47mi |
| 6347 W Hilton Ave Phoenix, AZ | 3.0 | 2.0 | 1535 | $1,915 | $1.25 | 1d | 1 | 1.47mi |
HOA detail
- Monthly dues
- $125 · $1,500/yr
Listing history 4 events
-
2026-06-18days on market $1 Active 3 DOM
-
2026-06-17days on market $1 Active 2 DOM
-
2026-06-16remarks 254-char remark
-
2026-06-16$1 Active 1 DOM
ⓘ Source: listings_history table (triggers on properties + properties_extension) + one-shot
backfill from property_details.listing_events for pre-trigger history.
Climate risk First Street
- Flood 1/10 Low FEMA zone X (shaded) · 0% chance over 30 yrs
- Wildfire 1/10 Low
- Heat 9/10 Extreme 7 d/yr ≥112°F today · 19 d/yr by 30 yrs out
- Wind 1/10 Low
- Air quality 1/10 Low 0 unhealthy d/yr today · 0 by 30 yrs out
Nearby sold comps map
Loading sold comps map…
Walkable amenities ~0.75 mi
Loading nearby amenities…
Taxation est. · year 1
- Rental income
- $27,573
- − Mortgage interest
- −$26,420
- − Property taxes
- −$7,075
- − Insurance
- −$2,358
- − Repairs & maintenance
- −$2,206
- − Management
- −$2,206
- − HOA
- −$1,500
- − Depreciation
- −$13,721
- Taxable loss
- −$27,913
- Est. tax savings @ 24.0%
- +$6,699
- After-tax cash flow
- $-12,132/yr
For passive investors: Depreciation is non-cash, so a rental often shows a tax loss while cash-flowing — sheltering income. Rental losses are passive: they offset passive income freely, and up to $25,000/yr can offset ordinary (W-2) income if you actively participate and your MAGI is under $100k (phasing out to $0 by $150k); unused losses carry forward. On sale, claimed depreciation is recaptured at up to 25%, and gains may owe capital-gains tax (a 1031 exchange can defer both). Figures are a year-1 estimate at your 24.0% rate — not tax advice; consult a CPA.
Schools (NCES district)
- District
- Tolleson Union High School District (4288)
- NCES district ID
- 0408520
- Math proficiency
- 14% ▼ -21.00%
- Reading proficiency
- 22% ▼ -14.00%
- Median HH income
- $51,925
- Composite
- 16.41/100
- National rank
- #9193
- State rank
- #188 of 249 in AZ
Livability — Phoenix
- Score
- 75/100
- State rank
- #16
- US rank
- #3924
Category grades
Schools grade is shown separately in the Schools card above.
Census & demographics
- Census place
- Phoenix, AZ
- County
- Maricopa County · 4,537,380 people
- City population
- 1,500,198
- Metro
- Phoenix-Mesa-Chandler, AZ
- Population (ZIP)
- 41,331
- Household income
- $78,257
- Rent vs Own
- Severe rent burden
- 1019.0
Population outlook (Maricopa County) Hauer SSP2
- Today (2025)
- 4,979,203 people
- By 2030
- 5,378,229 · +8.0%
- By 2040
- 6,156,598 · +23.6%
- By 2050
- 6,872,376 · +38.0%
- By 2075
- 8,401,270 · +68.7%
- By 2100
- 9,247,439 · +85.7%
Race, ethnicity, and origin ACS 2023
- Neighborhood character
- Predominantly Hispanic (75%)
- Race & ethnicity
- Hispanic / Latino 75% Two or more races 33% White 11% Black 11% Native American 3%
- Hispanic origin (detail)
- Mexican 72%
- Common ancestry
- Lithuanian 1% Iranian 1%
- Foreign-born
- 27% · Canada
- Languages at home
- 41% English-only · Spanish 57%
Political lean MEDSL · Maricopa
- 2024 margin
- Toss-up / Even · D 47.7% · R 51.2% · Other 1.1%
- 2008→2024 swing
- +7.1pp toward D · 2008: -10.6pp · 2024: -3.5pp
- All cycles
- 2024: R+3.5 2020: D+2.2 2016: R+3.5 2012: R+12.0 2008: R+10.6
Not yet ingested
- Civics
- —
Market trends
- HPI YoY
- ▼ -124.22%
- Current HPI
- 309.495
- Rent YoY
- ▼ -1.83%
- Metro
- Phoenix-Mesa-Chandler, AZ
- State GDP YoY
- ▲ 4.54%
- F500 in state
- 20
Industry mix (Fortune 500 HQ in AZ)
| Industry | F500 HQs | Revenue |
|---|---|---|
| Technology | 2 | $13B |
|
||
| Mining / Metals | 1 | $23B |
|
||
| Environmental Services | 1 | $16B |
|
||
| Metals / Steel | 1 | $14B |
|
||
| Technology Distribution | 1 | $9B |
|
||
| Homebuilding | 1 | $8B |
|
||
Price history
+48.1% since first listed52 events — show timeline
- 2026-06-09 Listed $1 ARMLS
- 2026-04-05 Listing Removed — ARMLS
- 2026-02-14 Listed $1 ARMLS
- 2022-11-30 Sold (Public Records) $400,000 Public Records
- 2022-11-30 Sold (MLS) $400,000 ARMLS
- 2022-10-25 Listing Removed — ARMLS
- 2022-10-25 Listed $425,000 ARMLS
- 2022-08-16 Listing Removed — ARMLS
- 2022-08-16 Listing Removed — ARMLS
- 2022-08-16 Listed $425,000 ARMLS
- 2022-05-29 Listing Removed — ARMLS
- 2022-05-24 Price Changed $374,900 ARMLS
- 2022-05-24 Relisted — ARMLS
- 2022-05-18 Pending — ARMLS
- 2022-05-18 Relisted — ARMLS
- 2022-05-16 Listing Removed — ARMLS
- 2022-05-10 Relisted — ARMLS
- 2022-04-30 Pending — ARMLS
- 2022-04-27 Price Changed $389,000 ARMLS
- 2022-04-27 Relisted — ARMLS
- 2022-04-11 Listing Removed — ARMLS
- 2022-04-07 Price Changed $420,000 ARMLS
- 2022-03-30 Listed $389,000 ARMLS
- 2019-11-13 Listing Removed — ARMLS
- 2019-10-30 Listed $233,000 ARMLS
- 2017-04-13 Listing Removed — ARMLS
- 2017-03-09 Price Changed $198,900 ARMLS
- 2017-02-28 Price Changed $195,900 ARMLS
- 2017-02-12 Listed $205,900 ARMLS
- 2015-08-28 Sold (Public Records) $153,000 Public Records
- 2015-08-28 Sold (MLS) $153,000 ARMLS
- 2015-08-06 Pending — ARMLS
- 2015-08-04 Listed $149,695 ARMLS
- 2011-05-31 Sold (MLS) $88,000 ARMLS
- 2011-04-26 Pending — ARMLS
- 2011-04-12 Listed $84,900 ARMLS
- 2010-07-23 Sold (MLS) $74,000 ARMLS
- 2010-06-29 Contingent — ARMLS
- 2010-06-25 Price Changed $74,900 ARMLS
- 2010-06-25 Listed $81,900 ARMLS
- 2010-06-19 Listing Removed — ARMLS
- 2010-05-17 Price Changed $84,900 ARMLS
- 2010-04-30 Price Changed $89,900 ARMLS
- 2010-04-06 Listed $99,900 ARMLS
- 2010-04-06 Listing Removed — ARMLS
- 2010-03-25 Relisted — ARMLS
- 2010-02-10 Listing Removed — ARMLS
- 2009-11-13 Listed $99,900 ARMLS
- 2006-06-29 Sold (Public Records) $270,000 Public Records
- 2006-06-15 Sold (MLS) $270,000 ARMLS
- 2006-05-30 Listing Removed — ARMLS
- 2006-05-25 Listed $270,000 ARMLS
Property tax history
-0.8%/yrLatest (2025): $1,326 · +14.6% YoY. Source: county tax records.
Cash-flow waterfall
monthlySold comps — $/sqft
last 12 mo · ≤1 miLoading sold comps…