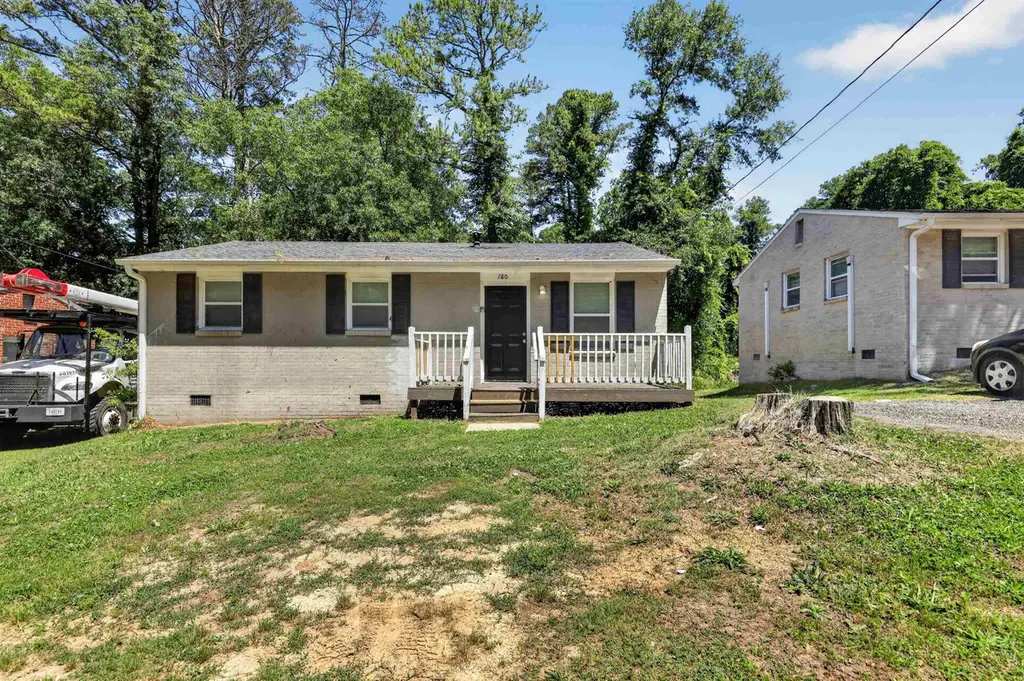
780 Wofford St · Spartanburg, SC
Flood risk 1/10 · Minimal
- FEMA flood zone
- X (unshaded)
- Chance of flooding over 30 yrs
- 0.0%
- Est. flood insurance / yr
- $507 – $1,088
Fire risk 1/10 · Minimal
- Est. fire insurance / yr
- $783 – $1,453
Heat risk 5/10 · Moderate
- Hot days now (above 105°F)
- 7 days/yr
- Hot days in 30 yrs
- 15 days/yr
Wind risk 2/10 · Minimal
- Chance of severe wind over 30 yrs
- 2.0%
Air-quality risk 4/10 · Minor
- Unhealthy air days now
- 4 days/yr
- Unhealthy air days in 30 yrs
- 5 days/yr
Risk factors via First Street. Map © Google.
Why this score? — see what drove the B grade
The composite is a weighted blend of 9 inputs, each scored 0–100. Each bar is that input's sub-score; the figure is the points it added to the 100-point composite (weight × sub-score).
- Cash flow +29.2/30.0
- ARV discount +14.0/15.0
- DSCR +10.0/10.0
- 1% rule +8.0/10.0
- Livability +3.8/5.0
- Schools +3.1/10.0
- Condition / age +2.5/5.0
- Rent growth +1.8/5.0
- Appreciation +0.0/10.0
$99,900
🖨 Deal sheet 📄 Offer letter ✓ Due diligence
Listing remarks
All-brick ranch home located just 1 mile from downtown Spartanburg. The interior features refinished original hardwood floors throughout the main living areas, hallway, and all three bedrooms. The spacious eat-in kitchen and full bathroom are outfitted with updated low-maintenance flooring, modern cabinetry, and neutral countertops. This single-level residence includes energy-efficient vinyl replacement windows and a central HVAC heat pump system. Situated on a level lot with a paved driveway for off-street parking. Located in the unincorporated Saxon area within Spartanburg County School District 6 boundaries, providing quick access to local parks, public transit, and city amenities.
Key facts
- Modern cabinetry
- Neutral countertops
- All brick ranch home
Tags
Property features AI
Exterior
- Parking: No dedicated parking
- Utilities: Public water; Public sewer
- Home design: Single-family residence; One story
- Construction: Brick veneer and vinyl siding exterior; Composition roof; Slab foundation; Built area above grade: 840
- Exterior features: Level lot
Interior
- Kitchen: Range; Refrigerator
- Bedrooms: 3 main-level bedrooms
- Flooring: Vinyl flooring; Wood flooring
- Bathrooms: 1 full bathroom (main level)
- Heating & cooling: Electric heating; Central electric air conditioning
- Interior features: Range; Refrigerator
Neighborhood map
What this means for you Summary
Snapshot
- This is a 3-bed/1.0-bath single-family listed at $100k.
Deal economics
- At list price, monthly cash flow is $349 ($4k/yr) — positive.
- The deal already cash-flows at list — no discount required.
- Meets the 1% rule at list price ($1k rent vs $100k).
- Recommended offer: $98k (1.5% below list) — sets the bar for market timing.
- Cap rate 10.5% vs local median 3.9% in Spartanburg — top-decile yield for the area; either an underpriced asset or a hidden risk that comps aren't pricing in. Stress-test before assuming the spread holds.
Location & tenants
- Location reads 76/100 on livability (#24 in SC, #3,679 nationally) — a middle-class / working-renter tenant base. Strengths: amenities A+, commute A+, cost of living A+; Watch: schools D+, crime F, employment F.
- Spartanburg 07 (urban): math 34% / reading 41% proficiency, ranked #39 of 80 in SC (top 49%) — families likely to look elsewhere, expect single-tenant / working-renter base with shorter leases; 62% free/reduced lunch — lower-income household profile, screen leases tightly.
- Market conditions: Rents soft (-2.6%/yr); 466 active listings in the ZIP; 18 comparable units currently listed for rent nearby; rentals at typical pace (median 21d on market — plan ~3-4 weeks tenant-placement turnaround); 3,129 units permitted in Spartanburg County in 2024 (40 in 5+ unit buildings).
Forward outlook
- Local home prices are declining (-3.0%/yr); year-one equity from $691 of loan paydown is wiped out by about $3k of value loss. Plan a longer hold.
- Spartanburg County population projected at +18% by 2050 — long-run rental-demand tailwind backs the buy-and-hold thesis.
Negotiation context
- It's been on market 27 days — a 2% lower offer ($98k) is reasonable based on typical stale-listing flexibility.
Risks & watch-outs
- Climate carrying-cost: extreme-heat days projected 7→15/yr by 2055 (HVAC capex compounding) — expect insurance premiums to compound above CPI over the hold.
Questions for the listing agent
- Built in 1966 — when were the roof, HVAC, electrical panel, plumbing, and water heater last replaced?
- Is there a deadline driving the sale (1031 exchange, divorce, estate, relocation)? That informs how much negotiation room exists.
- Schools are D-rated, which usually means shorter tenancies and higher turnover. Who's the typical renter profile here, and what's been the actual vacancy rate?
- Crime grade is F in this area — have there been break-ins, vandalism, or insurance claims at this property in the last 3 years? What carrier currently insures it and at what premium?
- What's the average days-on-market for RENTAL listings here right now (not sales)? A rising rental-DOM trend means longer vacancies and softer asking-rent achievability than the comps imply.
- What's the recent tenant-quality profile in this submarket — average credit score on applications, eviction rate, late-payment / NSF rate, and stable-employment percentage? A property-management company in the area should have these aggregated.
- How much new for-sale + rental construction is in the pipeline within 1–3 miles? Heavy new supply typically softens prices + rents 12–24 months out; constrained supply supports both.
Investment metrics
- 1% rule
- 1.30% ✓
- Cap rate
- 10.48%
- Cash-on-cash
- 14.95%
- DSCR
- 1.67
- GRM
- 6.4
CMA / ARV
- ARV (on-the-fly)
- $116,760
- Comps found
- 11
Show comp detail 11 sales within ~0.75 mi
| Address | Dist | Beds/Ba | Sqft | Sold | Price | $/sf | Match |
|---|---|---|---|---|---|---|---|
| 776 Wofford St | 0.01mi | 3/1.0 | 850 (+1%) | 7mo | $95,000 | $112 | 92 |
| 784 Wofford St | 0.01mi | 3/1.0 | 840 (0%) | 13mo | $98,500 | $117 | 89 |
| 760 Wofford St | 0.06mi | 3/1.0 | 840 (0%) | 12mo | $154,500 | $184 | 87 |
| 201 Herbert St | 0.18mi | 3/1.0 | 827 (-2%) | 22mo | $115,000 | $139 | 70 |
| 443 Eloise Dr | 0.35mi | 2/1.0 (-1) | 809 (-4%) | 14mo | $40,000 | $49 | 61 |
| 739 Baltimore St | 0.29mi | 2/1.0 (-1) | 720 (-14%) | 0mo | $99,000 | $138 | 58 |
| 567 Bee St | 0.41mi | 3/1.0 | 867 (+3%) | 24mo | $128,000 | $148 | 55 |
| 234 Southstar St | 0.50mi | 2/1.0 (-1) | 889 (+6%) | 10mo | $160,000 | $180 | 54 |
| 556 Wofford St | 0.48mi | 2/1.0 (-1) | 891 (+6%) | 19mo | $60,000 | $67 | 46 |
| 704 Fairfax St | 0.57mi | 3/1.0 | 900 (+7%) | 19mo | $160,000 | $178 | 46 |
| 726 Farley Ave | 0.39mi | 3/1.0 | 937 (+12%) | 23mo | $135,500 | $145 | 44 |
Match score weights: distance 35% · size 25% · config 20% · recency 20%. Top-matched comps best support the ARV.
Projected returns pro-forma
-3.0% appreciation · 0.0% rent growth · sell at horizon
- IRR
- 2.1%
- Equity multiple
- 1.08×
- Total profit
- $2,223
- Equity at exit
- $14,895
- IRR
- 8.6%
- Equity multiple
- 1.57×
- Total profit
- $15,877
- Equity at exit
- $8,638
Cash invested: $27,972 (down + closing). Projections, not guarantees.
Landlord ↔ Tenant lean methodology
- Overall (STATE)
- 90 Strongly Landlord-Friendly
- State South Carolina
- 90 Strongly Landlord-Friendly · R+6
- County
- — inherits STATE
- City
- — inherits STATE
ZIP-level market 29301
- Home prices YoY
- -25.3%
- Rents YoY
- -2.6%
- Active inventory
- 466
- Price-to-rent
- 6.4×
Monthly cashflow live
- Estimated rent
- $1,297 high interval (Pro) →
- Mortgage (P&I)
- −$524
- Tax from tax record
- −$111 /mo · $1,327/yr
- Insurance
- −$42
- HOA
- −$0
- Vacancy / Maint / Mgmt
- −$272
- Net cashflow
- $349
Break-even live
UW: 25.0% down · 7.5% · 30yr · 1.5% tax · 5.0% vac · 8.0% maint · 8.0% mgmt
Financing live
Cash to close
- Down payment
- $24,975
- Closing costs
- $2,997
- Reserves months
- —
- Total cash needed
- —
Loan-product check · same deal, 3 products live
Conventional
25% down · 7.5% · 30yr
- Down + closing
- —
- Monthly P&I
- —
- Monthly cashflow
- —
- DSCR
- —
- Eligible?
- —
Personal DTI + credit; lowest rate.
DSCR
20% down · 8.5% · 30yr
- Down + closing
- —
- Monthly P&I
- —
- Monthly cashflow
- —
- DSCR
- —
- Eligible?
- —
No personal income docs; deal must DSCR.
Hard money
10% down · 12.0% · 12mo
- Down + closing
- —
- Monthly P&I
- —
- Monthly cashflow
- —
- DSCR
- —
- Eligible?
- —
Short-term bridge; refi at stabilization.
Rent comps 18 comps
| Address | Beds | Baths | Sqft | Rent | $/sqft | DOM | Units | Dist |
|---|---|---|---|---|---|---|---|---|
| 100 Vanderbilt Ln Spartanburg, SC | 1.0–2.0 | 1.0–2.0 | 787 | $1,195 | $1.52 | 21d | 1 | 0.53mi |
| 694 Saxon Ave Spartanburg, SC | 3.0 | 1.0 | 1014 | $1,300 | $1.28 | 21d | 1 | 0.56mi |
| 321 Southstar St Spartanburg, SC | 2.0 | 1.0 | 895 | $849 | $0.95 | 21d | 1 | 0.57mi |
| 317 Southstar St Spartanburg, SC | 2.0 | 1.0 | 895 | $849 | $0.95 | 21d | 1 | 0.58mi |
| 500 Howard St Spartanburg, SC | 1.0–3.0 | 1.0–2.0 | 999 | $1,650 | $1.65 | 13d | 1 | 0.90mi |
| 408 Abner Rd Spartanburg, SC | 2.0–3.0 | 2.0 | 996 | $1,515 | $1.52 | 21d | 6 | 0.97mi |
| 560 Magnolia St Spartanburg, SC | 2.0 | 1.0 | 965 | $1,113 | $1.15 | 21d | 1 | 1.05mi |
| 131 College St Spartanburg, SC | 2.0 | 1.0 | 700 | $1,195 | $1.71 | 21d | 1 | 1.08mi |
| 142 Magnolia St Unit 301 Spartanburg, SC | 2.0 | 2.0 | 937 | $1,850 | $1.97 | 21d | 1 | 1.20mi |
| 334 W Hampton Ave Unit 1 Spartanburg, SC | 2.0 | 1.0 | 895 | $1,100 | $1.23 | 21d | 1 | 1.24mi |
| 111 Timothy St Spartanburg, SC | 2.0 | 1.0 | 1100 | $1,600 | $1.45 | 21d | 1 | 1.25mi |
| 300 Amherst Dr Spartanburg, SC | 2.0 | 1.0 | 763 | $975 | $1.28 | 13d | 1 | 1.39mi |
| 201 Powell Mill Rd Spartanburg, SC | 1.0–3.0 | 1.0–2.0 | 1426 | $1,345 | $0.94 | 13d | 23 | 1.43mi |
| 311 Powell Mill Rd Spartanburg, SC | 2.0 | 1.0 | 675 | $995 | $1.47 | 21d | 1 | 1.44mi |
| 201 N Liberty St Spartanburg, SC | 3.0 | 1.0–2.0 | 1153 | $2,330 | $2.02 | 13d | 32 | 1.46mi |
| 174 E Main St Spartanburg, SC | 1.0–2.0 | 1.0–2.0 | 760 | $2,295 | $3.02 | 13d | 8 | 1.46mi |
| 118 Morningside Dr Spartanburg, SC | 2.0 | 1.0 | 800 | $850 | $1.06 | 21d | 1 | 1.47mi |
| 116 Morningside Dr Spartanburg, SC | 2.0 | 1.0 | 800 | $850 | $1.06 | 21d | 1 | 1.47mi |
Listing history 18 events
-
2026-06-18days on market $99,900 Active 27 DOM
-
2026-06-17days on market $99,900 Active 26 DOM
-
2026-06-16days on market $99,900 Active 25 DOM
-
2026-06-15days on market $99,900 Active 24 DOM
-
2026-06-14days on market $99,900 Active 22 DOM
-
2026-06-13days on market $99,900 Active 21 DOM
-
2026-06-10days on market $99,900 Active 19 DOM
-
2026-06-09days on market $99,900 Active 18 DOM
-
2026-06-08days on market $99,900 Active 17 DOM
-
2026-06-07pricedays on market $99,900 Active 16 DOM
-
2026-06-02days on market $104,900 Active 11 DOM
-
2026-06-01days on market $104,900 Active 10 DOM
-
2026-05-31days on market $104,900 Active 9 DOM
-
2026-05-30days on market $104,900 Active 8 DOM
-
2026-05-22$104,900 Active
-
2021-05-18soldstatus $680,000
-
2019-01-28soldstatus $175,000
-
2011-12-28soldstatus $183,600
ⓘ Source: listings_history table (triggers on properties + properties_extension) + one-shot
backfill from property_details.listing_events for pre-trigger history.
Tax reassessment forecast SC · Resets to sale price
- Current annual tax
- $1,327 · $111/mo
- Projected year-2 tax
- $1,327 · $111/mo
- Expected delta
- $0/yr ($0/mo · 0.0%)
ⓘ Screening estimate from a state-policy table — verify with the county assessor before closing.
Climate risk First Street
- Flood 1/10 Low FEMA zone X (unshaded) · 0% chance over 30 yrs
- Wildfire 1/10 Low
- Heat 5/10 Major 7 d/yr ≥105°F today · 15 d/yr by 30 yrs out
- Wind 2/10 Low 2% chance of damaging wind over 30 yrs
- Air quality 4/10 Moderate 4 unhealthy d/yr today · 5 by 30 yrs out
Nearby sold comps map
Loading sold comps map…
Walkable amenities ~0.75 mi
Loading nearby amenities…
Taxation est. · year 1
- Rental income
- $15,564
- − Mortgage interest
- −$5,596
- − Property taxes
- −$1,327
- − Insurance
- −$500
- − Repairs & maintenance
- −$1,245
- − Management
- −$1,245
- − Depreciation
- −$2,906
- Taxable income
- $2,746
- Est. tax owed @ 24.0%
- −$659
- After-tax cash flow
- $3,524/yr
For passive investors: Depreciation is non-cash, so a rental often shows a tax loss while cash-flowing — sheltering income. Rental losses are passive: they offset passive income freely, and up to $25,000/yr can offset ordinary (W-2) income if you actively participate and your MAGI is under $100k (phasing out to $0 by $150k); unused losses carry forward. On sale, claimed depreciation is recaptured at up to 25%, and gains may owe capital-gains tax (a 1031 exchange can defer both). Figures are a year-1 estimate at your 24.0% rate — not tax advice; consult a CPA.
Schools (NCES district)
- District
- Spartanburg 07
- NCES district ID
- 4503660
- Math proficiency
- 34% ▼ -1.00%
- Reading proficiency
- 41% ▼ -1.00%
- Median HH income
- $35,825
- Composite
- 31.04/100
- National rank
- #6087
- State rank
- #39 of 80 in SC
Livability — Spartanburg
- Score
- 76/100
- State rank
- #24
- US rank
- #3679
Category grades
Schools grade is shown separately in the Schools card above.
Census & demographics
- Census place
- Spartanburg, SC
- County
- Spartanburg County · 258,607 people
- City population
- 120,406
- Metro
- Spartanburg, SC
- Population (ZIP)
- 36,278
- Household income
- $57,805
- Rent vs Own
- Severe rent burden
- 1331.0
Population outlook (Spartanburg County) Hauer SSP2
- Today (2025)
- 325,495 people
- By 2030
- 338,800 · +4.1%
- By 2040
- 363,471 · +11.7%
- By 2050
- 384,156 · +18.0%
- By 2075
- 430,137 · +32.1%
- By 2100
- 442,733 · +36.0%
Race, ethnicity, and origin ACS 2023
- Neighborhood character
- Diverse neighborhood (Simpson 0.67)
- Race & ethnicity
- White 45% Black 32% Hispanic / Latino 13% Two or more races 9% Asian 5%
- Hispanic origin (detail)
- Mexican 7% Puerto Rican 2%
- Common ancestry
- Slovak 2% Lithuanian 1% Italian 1%
- Foreign-born
- 12% · Canada, China, Vietnam
- Languages at home
- 83% English-only · Spanish 10% Other Indo-European 3% Other Asian/Pacific 1%
Political lean MEDSL · Spartanburg
- 2024 margin
- Solid R (+33.6) · D 32.6% · R 66.2% · Other 1.2%
- 2008→2024 swing
- -12.0pp toward R · 2008: -21.6pp · 2024: -33.6pp
- All cycles
- 2024: R+33.6 2020: R+27.3 2016: R+30.0 2012: R+23.1 2008: R+21.6
Not yet ingested
- Civics
- —
Market trends
- HPI YoY
- ▼ -77.19%
- Current HPI
- 228.4172
- Rent YoY
- ▼ -2.64%
- Metro
- Spartanburg, SC
- State GDP YoY
- ▲ 4.51%
- F500 in state
- 2
Industry mix (Fortune 500 HQ in SC)
| Industry | F500 HQs | Revenue |
|---|---|---|
| Packaging | 1 | $7B |
|
||
Price history
-42.9% since first listed4 events — show timeline
- 2026-05-22 Listed $104,900 SPMLS
- 2021-05-18 Sold (Public Records) $680,000 Public Records
- 2019-01-28 Sold (Public Records) $175,000 Public Records
- 2011-12-28 Sold (Public Records) $183,600 Public Records
Property tax history
+9.8%/yrLatest (2025): $1,327 · +0.9% YoY. Source: county tax records.
Cash-flow waterfall
monthlySold comps — $/sqft
last 12 mo · ≤1 miLoading sold comps…