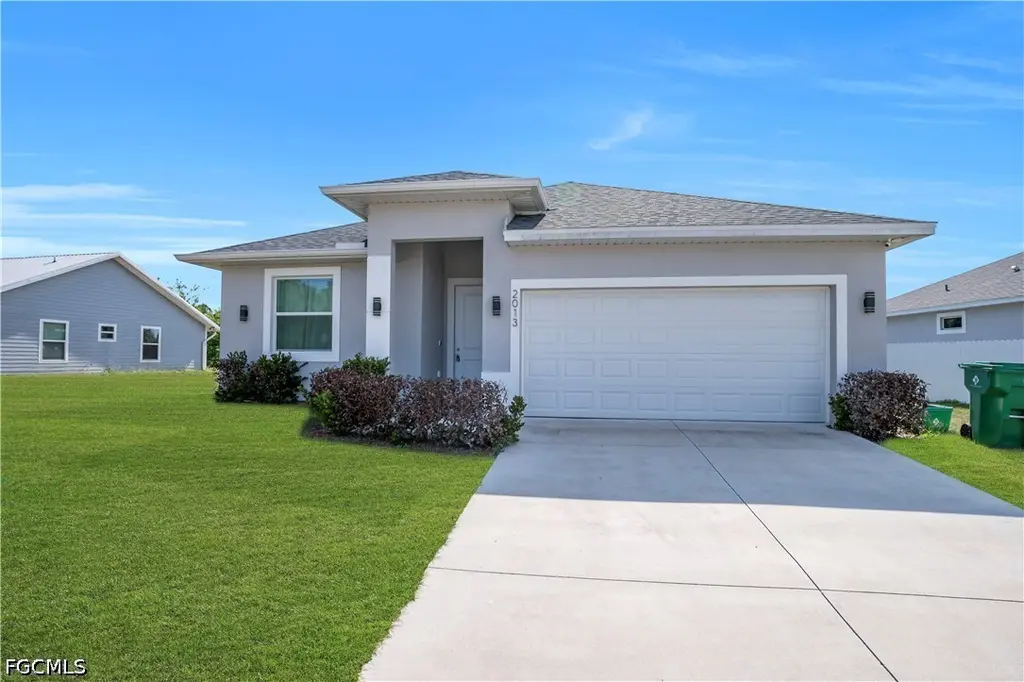
2013 Inglewood · Port LaBelle, FL
Flood risk 1/10 · Minimal
- FEMA flood zone
- X (unshaded)
- Chance of flooding over 30 yrs
- 0.0%
- Est. flood insurance / yr
- $507 – $1,088
Fire risk 2/10 · Minimal
- Est. fire insurance / yr
- $947 – $1,759
Heat risk 9/10 · Severe
- Hot days now (above 108°F)
- 7 days/yr
- Hot days in 30 yrs
- 25 days/yr
Wind risk 10/10 · Severe
- Chance of severe wind over 30 yrs
- 99.0%
Air-quality risk 2/10 · Minimal
- Unhealthy air days now
- 2 days/yr
- Unhealthy air days in 30 yrs
- 2 days/yr
Risk factors via First Street. Map © Google.
Why this score? — see what drove the D- grade
The composite is a weighted blend of 9 inputs, each scored 0–100. Each bar is that input's sub-score; the figure is the points it added to the 100-point composite (weight × sub-score).
- Appreciation +10.0/10.0
- Cash flow +7.3/30.0
- ARV discount +3.8/15.0
- Schools +3.1/10.0
- Livability +3.1/5.0
- Rent growth +2.5/5.0
- Condition / age +2.5/5.0
- 1% rule +2.3/10.0
- DSCR +1.4/10.0
$319,900
🖨 Deal sheet 📄 Offer letter ✓ Due diligence
Listing remarks
Welcome to the Madison Model, a beautifully designed new construction home offering 3 bedrooms, 2 full bathrooms, and a convenient half bath for guests. This modern residence features smart home automation, allowing you to control security cameras, lighting, and window blinds with ease. Enjoy premium finishes throughout, including high-end kitchen and bathroom cabinetry, elegant fixtures, and thoughtfully designed living spaces. The home also offers a spacious laundry room, a 2-car garage, and a covered lanai perfect for outdoor entertaining and relaxing. Located in the growing community of LaBelle, this home combines comfort, technology, and quality craftsmanship. Schedule your private tou
Key facts
- Covered lanai
- Premium finishes
- 2 garage spots
Tags
Property features AI
Finance
- Other: 1 unit in community
- Financial info: Pets allowed
- HOA & community: Association amenities include boat dock, boat ramp, playground, park and sidewalks; Association provides pest control
Exterior
- Parking: Attached garage with 2 assigned covered spaces; Garage door opener
- Security: Smoke detector(s)
- Utilities: Public water; Septic tank; Cable available
- Home design: Single-story; New construction; Faces east; Lot exposure to the west; Rectangular lot; Lot dimensions approximately 87 x 125 x 74 x 125 (per plans)
- Construction: Tile roof; Block, concrete and stucco construction
- Exterior features: Courtyard; Deck; Patio
Interior
- Kitchen: Built-in oven; Dishwasher; Electric cooktop; Microwave; Refrigerator; Pantry; Eat-in kitchen
- Flooring: Tile
- Bathrooms: 2 full bathrooms; 1 half bathroom
- Heating & cooling: Central heating (electric); Central air (electric)
- Interior features: Built-in features; Bathtub; Dual sinks; Eat-in kitchen; High ceilings; Living/dining room; Pantry; Separate shower; Walk-in closet(s); Instant hot water; Smart home; Display windows; Impact glass; Unfurnished
- Laundry & utility: Laundry inside; Instant hot water
Neighborhood map
What this means for you Summary
Snapshot
- This is a 3-bed/3.0-bath single-family listed at $320k.
Deal economics
- At list price, monthly cash flow is $-430 ($-5k/yr) — negative.
- To cash-flow at today's rent, offer at most $244k (23.7% below list).
- To meet the 1% rule (rent ≥ 1% of price), the offer needs to be $234k (26.8% below list).
- Recommended offer: $234k (26.8% below list) — sets the bar for 1% rule.
Location & tenants
- Location reads 62/100 on livability (#750 in FL) — a middle-class / working-renter tenant base. Strengths: cost of living A+, housing A+; Watch: schools F, amenities F, commute F.
- Hendry (town): math 35% / reading 40% proficiency, ranked #65 of 73 in FL (top 89%) — families likely to look elsewhere, expect single-tenant / working-renter base with shorter leases; 75% free/reduced lunch — lower-income household profile, screen leases tightly.
- Market conditions: 942 active listings in the ZIP; 6 comparable units currently listed for rent nearby; rentals at typical pace (median 24d on market — plan ~3-4 weeks tenant-placement turnaround); 557 units permitted in Hendry County in 2024 (45 in 5+ unit buildings).
- At $2,342/mo this rent would consume 49% of the median local household income ($57k/yr) (locally 498% of renters already pay >50% of income on rent) — very limited rent-growth headroom before tenants either downsize or default.
Forward outlook
- In year one you build about $34k of equity ($2k loan paydown + $32k appreciation (10.0% local appreciation)).
- Hendry County population projected to shrink 7% by 2050 — rents likely to lag national; underwrite the cash flow, not the appreciation.
- By year 2, paydown + projected appreciation supports a ~$55k cash-out refi (75% LTV) — recoverable capital for the next deal without selling this one.
Negotiation context
- Only 8 days on market — expect competitive offers; lowballing is unlikely to land.
- 7 sale attempts since 4y ago with the ask held roughly flat each time — persistent listings suggest the price (not the market) is what's stuck; bring a comps-based counter.
- Current owner paid $80k; list at $320k implies a 300% gain — meaningful room to come down on a strong offer.
Risks & watch-outs
- Climate carrying-cost: severe wind risk, 99% chance of damaging wind over 30y; extreme-heat days projected 7→25/yr by 2055 (HVAC capex compounding) — expect insurance premiums to compound above CPI over the hold.
Questions for the listing agent
- What do current leases actually rent for vs. the listed asking? Can we see a recent rent roll and the last 12 months of T-12 income?
- Is there a deadline driving the sale (1031 exchange, divorce, estate, relocation)? That informs how much negotiation room exists.
- Schools are F-rated, which usually means shorter tenancies and higher turnover. Who's the typical renter profile here, and what's been the actual vacancy rate?
- The area grade is low — what's the realistic commute time and amenity access for the typical tenant pool here? Any planned neighborhood developments (good or bad) we should know about?
- What's the average days-on-market for RENTAL listings here right now (not sales)? A rising rental-DOM trend means longer vacancies and softer asking-rent achievability than the comps imply.
- What's the recent tenant-quality profile in this submarket — average credit score on applications, eviction rate, late-payment / NSF rate, and stable-employment percentage? A property-management company in the area should have these aggregated.
- How much new for-sale + rental construction is in the pipeline within 1–3 miles? Heavy new supply typically softens prices + rents 12–24 months out; constrained supply supports both.
Investment metrics
- 1% rule
- 0.73% ✗
- Cap rate
- 4.68%
- Cash-on-cash
- -5.76%
- DSCR
- 0.74
- GRM
- 11.4
CMA / ARV
- ARV (on-the-fly)
- $295,372
- Comps found
- 12
Show comp detail 12 sales within ~0.75 mi
| Address | Dist | Beds/Ba | Sqft | Sold | Price | $/sf | Match |
|---|---|---|---|---|---|---|---|
| 2001 Inglewood Cir | 0.08mi | 3/2.0 | 1,565 (+4%) | 12mo | $314,900 | $201 | 76 |
| 2014 Odessa Cir | 0.26mi | 3/2.0 | 1,584 (+5%) | 1mo | $265,000 | $167 | 75 |
| 4002 Cascade Ln | 0.22mi | 3/2.0 | 1,344 (-11%) | 3mo | $280,000 | $208 | 65 |
| 2040 S Montana Cir | 0.43mi | 3/2.0 | 1,392 (-8%) | 0mo | $230,000 | $165 | 63 |
| 4018 Caloosa Loop | 0.43mi | 3/2.0 | 1,404 (-7%) | 2mo | $214,000 | $152 | 63 |
| 3019 N Tulip Rd | 0.56mi | 4/2.0 (+1) | 1,499 (-0%) | 3mo | $285,000 | $190 | 62 |
| 2033 Inglewood Cir | 0.15mi | 4/3.0 (+1) | 1,715 (+14%) | 6mo | $360,000 | $210 | 59 |
| 2001 Jeronimo Rd | 0.38mi | 3/2.0 | 1,356 (-10%) | 5mo | $295,000 | $218 | 58 |
| 2009 Granada Rd | 0.30mi | 4/2.0 (+1) | 1,666 (+11%) | 10mo | $290,000 | $174 | 51 |
| 2029 Jeronimo Rd | 0.34mi | 3/2.0 | 1,292 (-14%) | 11mo | $299,900 | $232 | 47 |
| 3005 Birwood Cir | 0.73mi | 3/2.0 | 1,404 (-7%) | 12mo | $275,000 | $196 | 41 |
| 4038 Rainbow Cir | 0.69mi | 3/2.0 | 1,377 (-9%) | 12mo | $225,000 | $163 | 39 |
Match score weights: distance 35% · size 25% · config 20% · recency 20%. Top-matched comps best support the ARV.
Projected returns pro-forma
10.0% appreciation · 3.0% rent growth · sell at horizon
- IRR
- 20.2%
- Equity multiple
- 2.64×
- Total profit
- $146,943
- Equity at exit
- $288,191
- IRR
- 18.5%
- Equity multiple
- 6.07×
- Total profit
- $454,394
- Equity at exit
- $621,495
Cash invested: $89,572 (down + closing). Projections, not guarantees.
Landlord ↔ Tenant lean methodology
- Overall (STATE)
- 87 Strongly Landlord-Friendly
- State Florida
- 87 Strongly Landlord-Friendly · R+3
- County
- — inherits STATE
- City
- — inherits STATE
ZIP-level market 33935
- Home prices YoY
- 16.3%
- Active inventory
- 942
- Price-to-rent
- 11.4×
Monthly cashflow live
- Estimated rent
- $2,342 high interval (Pro) →
- Mortgage (P&I)
- −$1,678
- Tax from tax record
- −$469 /mo · $5,624/yr
- Insurance
- −$133
- HOA
- −$0
- Vacancy / Maint / Mgmt
- −$492
- Net cashflow
- $-430
Break-even live
UW: 25.0% down · 7.5% · 30yr · 1.5% tax · 5.0% vac · 8.0% maint · 8.0% mgmt
Financing live
Cash to close
- Down payment
- $79,975
- Closing costs
- $9,597
- Reserves months
- —
- Total cash needed
- —
Loan-product check · same deal, 3 products live
Conventional
25% down · 7.5% · 30yr
- Down + closing
- —
- Monthly P&I
- —
- Monthly cashflow
- —
- DSCR
- —
- Eligible?
- —
Personal DTI + credit; lowest rate.
DSCR
20% down · 8.5% · 30yr
- Down + closing
- —
- Monthly P&I
- —
- Monthly cashflow
- —
- DSCR
- —
- Eligible?
- —
No personal income docs; deal must DSCR.
Hard money
10% down · 12.0% · 12mo
- Down + closing
- —
- Monthly P&I
- —
- Monthly cashflow
- —
- DSCR
- —
- Eligible?
- —
Short-term bridge; refi at stabilization.
Rent comps 6 comps
| Address | Beds | Baths | Sqft | Rent | $/sqft | DOM | Units | Dist |
|---|---|---|---|---|---|---|---|---|
| 3020 N Lakewood Rd Labelle, FL | 4.0 | 2.0 | 1499 | $1,950 | $1.30 | 24d | 1 | 0.80mi |
| 5029 S Rosebud Cir Labelle, FL | 3.0 | 2.0 | 1389 | $1,780 | $1.28 | 24d | 1 | 1.04mi |
| 1092 Riverbend Dr Labelle, FL | 2.0 | 2.5 | 2100 | $2,900 | $1.38 | 21d | 1 | 1.10mi |
| 3051 NW Beechwood Cir Labelle, FL | 4.0 | 2.0 | 1499 | $2,200 | $1.47 | 24d | 1 | 1.31mi |
| 5012 Gunn Pl Labelle, FL | 3.0 | 2.5 | 1783 | $2,500 | $1.40 | 3d | 1 | 1.40mi |
| 5029 W Hummingbird Dr Labelle, FL | 3.0 | 2.0 | 1212 | $2,450 | $2.02 | 3d | 1 | 1.43mi |
Listing history 13 events
-
2026-06-18days on market $319,900 Active 8 DOM
-
2026-06-17days on market $319,900 Active 7 DOM
-
2026-06-16days on market $319,900 Active 6 DOM
-
2026-06-15days on market $319,900 Active 5 DOM
-
2026-06-13days on market $319,900 Active 3 DOM
-
2026-06-13remarks 699-char remark
-
2026-06-13days on market $319,900 Active 2 DOM
-
2026-06-10days on market $319,900 Active 8 DOM
-
2026-06-09days on market $319,900 Active 7 DOM
-
2026-06-08days on market $319,900 Active 6 DOM
-
2026-06-07days on market $319,900 Active 5 DOM
-
2026-06-03remarks 641-char remark
-
2026-06-03$319,900 Active 1 DOM
ⓘ Source: listings_history table (triggers on properties + properties_extension) + one-shot
backfill from property_details.listing_events for pre-trigger history.
Tax reassessment forecast FL · Resets to sale price
- Current annual tax
- $5,624 · $469/mo
- Projected year-2 tax
- $5,624 · $469/mo
- Expected delta
- $0/yr ($0/mo · 0.0%)
ⓘ Screening estimate from a state-policy table — verify with the county assessor before closing.
Climate risk First Street
- Flood 1/10 Low FEMA zone X (unshaded) · 0% chance over 30 yrs
- Wildfire 2/10 Low
- Heat 9/10 Extreme 7 d/yr ≥108°F today · 25 d/yr by 30 yrs out
- Wind 10/10 Extreme 99% chance of damaging wind over 30 yrs
- Air quality 2/10 Low 2 unhealthy d/yr today · 2 by 30 yrs out
Nearby sold comps map
Loading sold comps map…
Walkable amenities ~0.75 mi
Loading nearby amenities…
Taxation est. · year 1
- Rental income
- $28,100
- − Mortgage interest
- −$17,919
- − Property taxes
- −$5,624
- − Insurance
- −$1,600
- − Repairs & maintenance
- −$2,248
- − Management
- −$2,248
- − Depreciation
- −$9,306
- Taxable loss
- −$10,844
- Est. tax savings @ 24.0%
- +$2,603
- After-tax cash flow
- $-2,552/yr
For passive investors: Depreciation is non-cash, so a rental often shows a tax loss while cash-flowing — sheltering income. Rental losses are passive: they offset passive income freely, and up to $25,000/yr can offset ordinary (W-2) income if you actively participate and your MAGI is under $100k (phasing out to $0 by $150k); unused losses carry forward. On sale, claimed depreciation is recaptured at up to 25%, and gains may owe capital-gains tax (a 1031 exchange can defer both). Figures are a year-1 estimate at your 24.0% rate — not tax advice; consult a CPA.
Schools (NCES district)
- District
- Hendry
- NCES district ID
- 1200780
- Math proficiency
- 35% ▼ -11.00%
- Reading proficiency
- 40% ▼ -4.00%
- Median HH income
- $37,043
- Composite
- 31.16/100
- National rank
- #6054
- State rank
- #65 of 73 in FL
Livability — Port LaBelle
- Score
- 62/100
- State rank
- #750
- US rank
- #16264
Category grades
Schools grade is shown separately in the Schools card above.
Census & demographics
- Census place
- Port LaBelle, FL
- County
- Hendry County · 23,186 people
- Metro
- Clewiston, FL
- Population (ZIP)
- 23,186
- Household income
- $57,009
- Rent vs Own
- Severe rent burden
- 498.0
Population outlook (Hendry County) Hauer SSP2
- Today (2025)
- 38,866 people
- By 2030
- 38,558 · -0.8%
- By 2040
- 37,743 · -2.9%
- By 2050
- 36,117 · -7.1%
- By 2075
- 30,070 · -22.6%
- By 2100
- 21,966 · -43.5%
Race, ethnicity, and origin ACS 2023
- Neighborhood character
- Majority Hispanic (56%)
- Race & ethnicity
- Hispanic / Latino 56% White 39% Two or more races 21% Black 2% Native American 2%
- Hispanic origin (detail)
- Mexican 40% Puerto Rican 3% Cuban 5%
- Common ancestry
- Lithuanian 2% Serbian 2% Slovak 1%
- Foreign-born
- 27% · Canada, Jamaica
- Languages at home
- 50% English-only · Spanish 50%
Political lean MEDSL · Hendry
- 2024 margin
- Solid R (+38.3) · D 30.4% · R 68.7%
- 2008→2024 swing
- -31.1pp toward R · 2008: -7.2pp · 2024: -38.3pp
- All cycles
- 2024: R+38.3 2020: R+23.0 2016: R+14.2 2012: R+5.9 2008: R+7.2
Not yet ingested
- Civics
- —
Market trends
- HPI YoY
- ▲ 75.20%
- Current HPI
- 537.4928
- Rent YoY
- —
- Metro
- Clewiston, FL
- State GDP YoY
- ▲ 3.28%
- F500 in state
- 36
Industry mix (Fortune 500 HQ in FL)
| Industry | F500 HQs | Revenue |
|---|---|---|
| Industrial Technology | 2 | $29B |
|
||
| Insurance | 2 | $17B |
|
||
| Retail | 1 | $60B |
|
||
| Technology Distribution | 1 | $58B |
|
||
| Homebuilding | 1 | $35B |
|
||
| Technology Manufacturing | 1 | $35B |
|
||
Price history
+3099.0% since first listed18 events — show timeline
- 2026-06-02 Listed $319,900 FORTMLS
- 2025-10-21 Rental Removed $2,350 NAPLESMLS
- 2025-10-10 Listing Removed — FORTMLS
- 2025-10-08 Listed for Rent $2,350 NAPLESMLS
- 2025-10-08 Rental Removed $2,350 FORTMLS
- 2025-09-27 Price Changed $2,350 FORTMLS
- 2025-09-19 Listed for Rent $2,450 FORTMLS
- 2025-09-12 Listing Removed — FORTMLS
- 2025-09-12 Listing Removed — MARMLS
- 2025-09-12 Listed $319,500 FORTMLS
- 2025-08-22 Price Changed $319,500 FORTMLS
- 2025-05-23 Listed $319,900 MARMLS
- 2025-05-15 Listed $319,900 FORTMLS
- 2022-03-02 Sold (Public Records) $80,000 Public Records
- 2022-02-22 Sold (MLS) $20,000 FORTMLS
- 2022-02-01 Pending — FORTMLS
- 2022-01-28 Listed $25,000 FORTMLS
- 1991-06-19 Sold (Public Records) $10,000 Public Records
Property tax history
+39.8%/yrLatest (2025): $5,624 · +1140.3% YoY. Source: county tax records.
Cash-flow waterfall
monthlySold comps — $/sqft
last 12 mo · ≤1 miLoading sold comps…