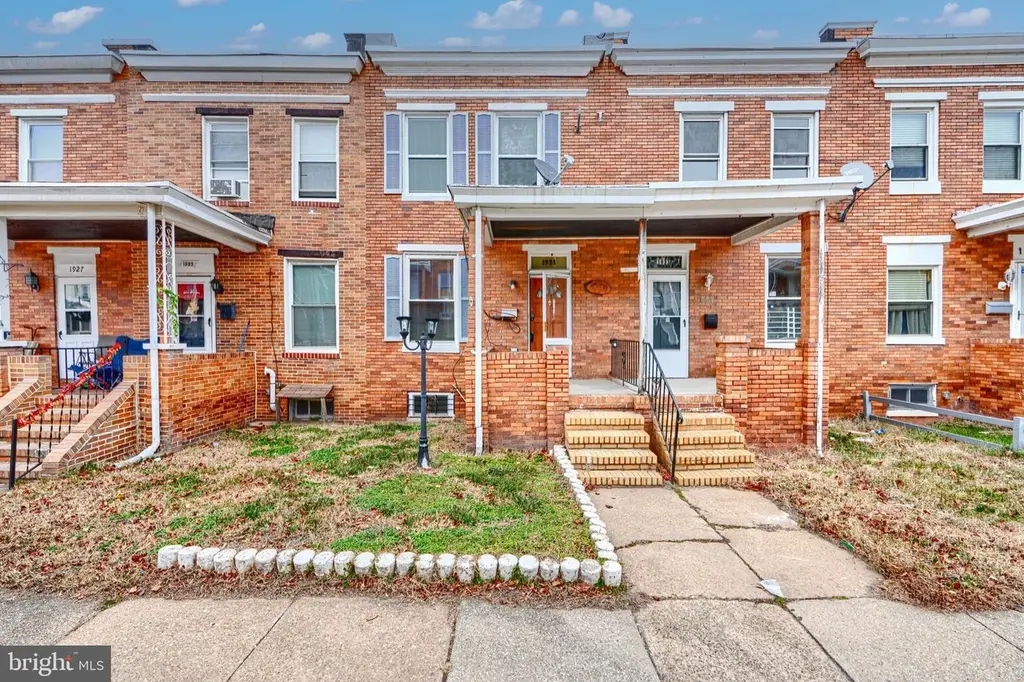
1931 Griffis Ave · Baltimore, MD
Flood risk 1/10 · Minimal
- FEMA flood zone
- X (unshaded)
- Chance of flooding over 30 yrs
- 0.0%
- Est. flood insurance / yr
- $473 – $860
Fire risk 1/10 · Minimal
- Est. fire insurance / yr
- $755 – $1,403
Heat risk 8/10 · Major
- Hot days now (above 103°F)
- 7 days/yr
- Hot days in 30 yrs
- 15 days/yr
Wind risk 6/10 · Moderate
- Chance of severe wind over 30 yrs
- 27.0%
Air-quality risk 3/10 · Minor
- Unhealthy air days now
- 3 days/yr
- Unhealthy air days in 30 yrs
- 4 days/yr
Risk factors via First Street. Map © Google.
Why this score? — see what drove the B- grade
The composite is a weighted blend of 9 inputs, each scored 0–100. Each bar is that input's sub-score; the figure is the points it added to the 100-point composite (weight × sub-score).
- Cash flow +30.0/30.0
- DSCR +10.0/10.0
- 1% rule +9.5/10.0
- ARV discount +7.9/15.0
- Livability +3.8/5.0
- Condition / age +2.5/5.0
- Rent growth +2.2/5.0
- Schools +1.0/10.0
- Appreciation +0.0/10.0
$110,000
🖨 Deal sheet 📄 Offer letter ✓ Due diligence
Listing remarks
GREAT LOCATION ON WONDERFUL BLOCK ON 1900 BLOCK ON GRIFFIS STREET. THIS PROPERTY HAS A STUNNING VIEW OF BALTIMORE CITY, BACK PATIO DECK, FINISHED BASEMENT, WASHER DRYER, UPSTAIRS TWO BED TWO BATH! GREAT FOR RESIDENTIAL USE AND PERFECT FOR AN INVESTMENT PROPERTY FOR ALL BUYERS! SCHEDULE UOIR SHOWING TODAY.
Key facts
- Built 1925
- Listed 17 days
Property features AI
Exterior
- Parking: On-street parking
- Utilities: Public water; Public sewer; Other hot water source; Other heating fuel; Other cooling fuel
- Home design: Interior townhouse/rowhouse; Fee simple ownership
- Construction: Brick construction; Other foundation; Above-grade and below-grade structures
- Exterior features: No tidal water
Interior
- Bedrooms: Two bedrooms on the first upper level
- Bathrooms: One full bathroom (all upper levels)
- Heating & cooling: Radiator heating; Other cooling
- Interior features: Estimated living area; Fully finished basement; Pets allowed (dogs and cats; pet addendum/deposit may apply)
Neighborhood map
What this means for you Summary
Snapshot
- This is a 2-bed/1.0-bath townhouse listed at $110k.
Deal economics
- At list price, monthly cash flow is $608 ($7k/yr) — positive.
- The deal already cash-flows at list — no discount required.
- Meets the 1% rule at list price ($2k rent vs $110k).
- Recommended offer: $108k (1.5% below list) — sets the bar for market timing.
- Cap rate 12.9% vs local median 6.0% in Baltimore — top-decile yield for the area; either an underpriced asset or a hidden risk that comps aren't pricing in. Stress-test before assuming the spread holds.
Location & tenants
- Location reads 76/100 on livability (#90 in MD, #3,396 nationally) — a middle-class / working-renter tenant base. Strengths: amenities A+, commute A+, housing A+; Watch: schools D, crime F.
- Baltimore City Public Schools (urban): math 7% / reading 16% proficiency, ranked #24 of 24 in MD (top 100%) — low school quality limits family demand, transient renter base, plan for 1-2y turnover; 79% free/reduced lunch — lower-income household profile, screen leases tightly.
- Market conditions: Rents soft (-1.0%/yr); 362 active listings in the ZIP; 30 comparable units currently listed for rent nearby; rentals at typical pace (median 24d on market — plan ~3-4 weeks tenant-placement turnaround); solid renter incomes; 1,273 units permitted in Baltimore city in 2024 (1,104 in 5+ unit buildings).
Forward outlook
- Local home prices are declining (-3.0%/yr); year-one equity from $761 of loan paydown is wiped out by about $3k of value loss. Plan a longer hold.
- Baltimore County population projected to shrink 4% by 2050 — rents likely to lag national; underwrite the cash flow, not the appreciation.
- At projected returns (-3.0% appreciation + 0.0% rent growth), your $31k cash investment doubles in ~7 years — after that, you're playing with house money.
Negotiation context
- It's been on market 17 days — a 2% lower offer ($108k) is reasonable based on typical stale-listing flexibility.
- 8 sale attempts since 31y ago; this cycle's ask is 8048% above the opening price — seller raised mid-cycle; expect resistance to lowballs.
Risks & watch-outs
- Watch-outs: built in 1925 — expect roof / HVAC / electrical / plumbing capex.
- Climate carrying-cost: major wind risk, 27% chance of damaging wind over 30y; extreme-heat days projected 7→15/yr by 2055 (HVAC capex compounding) — expect insurance premiums to compound above CPI over the hold.
Questions for the listing agent
- Built in 1925 — when were the roof, HVAC, electrical panel, plumbing, and water heater last replaced?
- Is there a deadline driving the sale (1031 exchange, divorce, estate, relocation)? That informs how much negotiation room exists.
- Schools are D-rated, which usually means shorter tenancies and higher turnover. Who's the typical renter profile here, and what's been the actual vacancy rate?
- Crime grade is F in this area — have there been break-ins, vandalism, or insurance claims at this property in the last 3 years? What carrier currently insures it and at what premium?
- What's the average days-on-market for RENTAL listings here right now (not sales)? A rising rental-DOM trend means longer vacancies and softer asking-rent achievability than the comps imply.
- What's the recent tenant-quality profile in this submarket — average credit score on applications, eviction rate, late-payment / NSF rate, and stable-employment percentage? A property-management company in the area should have these aggregated.
- How much new for-sale + rental construction is in the pipeline within 1–3 miles? Heavy new supply typically softens prices + rents 12–24 months out; constrained supply supports both.
Investment metrics
- 1% rule
- 1.45% ✓
- Cap rate
- 12.93%
- Cash-on-cash
- 23.69%
- DSCR
- 2.05
- GRM
- 5.7
CMA / ARV
- ARV (median comp)
- $110,929
- List price
- $110,000
- Delta
- -0.84%
- Verdict
- FAIR
- Comps
- 20 within 1.0 mi
Show comp detail 12 sales within ~0.75 mi
| Address | Dist | Beds/Ba | Sqft | Sold | Price | $/sf | Match |
|---|---|---|---|---|---|---|---|
| 1931 Griffis Ave | 0.00mi | 2/1.0 | 912 (0%) | 0mo | $120,000 | $132 | 100 |
| 2006 Grinnalds Ave | 0.09mi | 2/1.0 | 812 (-11%) | 4mo | $57,000 | $70 | 74 |
| 2104 Whistler Ave | 0.22mi | 2/1.0 | 840 (-8%) | 3mo | $82,500 | $98 | 74 |
| 2047 Grinnalds Ave | 0.12mi | 2/1.0 | 812 (-11%) | 10mo | $133,000 | $164 | 68 |
| 2021 Grinnalds Ave | 0.09mi | 2/1.0 | 812 (-11%) | 12mo | $78,750 | $97 | 68 |
| 2014 Grinnalds Ave | 0.10mi | 2/2.0 | 1,015 (+11%) | 6mo | $80,000 | $79 | 67 |
| 2030 Grinnalds Ave | 0.12mi | 2/1.0 | 812 (-11%) | 13mo | $129,000 | $159 | 66 |
| 1919 Deering Ave | 0.35mi | 2/1.5 | 864 (-5%) | 11mo | $125,000 | $145 | 64 |
| 1926 Griffis Ave | 0.03mi | 3/1.0 (+1) | 1,016 (+11%) | 14mo | $95,000 | $94 | 63 |
| 1710 Wickes Ave | 0.41mi | 3/2.0 (+1) | 1,024 (+12%) | 3mo | $150,000 | $146 | 49 |
| 1606 Forest Hill Ave | 0.64mi | 2/2.0 | 840 (-8%) | 14mo | $154,000 | $183 | 41 |
| 2630 Alaska St | 0.71mi | 3/1.5 (+1) | 1,008 (+10%) | 7mo | $85,000 | $84 | 36 |
Match score weights: distance 35% · size 25% · config 20% · recency 20%. Top-matched comps best support the ARV.
Projected returns pro-forma
-3.0% appreciation · 0.0% rent growth · sell at horizon
- IRR
- 13.6%
- Equity multiple
- 1.53×
- Total profit
- $16,189
- Equity at exit
- $16,401
- IRR
- 20.2%
- Equity multiple
- 2.48×
- Total profit
- $45,732
- Equity at exit
- $9,511
Cash invested: $30,800 (down + closing). Projections, not guarantees.
Landlord ↔ Tenant lean methodology
- Overall (CITY)
- 12 Strongly Tenant-Friendly
- State Maryland
- 27 Tenant-Leaning · D+14
- County
- — inherits STATE
- City Baltimore
- 12 Strongly Tenant-Friendly · D+58
ZIP-level market 21230
- Rents YoY
- -1.0%
- Active inventory
- 362
- Price-to-rent
- 5.7×
Monthly cashflow live
- Estimated rent
- $1,595 high interval (Pro) →
- Mortgage (P&I)
- −$577
- Tax from tax record
- −$29 /mo · $352/yr
- Insurance
- −$46
- HOA
- −$0
- Vacancy / Maint / Mgmt
- −$335
- Net cashflow
- $608
Break-even live
UW: 25.0% down · 7.5% · 30yr · 1.5% tax · 5.0% vac · 8.0% maint · 8.0% mgmt
Financing live
Cash to close
- Down payment
- $27,500
- Closing costs
- $3,300
- Reserves months
- —
- Total cash needed
- —
Loan-product check · same deal, 3 products live
Conventional
25% down · 7.5% · 30yr
- Down + closing
- —
- Monthly P&I
- —
- Monthly cashflow
- —
- DSCR
- —
- Eligible?
- —
Personal DTI + credit; lowest rate.
DSCR
20% down · 8.5% · 30yr
- Down + closing
- —
- Monthly P&I
- —
- Monthly cashflow
- —
- DSCR
- —
- Eligible?
- —
No personal income docs; deal must DSCR.
Hard money
10% down · 12.0% · 12mo
- Down + closing
- —
- Monthly P&I
- —
- Monthly cashflow
- —
- DSCR
- —
- Eligible?
- —
Short-term bridge; refi at stabilization.
Rent comps 30 comps
| Address | Beds | Baths | Sqft | Rent | $/sqft | DOM | Units | Dist |
|---|---|---|---|---|---|---|---|---|
| 1931 Griffis Ave Baltimore, MD | 2.0 | 1.0 | 912 | $1,349 | $1.48 | 4d | 1 | 0.03mi |
| 2429 Washington Blvd Baltimore, MD | 1.0 | 1.0 | 940 | $600 | $0.64 | 23d | 1 | 0.07mi |
| 3004 Elizabeth Ave Unit 1 Baltimore, MD | 3.0 | 1.0 | 1024 | $1,395 | $1.36 | 4d | 1 | 0.87mi |
| 3017 Janice Ave Baltimore, MD | 3.0 | 1.0 | 1024 | $1,995 | $1.95 | 23d | 1 | 0.88mi |
| 2657 Lehman St Unit 1 Baltimore, MD | 2.0 | 1.0 | 1056 | $1,000 | $0.95 | 43d | 1 | 0.95mi |
| 1432 Carroll St Baltimore, MD | 2.0 | 1.5 | 912 | $1,900 | $2.08 | 43d | 1 | 1.01mi |
| 2600 W Patapsco Ave Baltimore, MD | 1.0–2.0 | 1.0 | 856 | $1,309 | $1.53 | 2d | 24 | 1.02mi |
| 2540 Frederick Ave Baltimore, MD | 3.0 | 1.0 | 1075 | $1,400 | $1.30 | 23d | 1 | 1.10mi |
| 332 S Franklintown Rd Unit 2 Baltimore, MD | 2.0 | 1.0 | 776 | $795 | $1.02 | 23d | 1 | 1.11mi |
| 2200 W Patapsco Ave Baltimore, MD | 3.0 | 1.0 | 890 | $1,569 | $1.76 | 43d | 1 | 1.14mi |
| 1708 Hall Ave Unit 2 Halethorpe, MD | 2.0 | 1.0 | 845 | $1,625 | $1.92 | 11d | 1 | 1.21mi |
| 1215 James St Baltimore, MD | 2.0 | 1.0 | 960 | $1,500 | $1.56 | 43d | 1 | 1.26mi |
| 305 S Calhoun St Baltimore, MD | 2.0 | 1.0 | 1000 | $1,300 | $1.30 | 21d | 1 | 1.27mi |
| 1163 Washington Blvd Baltimore, MD | 2.0 | 2.5 | 1012 | $1,700 | $1.68 | 12d | 1 | 1.30mi |
| 1712 W Lombard St #4 Baltimore, MD | 1.0 | 1.0 | 550 | $900 | $1.64 | 43d | 1 | 1.31mi |
| 1160 Washington Blvd Baltimore, MD | 2.0 | 1.0 | 960 | $1,575 | $1.64 | 23d | 1 | 1.31mi |
| 1142 Sargeant St Baltimore, MD | 3.0 | 2.0 | 1080 | $1,601 | $1.48 | 1d | 1 | 1.34mi |
| 1127 Sargeant St Baltimore, MD | 2.0 | 1.5 | 1080 | $1,275 | $1.18 | 23d | 1 | 1.34mi |
| 2516 Hollins St Baltimore, MD | 3.0 | 2.0 | 1100 | $1,700 | $1.55 | 43d | 1 | 1.36mi |
| 3392 Saint Benedict St Baltimore, MD | 2.0 | 1.0 | 864 | $1,450 | $1.68 | 23d | 1 | 1.37mi |
| 1125 Wicomico St Baltimore, MD | 3.0 | 3.0 | 1068 | $1,955 | $1.83 | 23d | 1 | 1.37mi |
| 1918 W Baltimore St Baltimore, MD | 2.0–3.0 | 1.0–2.0 | 857 | $1,375 | $1.60 | 43d | 1 | 1.41mi |
| 1324 W Lombard St Unit 1 Baltimore, MD | 2.0 | 2.0 | 1100 | $1,500 | $1.36 | 23d | 1 | 1.42mi |
| 1324 W Lombard St Unit 2 Baltimore, MD | 2.0 | 1.5 | 1100 | $1,450 | $1.32 | 43d | 1 | 1.42mi |
| 853 Reinhart St Baltimore, MD | 2.0 | 2.5 | 780 | $1,800 | $2.31 | 43d | 1 | 1.44mi |
| 1601 Frederick Ave Unit 3 Baltimore, MD | 2.0 | 1.0 | 1050 | $1,050 | $1.00 | 4d | 1 | 1.44mi |
| 1315 Hollins St Unit 2 Baltimore, MD | 3.0 | 2.0 | 1096 | $1,860 | $1.70 | 4d | 1 | 1.47mi |
| 1315 Hollins St Unit 2 Baltimore, MD | 3.0 | 2.0 | 1096 | $1,950 | $1.78 | 12d | 1 | 1.47mi |
| 62 N Gorman Ave Baltimore, MD | 3.0 | 2.0 | 1100 | $2,500 | $2.27 | 17d | 1 | 1.47mi |
| 923 McHenry St Baltimore, MD | 3.0 | 1.0 | 1008 | $1,625 | $1.61 | 43d | 1 | 1.48mi |
Listing history 23 events
-
2026-05-17status Pending 308-char remark
-
2026-05-05price $1,349
-
2026-05-01$1,350
-
2026-04-30$110,000 Active 308-char remark
-
2026-02-03historical $1,350
-
2026-01-17$1,350
-
2025-12-31historical $1,350
-
2025-12-29price $1,350
-
2025-12-04price $1,400
-
2025-11-20$1,300
-
2025-11-20historical $1,300
-
2025-11-06price $1,300
-
2025-09-19$1,400
-
2018-12-31historical
-
2018-12-28$29,900 Active
-
2003-05-28soldstatus $63,000
-
2003-02-06soldstatus $63,000
-
2002-12-24historical
-
2002-08-20$63,000
-
1996-09-10historical
-
1995-09-27
-
1987-07-14soldstatus $43,200
-
1984-08-07soldstatus $35,500
ⓘ Source: listings_history table (triggers on properties + properties_extension) + one-shot
backfill from property_details.listing_events for pre-trigger history.
Tax reassessment forecast MD · Partial reset (capped growth)
- Current annual tax
- $352 · $29/mo
- Projected year-2 tax
- $776 · $65/mo
- Expected delta
- +$423/yr (+$35/mo · 120.2%)
ⓘ Screening estimate from a state-policy table — verify with the county assessor before closing.
Climate risk First Street
- Flood 1/10 Low FEMA zone X (unshaded) · 0% chance over 30 yrs
- Wildfire 1/10 Low
- Heat 8/10 Severe 7 d/yr ≥103°F today · 15 d/yr by 30 yrs out
- Wind 6/10 Major 27% chance of damaging wind over 30 yrs
- Air quality 3/10 Moderate 3 unhealthy d/yr today · 4 by 30 yrs out
Nearby sold comps map
Loading sold comps map…
Walkable amenities ~0.75 mi
Loading nearby amenities…
Taxation est. · year 1
- Rental income
- $19,142
- − Mortgage interest
- −$6,162
- − Property taxes
- −$352
- − Insurance
- −$550
- − Repairs & maintenance
- −$1,531
- − Management
- −$1,531
- − Depreciation
- −$3,200
- Taxable income
- $5,815
- Est. tax owed @ 24.0%
- −$1,396
- After-tax cash flow
- $5,902/yr
For passive investors: Depreciation is non-cash, so a rental often shows a tax loss while cash-flowing — sheltering income. Rental losses are passive: they offset passive income freely, and up to $25,000/yr can offset ordinary (W-2) income if you actively participate and your MAGI is under $100k (phasing out to $0 by $150k); unused losses carry forward. On sale, claimed depreciation is recaptured at up to 25%, and gains may owe capital-gains tax (a 1031 exchange can defer both). Figures are a year-1 estimate at your 24.0% rate — not tax advice; consult a CPA.
Schools (NCES district)
- District
- Baltimore City Public Schools
- NCES district ID
- 2400090
- Math proficiency
- 7% ▼ -9.00%
- Reading proficiency
- 16% ▼ -5.00%
- Median HH income
- $42,108
- Composite
- 10.08/100
- National rank
- #9805
- State rank
- #24 of 24 in MD
Livability — Baltimore
- Score
- 76/100
- State rank
- #90
- US rank
- #3396
Category grades
Schools grade is shown separately in the Schools card above.
Census & demographics
- Census place
- Baltimore, MD
- County
- Baltimore City · 558,601 people
- City population
- 588,727
- Metro
- Baltimore-Columbia-Towson, MD
- Population (ZIP)
- 32,977
- Household income
- $91,842
- Rent vs Own
- Severe rent burden
- 1463.0
Population outlook (Baltimore County) Hauer SSP2
- Today (2025)
- 624,249 people
- By 2030
- 621,541 · -0.4%
- By 2040
- 609,756 · -2.3%
- By 2050
- 597,249 · -4.3%
- By 2075
- 552,236 · -11.5%
- By 2100
- 513,934 · -17.7%
Race, ethnicity, and origin ACS 2023
- Neighborhood character
- Diverse neighborhood (Simpson 0.63)
- Race & ethnicity
- White 55% Black 23% Hispanic / Latino 13% Two or more races 6% Asian 4%
- Hispanic origin (detail)
- Mexican 1% Puerto Rican 1%
- Common ancestry
- Romanian 5% Lithuanian 2% Italian 2%
- Foreign-born
- 10% · Canada, China
- Languages at home
- 85% English-only · Spanish 9% Other Indo-European 1% Other Asian/Pacific 1%
Political lean MEDSL · Baltimore
- 2024 margin
- Solid D (+73.0) · D 85.2% · R 12.2% · Other 2.6%
- 2008→2024 swing
- -2.5pp toward R · 2008: 75.5pp · 2024: 73.0pp
- All cycles
- 2024: D+73.0 2020: D+76.6 2016: D+74.6 2012: D+76.4 2008: D+75.5
Not yet ingested
- Civics
- —
Market trends
- HPI YoY
- ▼ -311.43%
- Current HPI
- 284.338
- Rent YoY
- ▼ -1.00%
- Metro
- Baltimore-Columbia-Towson, MD
- State GDP YoY
- ▲ 2.97%
- F500 in state
- 12
Industry mix (Fortune 500 HQ in MD)
| Industry | F500 HQs | Revenue |
|---|---|---|
| Aerospace / Defense | 1 | $71B |
|
||
| Utilities | 1 | $25B |
|
||
| Hotels | 1 | $24B |
|
||
| Consumer Goods | 1 | $7B |
|
||
| Real Estate | 1 | $6B |
|
||
| Chemicals | 1 | $2B |
|
||
Price history
-96.2% since first listed25 events — show timeline
- 2026-06-18 Rental Removed $1,349 BRIGHTMLS
- 2026-06-15 Sold (MLS) $120,000 BRIGHT MLS
- 2026-05-17 Pending — BRIGHT MLS
- 2026-05-05 Price Changed $1,349 BRIGHTMLS
- 2026-05-01 Listed for Rent $1,350 BRIGHTMLS
- 2026-04-30 Listed $110,000 BRIGHT MLS
- 2026-02-03 Rental Removed $1,350 BRIGHTMLS
- 2026-01-17 Listed for Rent $1,350 BRIGHTMLS
- 2025-12-31 Rental Removed $1,350 BRIGHTMLS
- 2025-12-29 Price Changed $1,350 BRIGHTMLS
- 2025-12-04 Price Changed $1,400 BRIGHTMLS
- 2025-11-20 Listed for Rent $1,300 BRIGHTMLS
- 2025-11-20 Rental Removed $1,300 APPFOLIO
- 2025-11-06 Price Changed $1,300 APPFOLIO
- 2025-09-19 Listed for Rent $1,400 APPFOLIO
- 2018-12-31 Listing Removed — BRIGHT MLS
- 2018-12-28 Listed $29,900 BRIGHT MLS
- 2003-05-28 Sold (Public Records) $63,000 Public Records
- 2003-02-06 Sold (MLS) $63,000 MRIS
- 2002-12-24 Delisted — MRIS
- 2002-08-20 Listed $63,000 MRIS
- 1996-09-10 Delisted — MRIS
- 1995-09-27 Listed — MRIS
- 1987-07-14 Sold (Public Records) $43,200 Public Records
- 1984-08-07 Sold (Public Records) $35,500 Public Records
Property tax history
-10.6%/yrLatest (2025): $352 · +0.0% YoY. Source: county tax records.
Cash-flow waterfall
monthlySold comps — $/sqft
last 12 mo · ≤1 miLoading sold comps…