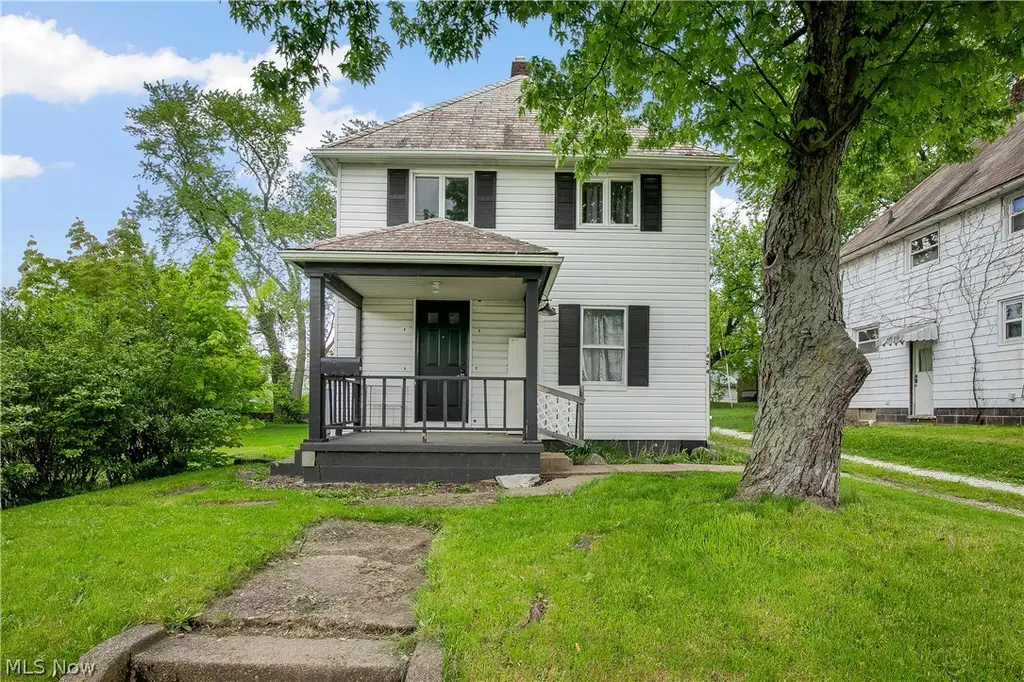
1424 S Liberty Ave · Alliance, OH
Flood risk 1/10 · Minimal
- FEMA flood zone
- X (unshaded)
- Chance of flooding over 30 yrs
- 0.0%
- Est. flood insurance / yr
- $473 – $860
Fire risk 1/10 · Minimal
- Est. fire insurance / yr
- $713 – $1,323
Heat risk 3/10 · Minor
- Hot days now (above 97°F)
- 7 days/yr
- Hot days in 30 yrs
- 17 days/yr
Wind risk 1/10 · Minimal
- Chance of severe wind over 30 yrs
- —
Air-quality risk 2/10 · Minimal
- Unhealthy air days now
- 1 days/yr
- Unhealthy air days in 30 yrs
- 2 days/yr
Risk factors via First Street. Map © Google.
Why this score? — see what drove the C grade
The composite is a weighted blend of 9 inputs, each scored 0–100. Each bar is that input's sub-score; the figure is the points it added to the 100-point composite (weight × sub-score).
- Cash flow +22.8/30.0
- ARV discount +8.6/15.0
- DSCR +7.3/10.0
- 1% rule +5.5/10.0
- Livability +3.9/5.0
- Schools +3.5/10.0
- Rent growth +2.5/5.0
- Condition / age +2.5/5.0
- Appreciation +0.0/10.0
$104,500
🖨 Deal sheet 📄 Offer letter ✓ Due diligence
Listing remarks MLS
Lots of updates! 3 bedrooms, updated bath, updated kitchen cabinets, all new paint and flooring! New furnace and updated plumbing.
Key facts
- Fresh paint
- New front door
- Large storage shed
Tags
Property features AI
Exterior
- Parking: Driveway
- Utilities: Public water; Public sewer
- Home design: 2-story house; Vinyl siding; Slate roof
- Construction: Built (year per public records); Vinyl siding construction; Slate roof
- Exterior features: Front porch; Outbuilding for storage
Interior
- Kitchen: Range; Refrigerator
- Bathrooms: One full bathroom
- Heating & cooling: Forced air heating (gas); Ceiling fan(s); Window cooling unit(s)
- Interior features: Unfinished basement with sump pump; Front porch; One fireplace
- Laundry & utility: Laundry in basement
Neighborhood map
What this means for you Summary
Snapshot
- This is a 3-bed/1.0-bath single-family listed at $104k.
Deal economics
- At list price, monthly cash flow is $182 ($2k/yr) — positive.
- The deal already cash-flows at list — no discount required.
- Meets the 1% rule at list price ($1k rent vs $104k).
- Recommended offer: $101k (3.0% below list) — sets the bar for market timing.
- Cap rate 8.4% vs local median 4.8% in Alliance — top-decile yield for the area; either an underpriced asset or a hidden risk that comps aren't pricing in. Stress-test before assuming the spread holds.
Location & tenants
- Location reads 78/100 on livability (#175 in OH, #2,737 nationally) — a middle-class / working-renter tenant base. Strengths: commute A+, cost of living A+, housing A+; Watch: amenities F, employment F.
- Alliance City (town): math 39% / reading 45% proficiency, ranked #536 of 656 in OH (top 82%) — families likely to look elsewhere, expect single-tenant / working-renter base with shorter leases; 71% free/reduced lunch — lower-income household profile, screen leases tightly.
- Market conditions: 166 active listings in the ZIP; 5 comparable units currently listed for rent nearby; rentals leasing fast (median 14d on market — plan ~1-2 weeks tenant-placement turnaround); 528 units permitted in Stark County in 2024 (84 in 5+ unit buildings).
Forward outlook
- Local home prices are declining (-3.0%/yr); year-one equity from $722 of loan paydown is wiped out by about $3k of value loss. Plan a longer hold.
- Stark County population projected to shrink 8% by 2050 — rents likely to lag national; underwrite the cash flow, not the appreciation.
Negotiation context
- It's been on market 48 days — a 3% lower offer ($101k) is reasonable based on typical stale-listing flexibility.
- 4 sale attempts since 18y ago with the ask held roughly flat each time — persistent listings suggest the price (not the market) is what's stuck; bring a comps-based counter.
- Current owner paid $60k; list at $104k implies a 74% gain — meaningful room to come down on a strong offer.
Risks & watch-outs
- Watch-outs: built in 1919 — expect roof / HVAC / electrical / plumbing capex.
Questions for the listing agent
- It's been on market 48 days. Have you received any prior offers? Is the seller open to a 3% concession, seller financing, or rate buy-down credit?
- Built in 1919 — when were the roof, HVAC, electrical panel, plumbing, and water heater last replaced?
- Is there a deadline driving the sale (1031 exchange, divorce, estate, relocation)? That informs how much negotiation room exists.
- Schools are B-rated — typically a magnet for longer-tenancy family renters. What's the average tenant stay here, and is there a school-zone premium baked into asking?
- What's the average days-on-market for RENTAL listings here right now (not sales)? A rising rental-DOM trend means longer vacancies and softer asking-rent achievability than the comps imply.
- What's the recent tenant-quality profile in this submarket — average credit score on applications, eviction rate, late-payment / NSF rate, and stable-employment percentage? A property-management company in the area should have these aggregated.
- How much new for-sale + rental construction is in the pipeline within 1–3 miles? Heavy new supply typically softens prices + rents 12–24 months out; constrained supply supports both.
Investment metrics
- 1% rule
- 1.05% ✓
- Cap rate
- 8.38%
- Cash-on-cash
- 7.46%
- DSCR
- 1.33
- GRM
- 7.9
CMA / ARV
- ARV (median comp)
- $107,017
- List price
- $104,500
- Delta
- -2.35%
- Verdict
- FAIR
- Comps
- 20 within 1.0 mi
Show comp detail 12 sales within ~0.75 mi
| Address | Dist | Beds/Ba | Sqft | Sold | Price | $/sf | Match |
|---|---|---|---|---|---|---|---|
| 815 Grace St | 0.07mi | 3/1.0 | 1,178 (+0%) | 8mo | $172,000 | $146 | 90 |
| 1608 S Liberty Ave | 0.11mi | 3/1.0 | 1,130 (-4%) | 3mo | $145,750 | $129 | 86 |
| 1537 S Liberty Ave | 0.10mi | 3/1.0 | 1,248 (+6%) | 6mo | $173,000 | $139 | 81 |
| 1044 S Liberty Ave | 0.25mi | 4/1.0 (+1) | 1,212 (+3%) | 7mo | $90,000 | $74 | 72 |
| 624 E College St | 0.21mi | 3/1.0 | 1,320 (+12%) | 1mo | $160,000 | $121 | 69 |
| 1846 S Freedom Ave | 0.35mi | 3/2.0 | 1,267 (+8%) | 5mo | $60,000 | $47 | 62 |
| 2376 S Seneca Ave | 0.66mi | 3/1.0 | 1,187 (+1%) | 7mo | $179,900 | $152 | 62 |
| 935 S Morgan Ave | 0.35mi | 3/1.0 | 1,337 (+14%) | 2mo | $40,000 | $30 | 59 |
| 2351 S Freedom Ave | 0.65mi | 3/1.0 | 1,236 (+5%) | 4mo | $85,000 | $69 | 58 |
| 46 Rosenberry St | 0.59mi | 3/1.5 | 1,056 (-10%) | 2mo | $115,000 | $109 | 52 |
| 152 E Mill St | 0.65mi | 3/1.5 | 1,296 (+10%) | 3mo | $194,900 | $150 | 48 |
| 2464 S Freedom Ave | 0.74mi | 3/2.0 | 1,296 (+10%) | 1mo | $175,000 | $135 | 44 |
Match score weights: distance 35% · size 25% · config 20% · recency 20%. Top-matched comps best support the ARV.
Projected returns pro-forma
-3.0% appreciation · 3.0% rent growth · sell at horizon
- IRR
- -4.9%
- Equity multiple
- 0.82×
- Total profit
- $-5,360
- Equity at exit
- $15,581
- IRR
- 4.8%
- Equity multiple
- 1.35×
- Total profit
- $10,220
- Equity at exit
- $9,035
Cash invested: $29,260 (down + closing). Projections, not guarantees.
Landlord ↔ Tenant lean methodology
- Overall (STATE)
- 73 Landlord-Friendly
- State Ohio
- 73 Landlord-Friendly · R+6
- County
- — inherits STATE
- City
- — inherits STATE
ZIP-level market 44601
- Active inventory
- 166
- Price-to-rent
- 7.9×
Monthly cashflow live
- Estimated rent
- $1,099 high interval (Pro) →
- Mortgage (P&I)
- −$548
- Tax from tax record
- −$95 /mo · $1,138/yr
- Insurance
- −$44
- HOA
- −$0
- Vacancy / Maint / Mgmt
- −$231
- Net cashflow
- $182
Break-even live
UW: 25.0% down · 7.5% · 30yr · 1.5% tax · 5.0% vac · 8.0% maint · 8.0% mgmt
Financing live
Cash to close
- Down payment
- $26,125
- Closing costs
- $3,135
- Reserves months
- —
- Total cash needed
- —
Loan-product check · same deal, 3 products live
Conventional
25% down · 7.5% · 30yr
- Down + closing
- —
- Monthly P&I
- —
- Monthly cashflow
- —
- DSCR
- —
- Eligible?
- —
Personal DTI + credit; lowest rate.
DSCR
20% down · 8.5% · 30yr
- Down + closing
- —
- Monthly P&I
- —
- Monthly cashflow
- —
- DSCR
- —
- Eligible?
- —
No personal income docs; deal must DSCR.
Hard money
10% down · 12.0% · 12mo
- Down + closing
- —
- Monthly P&I
- —
- Monthly cashflow
- —
- DSCR
- —
- Eligible?
- —
Short-term bridge; refi at stabilization.
Rent comps 5 comps
| Address | Beds | Baths | Sqft | Rent | $/sqft | DOM | Units | Dist |
|---|---|---|---|---|---|---|---|---|
| 1329 Auld St Alliance, OH | 2.0 | 2.0 | 900 | $895 | $0.99 | 13d | 1 | 0.45mi |
| 1329 Auld St Unit 1329 Alliance, OH | 2.0 | 2.0 | 900 | $925 | $1.03 | 13d | 1 | 0.45mi |
| 734 Mill Cir Alliance, OH | 1.0–2.0 | 1.0 | 724 | $940 | $1.30 | 13d | 1 | 0.58mi |
| 2406 S Union Ave Alliance, OH | 4.0 | 2.0 | 1394 | $1,600 | $1.15 | 43d | 1 | 0.86mi |
| 109 W Ely St Alliance, OH | 3.0 | 1.0 | 1344 | $1,300 | $0.97 | 13d | 1 | 1.29mi |
Listing history 24 events
-
2026-06-18days on market $104,500 Active 48 DOM
-
2026-06-17days on market $104,500 Active 47 DOM
-
2026-06-16days on market $104,500 Active 46 DOM
-
2026-06-15days on market $104,500 Active 45 DOM
-
2026-06-14days on market $104,500 Active 43 DOM
-
2026-06-13days on market $104,500 Active 42 DOM
-
2026-06-10days on market $104,500 Active 40 DOM
-
2026-06-09days on market $104,500 Active 39 DOM
-
2026-06-08days on market $104,500 Active 38 DOM
-
2026-06-07days on market $104,500 Active 37 DOM
-
2026-06-02days on market $104,500 Active 32 DOM
-
2026-06-01days on market $104,500 Active 31 DOM
-
2026-05-31days on market $104,500 Active 30 DOM
-
2026-05-30pricedays on market $104,500 Active 29 DOM
-
2026-05-01$109,900 Active 942-char remark
-
2022-10-19soldstatus $60,000
-
2022-10-17soldstatus $60,000 Closed 130-char remark
Show marketing remark (130 chars)
Lots of updates! 3 bedrooms, updated bath, updated kitchen cabinets, all new paint and flooring! New furnace and updated plumbing.
-
2022-10-02status Pending 130-char remark
Show marketing remark (130 chars)
Lots of updates! 3 bedrooms, updated bath, updated kitchen cabinets, all new paint and flooring! New furnace and updated plumbing.
-
2022-08-22price $69,900 130-char remark
Show marketing remark (130 chars)
Lots of updates! 3 bedrooms, updated bath, updated kitchen cabinets, all new paint and flooring! New furnace and updated plumbing.
-
2022-08-01status Active 130-char remark
Show marketing remark (130 chars)
Lots of updates! 3 bedrooms, updated bath, updated kitchen cabinets, all new paint and flooring! New furnace and updated plumbing.
-
2022-05-17status Pending 130-char remark
Show marketing remark (130 chars)
Lots of updates! 3 bedrooms, updated bath, updated kitchen cabinets, all new paint and flooring! New furnace and updated plumbing.
-
2022-05-05$74,900 Active 130-char remark
Show marketing remark (130 chars)
Lots of updates! 3 bedrooms, updated bath, updated kitchen cabinets, all new paint and flooring! New furnace and updated plumbing.
-
2008-06-16soldstatus $5,700
Show marketing remark (41 chars)
Vinyl sided, needs work price accordingly
-
2008-03-24$7,700
Show marketing remark (41 chars)
Vinyl sided, needs work price accordingly
ⓘ Source: listings_history table (triggers on properties + properties_extension) + one-shot
backfill from property_details.listing_events for pre-trigger history.
Tax reassessment forecast OH · Partial reset (capped growth)
- Current annual tax
- $1,138 · $95/mo
- Projected year-2 tax
- $1,384 · $115/mo
- Expected delta
- +$246/yr (+$21/mo · 21.6%)
ⓘ Screening estimate from a state-policy table — verify with the county assessor before closing.
Climate risk First Street
- Flood 1/10 Low FEMA zone X (unshaded) · 0% chance over 30 yrs
- Wildfire 1/10 Low
- Heat 3/10 Moderate 7 d/yr ≥97°F today · 17 d/yr by 30 yrs out
- Wind 1/10 Low
- Air quality 2/10 Low 1 unhealthy d/yr today · 2 by 30 yrs out
Nearby sold comps map
Loading sold comps map…
Walkable amenities ~0.75 mi
Loading nearby amenities…
Taxation est. · year 1
- Rental income
- $13,188
- − Mortgage interest
- −$5,854
- − Property taxes
- −$1,138
- − Insurance
- −$522
- − Repairs & maintenance
- −$1,055
- − Management
- −$1,055
- − Depreciation
- −$3,040
- Taxable income
- $523
- Est. tax owed @ 24.0%
- −$126
- After-tax cash flow
- $2,056/yr
For passive investors: Depreciation is non-cash, so a rental often shows a tax loss while cash-flowing — sheltering income. Rental losses are passive: they offset passive income freely, and up to $25,000/yr can offset ordinary (W-2) income if you actively participate and your MAGI is under $100k (phasing out to $0 by $150k); unused losses carry forward. On sale, claimed depreciation is recaptured at up to 25%, and gains may owe capital-gains tax (a 1031 exchange can defer both). Figures are a year-1 estimate at your 24.0% rate — not tax advice; consult a CPA.
Schools (NCES district)
- District
- Alliance City
- NCES district ID
- 3904349
- Math proficiency
- 39% ▼ -9.00%
- Reading proficiency
- 45% ▼ -5.00%
- Median HH income
- $33,326
- Composite
- 34.54/100
- National rank
- #5176
- State rank
- #536 of 656 in OH
Livability — Alliance
- Score
- 78/100
- State rank
- #175
- US rank
- #2737
Category grades
Schools grade is shown separately in the Schools card above.
Census & demographics
- Census place
- Alliance, OH
- County
- Stark County · 272,865 people
- City population
- 32,696
- Metro
- Canton-Massillon, OH
- Population (ZIP)
- 32,696
- Household income
- $61,965
- Rent vs Own
- Severe rent burden
- 780.0
Population outlook (Stark County) Hauer SSP2
- Today (2025)
- 373,708 people
- By 2030
- 371,245 · -0.7%
- By 2040
- 361,331 · -3.3%
- By 2050
- 345,290 · -7.6%
- By 2075
- 302,669 · -19.0%
- By 2100
- 238,870 · -36.1%
Race, ethnicity, and origin ACS 2023
- Neighborhood character
- Predominantly White (87%)
- Race & ethnicity
- White 87% Black 6% Two or more races 5% Hispanic / Latino 1%
- Common ancestry
- Italian 3% Lithuanian 2% Slovak 2%
- Foreign-born
- 1%
- Languages at home
- 98% English-only · Spanish 1%
Political lean MEDSL · Stark
- 2024 margin
- Strong R (+21.9) · D 38.6% · R 60.5%
- 2008→2024 swing
- -27.4pp toward R · 2008: 5.5pp · 2024: -21.9pp
- All cycles
- 2024: R+21.9 2020: R+18.5 2016: R+17.4 2012: R+0.4 2008: D+5.5
Not yet ingested
- Civics
- —
Market trends
- HPI YoY
- ▼ -174.62%
- Current HPI
- 224.9507
- Rent YoY
- —
- Metro
- Canton-Massillon, OH
- State GDP YoY
- ▲ 1.98%
- F500 in state
- 48
Industry mix (Fortune 500 HQ in OH)
| Industry | F500 HQs | Revenue |
|---|---|---|
| Insurance | 3 | $145B |
|
||
| Industrial Machinery | 3 | $49B |
|
||
| Financial Services | 3 | $24B |
|
||
| Consumer Goods | 2 | $93B |
|
||
| Aerospace / Defense | 2 | $47B |
|
||
| Utilities | 2 | $33B |
|
||
Price history
+1257.1% since first listed11 events — show timeline
- 2026-05-29 Price Changed $104,500 MLSNOW
- 2026-05-01 Listed $109,900 MLSNOW
- 2022-10-19 Sold (Public Records) $60,000 Public Records
- 2022-10-17 Sold (MLS) $60,000 MLSNOW
- 2022-10-02 Pending — MLSNOW
- 2022-08-22 Price Changed $69,900 MLSNOW
- 2022-08-01 Relisted — MLSNOW
- 2022-05-17 Pending — MLSNOW
- 2022-05-05 Listed $74,900 MLSNOW
- 2008-06-16 Sold (MLS) $5,700 MLSNOW
- 2008-03-24 Listed $7,700 MLSNOW
Property tax history
+3.6%/yrLatest (2024): $1,138 · +12.5% YoY. Source: county tax records.
Cash-flow waterfall
monthlySold comps — $/sqft
last 12 mo · ≤1 miLoading sold comps…