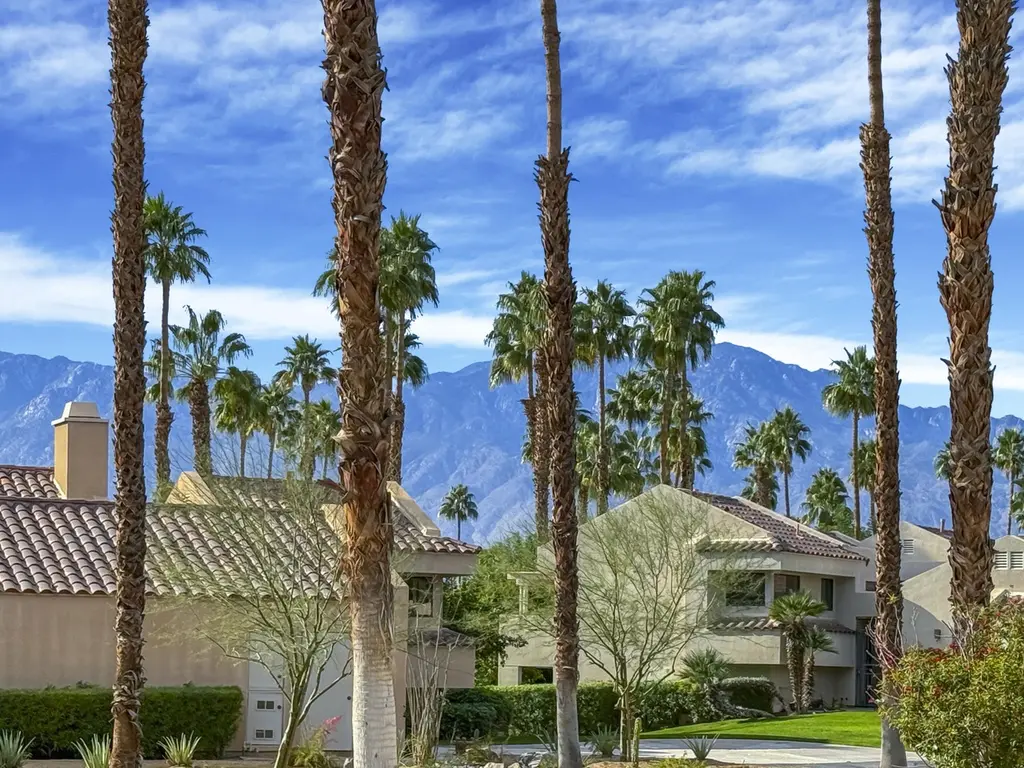
30 Mission Ct · Rancho Mirage, CA
Flood risk 1/10 · Minimal
- FEMA flood zone
- X (unshaded)
- Chance of flooding over 30 yrs
- 0.0%
- Est. flood insurance / yr
- $507 – $1,088
Fire risk 3/10 · Minor
- Est. fire insurance / yr
- $659 – $1,223
Heat risk 9/10 · Severe
- Hot days now (above 113°F)
- 7 days/yr
- Hot days in 30 yrs
- 19 days/yr
Wind risk 1/10 · Minimal
- Chance of severe wind over 30 yrs
- —
Air-quality risk 4/10 · Minor
- Unhealthy air days now
- 5 days/yr
- Unhealthy air days in 30 yrs
- 7 days/yr
Risk factors via First Street. Map © Google.
Why this score? — see what drove the C- grade
The composite is a weighted blend of 9 inputs, each scored 0–100. Each bar is that input's sub-score; the figure is the points it added to the 100-point composite (weight × sub-score).
- Cash flow +20.3/30.0
- 1% rule +8.3/10.0
- ARV discount +7.5/15.0
- DSCR +6.5/10.0
- Rent growth +3.4/5.0
- Schools +2.7/10.0
- Livability +2.6/5.0
- Condition / age +2.5/5.0
- Appreciation +0.0/10.0
$299,000
🖨 Deal sheet 📄 Offer letter ✓ Due diligence
Listing remarks MLS
The price reduction!! The seller is motivated. This condo has a great floor plan and the golf course view from the condo is fantastic. You can upgrade to your own taste to make your living wonderful. The community pools and spas are within walking distance. The owners only used it once a year. The furniture is included.
Key facts
- New flooring
- Pool and spa
- Brand-new appliances
Tags
Neighborhood map
What this means for you Summary
Snapshot
- This is a 3-bed/2.0-bath condo listed at $299k.
Deal economics
- At list price, monthly cash flow is $384 ($5k/yr) — positive.
- The deal already cash-flows at list — no discount required.
- Meets the 1% rule at list price ($4k rent vs $299k).
- Recommended offer: $272k (9.0% below list) — sets the bar for market timing.
- Cap rate 7.8% vs local median 3.0% in Rancho Mirage — top-decile yield for the area; either an underpriced asset or a hidden risk that comps aren't pricing in. Stress-test before assuming the spread holds.
Location & tenants
- Location reads 51/100 on livability (#1,065 in CA) — a working-class tenant base; expect higher turnover. Strengths: employment A+; Watch: amenities F, commute F, cost of living F.
- Palm Springs Unified (suburban): math 21% / reading 42% proficiency, ranked #328 of 517 in CA (top 63%) — families likely to look elsewhere, expect single-tenant / working-renter base with shorter leases; 73% free/reduced lunch — lower-income household profile, screen leases tightly.
- Market conditions: Rents rising (+3.7%/yr); 529 active listings in the ZIP; 33 comparable units currently listed for rent nearby; rentals lingering (median 44d on market — plan ~5-8 weeks vacancy on turnover, expect pricing pressure); 55% of comp listings sitting > 30 days — soft ceiling on asking rent; solid renter incomes; 9,195 units permitted in Riverside County in 2024 (1,512 in 5+ unit buildings).
- This rent runs 44% of the median local income ($107k/yr) — at the standard rent-burdened threshold; future hikes will face affordability resistance.
Forward outlook
- Local home prices are declining (-3.0%/yr); year-one equity from $2k of loan paydown is wiped out by about $9k of value loss. Plan a longer hold.
- Riverside County population projected at +22% by 2050 — long-run rental-demand tailwind backs the buy-and-hold thesis.
Negotiation context
- It's been on market 103 days — a 9% lower offer ($272k) is reasonable based on typical stale-listing flexibility.
- 2 sale attempts since 12y ago; this cycle's ask has dropped $30k (9%) from the opening price — seller is motivated, your offer sets the floor, not the list.
- Current owner paid $189k; list at $299k implies a 58% gain — meaningful room to come down on a strong offer.
Risks & watch-outs
- Climate carrying-cost: extreme-heat days projected 7→19/yr by 2055 (HVAC capex compounding) — expect insurance premiums to compound above CPI over the hold.
Questions for the listing agent
- It's been on market 103 days. Have you received any prior offers? Is the seller open to a 9% concession, seller financing, or rate buy-down credit?
- What does the HOA fee cover, when was the last increase, and are there any pending special assessments or reserve-fund shortfalls?
- Any open or pending special assessments — roof, HVAC, plumbing, elevator, façade? What's the per-unit balance and payoff schedule, and is the seller paying it off at close or rolling it to the buyer?
- Why hasn't it sold? Are there any deal-killer items the seller is aware of (foundation, flood, title, zoning, code violations)?
- Is there a deadline driving the sale (1031 exchange, divorce, estate, relocation)? That informs how much negotiation room exists.
- What's the average days-on-market for RENTAL listings here right now (not sales)? A rising rental-DOM trend means longer vacancies and softer asking-rent achievability than the comps imply.
- What's the recent tenant-quality profile in this submarket — average credit score on applications, eviction rate, late-payment / NSF rate, and stable-employment percentage? A property-management company in the area should have these aggregated.
- How much new apartment / multifamily construction is in the pipeline within 1–3 miles? Heavy new supply (>2% of stock underway) typically softens rents 12–24 months out; light construction supports rent growth.
Investment metrics
- 1% rule
- 1.33% ✓
- Cap rate
- 7.84%
- Cash-on-cash
- 5.51%
- DSCR
- 1.25
- GRM
- 6.3
CMA / ARV
No comps found within radius.
Projected returns pro-forma
-3.0% appreciation · 3.72% rent growth · sell at horizon
- IRR
- -6.6%
- Equity multiple
- 0.75×
- Total profit
- $-20,581
- Equity at exit
- $44,582
- IRR
- 4.3%
- Equity multiple
- 1.33×
- Total profit
- $27,649
- Equity at exit
- $25,852
Cash invested: $83,720 (down + closing). Projections, not guarantees.
Landlord ↔ Tenant lean methodology
- Overall (STATE)
- 18 Strongly Tenant-Friendly
- State California
- 18 Strongly Tenant-Friendly · D+13
- County
- — inherits STATE
- City
- — inherits STATE
ZIP-level market 92270
- Rents YoY
- 3.7%
- Active inventory
- 529
- Price-to-rent
- 6.3×
Monthly cashflow live
- Estimated rent
- $3,975 high interval (Pro) →
- Mortgage (P&I)
- −$1,568
- Tax from tax record
- −$288 /mo · $3,460/yr
- Insurance
- −$125
- HOA
- −$775
- Vacancy / Maint / Mgmt
- −$835
- Net cashflow
- $384
Break-even live
UW: 25.0% down · 7.5% · 30yr · 1.5% tax · 5.0% vac · 8.0% maint · 8.0% mgmt
Financing live
Cash to close
- Down payment
- $74,750
- Closing costs
- $8,970
- Reserves months
- —
- Total cash needed
- —
Loan-product check · same deal, 3 products live
Conventional
25% down · 7.5% · 30yr
- Down + closing
- —
- Monthly P&I
- —
- Monthly cashflow
- —
- DSCR
- —
- Eligible?
- —
Personal DTI + credit; lowest rate.
DSCR
20% down · 8.5% · 30yr
- Down + closing
- —
- Monthly P&I
- —
- Monthly cashflow
- —
- DSCR
- —
- Eligible?
- —
No personal income docs; deal must DSCR.
Hard money
10% down · 12.0% · 12mo
- Down + closing
- —
- Monthly P&I
- —
- Monthly cashflow
- —
- DSCR
- —
- Eligible?
- —
Short-term bridge; refi at stabilization.
Rent comps 33 comps
| Address | Beds | Baths | Sqft | Rent | $/sqft | DOM | Units | Dist |
|---|---|---|---|---|---|---|---|---|
| 35 Mission Ct Rancho Mirage, CA | 3.0 | 2.0 | 1382 | $4,125 | $2.98 | 43d | 1 | 0.07mi |
| 38 Mission Ct Rancho Mirage, CA | 3.0 | 3.0 | 1382 | $3,500 | $2.53 | 43d | 1 | 0.09mi |
| 8 Mission Ct Rancho Mirage, CA | 2.0 | 2.0 | 1540 | $2,500 | $1.62 | 18d | 1 | 0.10mi |
| 35090 Mission Hills Dr Rancho Mirage, CA | 2.0 | 2.0 | 1596 | $3,950 | $2.47 | 24d | 1 | 0.14mi |
| 35082 Mission Hills Dr Rancho Mirage, CA | 2.0 | 2.5 | 1624 | $3,250 | $2.00 | 12d | 1 | 0.15mi |
| 35054 Mission Hills Dr Rancho Mirage, CA | 2.0 | 2.0 | 1396 | $2,549 | $1.83 | 4d | 1 | 0.23mi |
| 70170 Sun Valley Dr Rancho Mirage, CA | 2.0 | 2.0 | 1368 | $3,800 | $2.78 | 4d | 1 | 0.69mi |
| 107 Racquet Club Dr Rancho Mirage, CA | 2.0 | 2.0 | 1488 | $4,500 | $3.02 | 43d | 1 | 0.75mi |
| 118 Racquet Club Dr Rancho Mirage, CA | 2.0 | 2.0 | 1488 | $2,900 | $1.95 | 43d | 1 | 0.80mi |
| 462 Sunningdale Dr Rancho Mirage, CA | 2.0 | 2.0 | 1547 | $3,750 | $2.42 | 43d | 1 | 0.89mi |
| 464 Sunningdale Dr Rancho Mirage, CA | 3.0 | 3.0 | 1751 | $6,000 | $3.43 | 43d | 1 | 0.90mi |
| 36040 Avenida de las Montanas Unit E Cathedral City, CA | 2.0 | 2.0 | 1220 | $3,200 | $2.62 | 43d | 1 | 0.91mi |
| 37800 Da Vall Dr #12 Rancho Mirage, CA | 2.0 | 2.0 | 1387 | $2,400 | $1.73 | 43d | 1 | 0.96mi |
| 250 S Paseo Laredo Cathedral City, CA | 2.0 | 2.0 | 1600 | $1,800 | $1.12 | 12d | 1 | 0.99mi |
| 251 S Paseo Laredo Cathedral City, CA | 2.0 | 2.0 | 1440 | $2,400 | $1.67 | 43d | 1 | 1.01mi |
| 415 Forest Hills Dr Rancho Mirage, CA | 2.0 | 2.0 | 1535 | $3,300 | $2.15 | 43d | 1 | 1.03mi |
| 343 Forest Hills Dr Rancho Mirage, CA | 2.0 | 2.0 | 1535 | $4,500 | $2.93 | 43d | 1 | 1.03mi |
| 343 Forest Hills Dr Rancho Mirage, CA | 2.0 | 2.0 | 1535 | $4,500 | $2.93 | 18d | 1 | 1.03mi |
| 69646 Antonia Way Rancho Mirage, CA | 2.0 | 2.0 | 966 | $2,450 | $2.54 | 18d | 1 | 1.08mi |
| 436 Sunningdale Dr Rancho Mirage, CA | 2.0 | 2.0 | 1535 | $4,000 | $2.61 | 43d | 1 | 1.09mi |
| 34361 Denise Way Rancho Mirage, CA | 3.0 | 2.0 | 1400 | $2,800 | $2.00 | 43d | 1 | 1.10mi |
| 426 Forest Hills Dr Rancho Mirage, CA | 2.0 | 2.0 | 1535 | $3,600 | $2.35 | 24d | 1 | 1.13mi |
| 69603 Heather Way Rancho Mirage, CA | 3.0 | 2.0 | 1218 | $2,300 | $1.89 | 43d | 1 | 1.14mi |
| 34071 Denise Way Rancho Mirage, CA | 3.0 | 2.0 | 1218 | $2,599 | $2.13 | 24d | 1 | 1.20mi |
| 34073 Emily Way Rancho Mirage, CA | 2.0 | 2.0 | 966 | $2,100 | $2.17 | 18d | 1 | 1.23mi |
| 34073 Emily Way Rancho Mirage, CA | 2.0 | 2.0 | 966 | $2,100 | $2.17 | 22d | 1 | 1.23mi |
| 69200 Nilda Dr Cathedral City, CA | 3.0 | 2.0 | 1330 | $2,495 | $1.88 | 22d | 1 | 1.25mi |
| 34750 Marcia Rd Unit 02 Cathedral City, CA | 3.0 | 2.0 | 1325 | $2,000 | $1.51 | 18d | 1 | 1.33mi |
| 159 Estrada Way Cathedral City, CA | 3.0 | 2.0 | 1800 | $2,850 | $1.58 | 43d | 1 | 1.34mi |
| 152 Estrada Way #152 Cathedral City, CA | 2.0 | 2.0 | 1500 | $2,200 | $1.47 | 43d | 1 | 1.35mi |
| 54 Pine Valley Dr Rancho Mirage, CA | 3.0 | 2.0 | 1620 | $5,000 | $3.09 | 43d | 1 | 1.39mi |
| 69180 Victoria Dr #8 Cathedral City, CA | 3.0 | 2.0 | 1230 | $1,995 | $1.62 | 3d | 1 | 1.44mi |
| 38 Pine Valley Dr Rancho Mirage, CA | 2.0 | 2.0 | 1620 | $6,500 | $4.01 | 43d | 1 | 1.45mi |
HOA detail condo
- Monthly dues
- $775 · $9,300/yr
- Likely covers
- pool
- Assessments
- None detected in remarks — confirm with the listing agent.
Listing history 11 events
-
2026-04-02status Pending
-
2026-03-23price $299,000
-
2026-02-21price $309,000
-
2025-12-19$329,000 Active
-
2015-09-22soldstatus $189,000
-
2015-09-21soldstatus $189,000 Sold 321-char remark
Show marketing remark (321 chars)
The price reduction!! The seller is motivated. This condo has a great floor plan and the golf course view from the condo is fantastic. You can upgrade to your own taste to make your living wonderful. The community pools and spas are within walking distance. The owners only used it once a year. The furniture is included.
-
2015-08-24status Pending 321-char remark
Show marketing remark (321 chars)
The price reduction!! The seller is motivated. This condo has a great floor plan and the golf course view from the condo is fantastic. You can upgrade to your own taste to make your living wonderful. The community pools and spas are within walking distance. The owners only used it once a year. The furniture is included.
-
2015-07-08historical Contingent 321-char remark
Show marketing remark (321 chars)
The price reduction!! The seller is motivated. This condo has a great floor plan and the golf course view from the condo is fantastic. You can upgrade to your own taste to make your living wonderful. The community pools and spas are within walking distance. The owners only used it once a year. The furniture is included.
-
2015-06-16price $199,900 321-char remark
Show marketing remark (321 chars)
The price reduction!! The seller is motivated. This condo has a great floor plan and the golf course view from the condo is fantastic. You can upgrade to your own taste to make your living wonderful. The community pools and spas are within walking distance. The owners only used it once a year. The furniture is included.
-
2014-10-24price $229,000 321-char remark
Show marketing remark (321 chars)
The price reduction!! The seller is motivated. This condo has a great floor plan and the golf course view from the condo is fantastic. You can upgrade to your own taste to make your living wonderful. The community pools and spas are within walking distance. The owners only used it once a year. The furniture is included.
-
2014-08-16$239,000 Active 321-char remark
Show marketing remark (321 chars)
The price reduction!! The seller is motivated. This condo has a great floor plan and the golf course view from the condo is fantastic. You can upgrade to your own taste to make your living wonderful. The community pools and spas are within walking distance. The owners only used it once a year. The furniture is included.
ⓘ Source: listings_history table (triggers on properties + properties_extension) + one-shot
backfill from property_details.listing_events for pre-trigger history.
Tax reassessment forecast CA · Resets to sale price
- Current annual tax
- $3,460 · $288/mo
- Projected year-2 tax
- $3,460 · $288/mo
- Expected delta
- $0/yr ($0/mo · 0.0%)
ⓘ Screening estimate from a state-policy table — verify with the county assessor before closing.
Climate risk First Street
- Flood 1/10 Low FEMA zone X (unshaded) · 0% chance over 30 yrs
- Wildfire 3/10 Moderate
- Heat 9/10 Extreme 7 d/yr ≥113°F today · 19 d/yr by 30 yrs out
- Wind 1/10 Low
- Air quality 4/10 Moderate 5 unhealthy d/yr today · 7 by 30 yrs out
Nearby sold comps map
Loading sold comps map…
Walkable amenities ~0.75 mi
Loading nearby amenities…
Taxation est. · year 1
- Rental income
- $47,701
- − Mortgage interest
- −$16,749
- − Property taxes
- −$3,460
- − Insurance
- −$1,495
- − Repairs & maintenance
- −$3,816
- − Management
- −$3,816
- − HOA
- −$9,300
- − Depreciation
- −$8,698
- Taxable income
- $367
- Est. tax owed @ 24.0%
- −$88
- After-tax cash flow
- $4,525/yr
For passive investors: Depreciation is non-cash, so a rental often shows a tax loss while cash-flowing — sheltering income. Rental losses are passive: they offset passive income freely, and up to $25,000/yr can offset ordinary (W-2) income if you actively participate and your MAGI is under $100k (phasing out to $0 by $150k); unused losses carry forward. On sale, claimed depreciation is recaptured at up to 25%, and gains may owe capital-gains tax (a 1031 exchange can defer both). Figures are a year-1 estimate at your 24.0% rate — not tax advice; consult a CPA.
Schools (NCES district)
- District
- Palm Springs Unified
- NCES district ID
- 0629550
- Math proficiency
- 21% ▼ -7.00%
- Reading proficiency
- 42% ▬ 0.00%
- Median HH income
- $43,638
- Composite
- 26.76/100
- National rank
- #7131
- State rank
- #328 of 517 in CA
Livability — Rancho Mirage
- Score
- 51/100
- State rank
- #1065
- US rank
- #25255
Category grades
Schools grade is shown separately in the Schools card above.
Census & demographics
- Census place
- Rancho Mirage, CA
- County
- Riverside County · 2,287,001 people
- City population
- 17,563
- Metro
- Riverside-San Bernardino-Ontario, CA
- Population (ZIP)
- 17,563
- Household income
- $107,364
- Rent vs Own
- Severe rent burden
- 498.0
Population outlook (Riverside County) Hauer SSP2
- Today (2025)
- 2,664,475 people
- By 2030
- 2,802,692 · +5.2%
- By 2040
- 3,050,904 · +14.5%
- By 2050
- 3,256,783 · +22.2%
- By 2075
- 3,655,058 · +37.2%
- By 2100
- 3,766,594 · +41.4%
Race, ethnicity, and origin ACS 2023
- Neighborhood character
- Predominantly White (77%)
- Race & ethnicity
- White 77% Hispanic / Latino 15% Two or more races 6% Asian 4% Black 2%
- Hispanic origin (detail)
- Mexican 12%
- Common ancestry
- Slovak 4% Romanian 3% Lithuanian 3%
- Foreign-born
- 17% · Canada, South Korea, China
- Languages at home
- 81% English-only · Spanish 11% Other Indo-European 3% French/Haitian/Cajun 1%
Political lean MEDSL · Riverside
- 2024 margin
- Toss-up / Even · D 48.0% · R 49.3% · Other 2.6%
- 2008→2024 swing
- -3.6pp toward R · 2008: 2.3pp · 2024: -1.3pp
- All cycles
- 2024: R+1.3 2020: D+8.0 2016: D+4.3 2012: R+0.4 2008: D+2.3
Not yet ingested
- Civics
- —
Market trends
- HPI YoY
- ▼ -210.99%
- Current HPI
- 282.2957
- Rent YoY
- ▲ 3.72%
- Metro
- Riverside-San Bernardino-Ontario, CA
- State GDP YoY
- ▲ 3.21%
- F500 in state
- 116
Industry mix (Fortune 500 HQ in CA)
| Industry | F500 HQs | Revenue |
|---|---|---|
| Technology | 27 | $1,492B |
|
||
| Financial Services | 3 | $174B |
|
||
| Retail | 3 | $44B |
|
||
| Insurance | 3 | $26B |
|
||
| Media / Entertainment | 2 | $115B |
|
||
| Pharmaceuticals / Biotech | 2 | $62B |
|
||
Price history
+25.1% since first listed11 events — show timeline
- 2026-04-02 Pending — GPSMLS
- 2026-03-23 Price Changed $299,000 GPSMLS
- 2026-02-21 Price Changed $309,000 GPSMLS
- 2025-12-19 Listed $329,000 GPSMLS
- 2015-09-22 Sold (Public Records) $189,000 Public Records
- 2015-09-21 Sold (MLS) $189,000 GPSMLS
- 2015-08-24 Pending — GPSMLS
- 2015-07-08 Contingent — GPSMLS
- 2015-06-16 Price Changed $199,900 GPSMLS
- 2014-10-24 Price Changed $229,000 GPSMLS
- 2014-08-16 Listed $239,000 GPSMLS
Property tax history
+0.8%/yrLatest (2025): $3,460 · -0.5% YoY. Source: county tax records.
Cash-flow waterfall
monthlySold comps — $/sqft
last 12 mo · ≤1 miLoading sold comps…