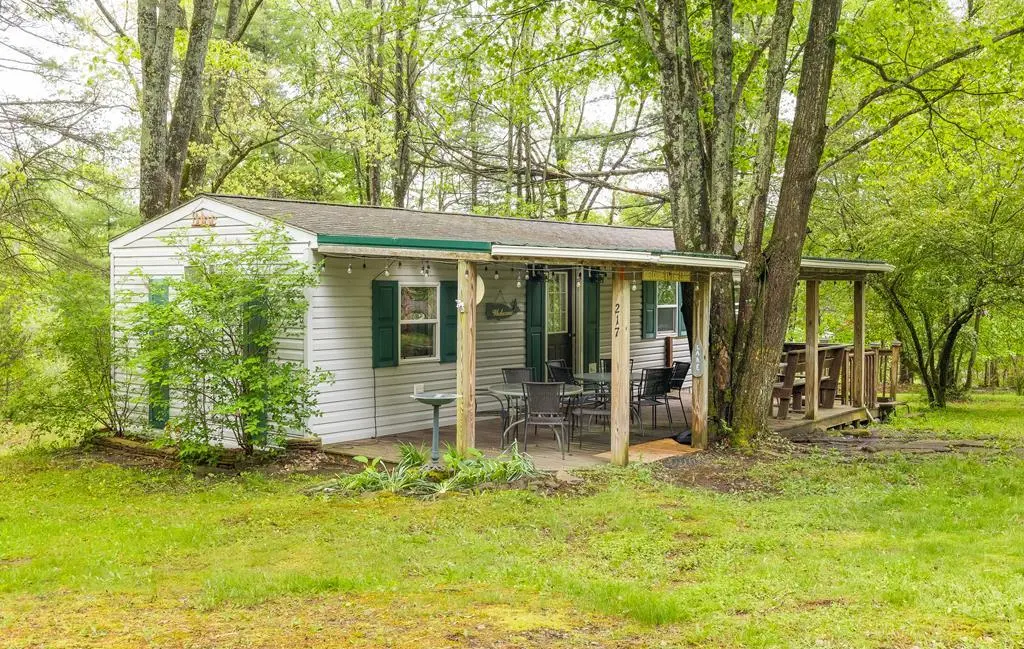
217 S Lake Dr · East Smithfield, PA
Flood risk 1/10 · Minimal
- FEMA flood zone
- X (unshaded)
- Chance of flooding over 30 yrs
- 0.0%
- Est. flood insurance / yr
- $507 – $1,088
Fire risk 3/10 · Minor
- Est. fire insurance / yr
- $511 – $949
Heat risk 2/10 · Minimal
- Hot days now (above 93°F)
- 7 days/yr
- Hot days in 30 yrs
- 15 days/yr
Wind risk 2/10 · Minimal
- Chance of severe wind over 30 yrs
- 2.0%
Air-quality risk 1/10 · Minimal
- Unhealthy air days now
- 0 days/yr
- Unhealthy air days in 30 yrs
- 0 days/yr
Risk factors via First Street. Map © Google.
Why this score? — see what drove the C- grade
The composite is a weighted blend of 9 inputs, each scored 0–100. Each bar is that input's sub-score; the figure is the points it added to the 100-point composite (weight × sub-score).
- Cash flow +17.5/30.0
- Appreciation +7.9/10.0
- ARV discount +7.5/15.0
- DSCR +5.4/10.0
- 1% rule +3.6/10.0
- Schools +2.9/10.0
- Rent growth +2.5/5.0
- Livability +2.5/5.0
- Condition / age +2.5/5.0
$99,900
🖨 Deal sheet 📄 Offer letter ✓ Due diligence
Listing remarks
Rare Opportunity Near Beautiful Lake Ondawa in Bradford Co, PA! Nestled just around the bend from picturesque Lake Ondawa, this charming & fully furnished two-bedroom cabin offers the perfect getaway or year-round retreat. Situated on 0.72 acres, the property combines rustic charm with comfort and convenience. Inside, you'll find a cozy, move-in-ready interior complete with furnishings and a versatile Murphy bed for additional sleeping space. Relax and enjoy the peaceful surroundings from the covered front porch, ideal for morning coffee or after a day at the lake, unwind in the peaceful outdoor setting & enjoy the property's fireside circle perfect for stories and sharing memor
Key facts
- Covered front porch
- Fireside circle
- Murphy bed
Tags
Property features AI
Exterior
- Utilities: Well water (private)
- Home design: Single-family residential property
- Construction: Vinyl siding
- Exterior features: Shingle roof
Interior
- Bedrooms: 1 full bathroom
- Bathrooms: 1 full bathroom
- Heating & cooling: Electric heating
- Interior features: Electric water heater; Total of 4 rooms
Neighborhood map
What this means for you Summary
Snapshot
- This is a 2-bed/1.0-bath other listed at $100k.
Deal economics
- At list price, monthly cash flow is $76 ($911/yr) — positive.
- The deal already cash-flows at list — no discount required.
- To meet the 1% rule (rent ≥ 1% of price), the offer needs to be $86k (13.8% below list).
- Recommended offer: $86k (13.8% below list) — sets the bar for 1% rule.
Location & tenants
- Location reads: area grade C — affects rentability + tenant quality, not the cash-flow math above.
- Troy Area SD (rural): math 19% / reading 48% proficiency, ranked #427 of 539 in PA (top 79%) — families likely to look elsewhere, expect single-tenant / working-renter base with shorter leases.
- Market conditions: 8 active listings in the ZIP; 66 units permitted in Bradford County in 2024 (0 in 5+ unit buildings).
Forward outlook
- In year one you build about $6k of equity ($691 loan paydown + $6k appreciation (5.7% local appreciation)).
- Bradford County population projected at -23% by 2050 — secular population decline; favor cash flow + early exit over multi-decade hold.
- At projected returns (5.7% appreciation + 3.0% rent growth), your $28k cash investment doubles in ~4 years — after that, you're playing with house money.
- By year 6, paydown + projected appreciation supports a ~$35k cash-out refi (75% LTV) — recoverable capital for the next deal without selling this one.
Negotiation context
- Only 5 days on market — expect competitive offers; lowballing is unlikely to land.
Questions for the listing agent
- Is there a deadline driving the sale (1031 exchange, divorce, estate, relocation)? That informs how much negotiation room exists.
- What's the average days-on-market for RENTAL listings here right now (not sales)? A rising rental-DOM trend means longer vacancies and softer asking-rent achievability than the comps imply.
- What's the recent tenant-quality profile in this submarket — average credit score on applications, eviction rate, late-payment / NSF rate, and stable-employment percentage? A property-management company in the area should have these aggregated.
- How much new for-sale + rental construction is in the pipeline within 1–3 miles? Heavy new supply typically softens prices + rents 12–24 months out; constrained supply supports both.
Investment metrics
- 1% rule
- 0.86% ✗
- Cap rate
- 7.20%
- Cash-on-cash
- 3.26%
- DSCR
- 1.14
- GRM
- 9.7
CMA / ARV
No comps found within radius.
Projected returns pro-forma
5.71% appreciation · 3.0% rent growth · sell at horizon
- IRR
- 17.3%
- Equity multiple
- 2.14×
- Total profit
- $31,900
- Equity at exit
- $60,951
- IRR
- 17.2%
- Equity multiple
- 4.23×
- Total profit
- $90,455
- Equity at exit
- $108,969
Cash invested: $27,972 (down + closing). Projections, not guarantees.
Landlord ↔ Tenant lean methodology
- Overall (STATE)
- 62 Landlord-Friendly
- State Pennsylvania
- 62 Landlord-Friendly · EVEN
- County
- — inherits STATE
- City
- — inherits STATE
ZIP-level market 16914
- Home prices YoY
- 3.0%
- Active inventory
- 8
- Price-to-rent
- 9.7×
Monthly cashflow live
- Estimated rent
- $861 medium interval (Pro) →
- Mortgage (P&I)
- −$524
- Tax from tax record
- −$39 /mo · $463/yr
- Insurance
- −$42
- HOA
- −$0
- Vacancy / Maint / Mgmt
- −$181
- Net cashflow
- $76
Break-even live
UW: 25.0% down · 7.5% · 30yr · 1.5% tax · 5.0% vac · 8.0% maint · 8.0% mgmt
Financing live
Cash to close
- Down payment
- $24,975
- Closing costs
- $2,997
- Reserves months
- —
- Total cash needed
- —
Loan-product check · same deal, 3 products live
Conventional
25% down · 7.5% · 30yr
- Down + closing
- —
- Monthly P&I
- —
- Monthly cashflow
- —
- DSCR
- —
- Eligible?
- —
Personal DTI + credit; lowest rate.
DSCR
20% down · 8.5% · 30yr
- Down + closing
- —
- Monthly P&I
- —
- Monthly cashflow
- —
- DSCR
- —
- Eligible?
- —
No personal income docs; deal must DSCR.
Hard money
10% down · 12.0% · 12mo
- Down + closing
- —
- Monthly P&I
- —
- Monthly cashflow
- —
- DSCR
- —
- Eligible?
- —
Short-term bridge; refi at stabilization.
Listing history 5 events
-
2026-06-04statusdays on market $99,900 Pending 5 DOM
-
2026-06-02days on market $99,900 Active 4 DOM
-
2026-06-01days on market $99,900 Active 3 DOM
-
2026-05-31days on market $99,900 Active 2 DOM
-
2026-05-29$99,900 Active
ⓘ Source: listings_history table (triggers on properties + properties_extension) + one-shot
backfill from property_details.listing_events for pre-trigger history.
Tax reassessment forecast PA · Partial reset (capped growth)
- Current annual tax
- $463 · $39/mo
- Projected year-2 tax
- $1,021 · $85/mo
- Expected delta
- +$558/yr (+$46/mo · 120.3%)
ⓘ Screening estimate from a state-policy table — verify with the county assessor before closing.
Climate risk First Street
- Flood 1/10 Low FEMA zone X (unshaded) · 0% chance over 30 yrs
- Wildfire 3/10 Moderate
- Heat 2/10 Low 7 d/yr ≥93°F today · 15 d/yr by 30 yrs out
- Wind 2/10 Low 2% chance of damaging wind over 30 yrs
- Air quality 1/10 Low 0 unhealthy d/yr today · 0 by 30 yrs out
Nearby sold comps map
Loading sold comps map…
Walkable amenities ~0.75 mi
Loading nearby amenities…
Taxation est. · year 1
- Rental income
- $10,330
- − Mortgage interest
- −$5,596
- − Property taxes
- −$463
- − Insurance
- −$500
- − Repairs & maintenance
- −$826
- − Management
- −$826
- − Depreciation
- −$2,906
- Taxable loss
- −$788
- Est. tax savings @ 24.0%
- +$189
- After-tax cash flow
- $1,100/yr
For passive investors: Depreciation is non-cash, so a rental often shows a tax loss while cash-flowing — sheltering income. Rental losses are passive: they offset passive income freely, and up to $25,000/yr can offset ordinary (W-2) income if you actively participate and your MAGI is under $100k (phasing out to $0 by $150k); unused losses carry forward. On sale, claimed depreciation is recaptured at up to 25%, and gains may owe capital-gains tax (a 1031 exchange can defer both). Figures are a year-1 estimate at your 24.0% rate — not tax advice; consult a CPA.
Schools (NCES district)
- District
- Troy Area SD
- NCES district ID
- 4223790
- Math proficiency
- 19% ▼ -21.00%
- Reading proficiency
- 48% ▼ -14.00%
- Median HH income
- $46,987
- Composite
- 28.7/100
- National rank
- #6690
- State rank
- #427 of 539 in PA
Livability — East Smithfield
No livability data for this city. (Only ~50 U.S. cities are tracked.)
Census & demographics
- City population
- 169
- Population (ZIP)
- 2,415
Population outlook (Bradford County) Hauer SSP2
- Today (2025)
- 57,236 people
- By 2030
- 54,660 · -4.5%
- By 2040
- 49,502 · -13.5%
- By 2050
- 44,277 · -22.6%
- By 2075
- 33,420 · -41.6%
- By 2100
- 22,919 · -60.0%
Race, ethnicity, and origin ACS 2023
- Neighborhood character
- Predominantly White (95%)
- Race & ethnicity
- White 95% Two or more races 2%
- Common ancestry
- Romanian 3% Scottish 2% Scotch-Irish 2%
- Foreign-born
- 1% · Canada
- Languages at home
- 98% English-only · German/W. Germanic 1% Spanish 1%
Political lean MEDSL · Bradford
- 2024 margin
- Solid R (+47.9) · D 25.6% · R 73.5%
- 2008→2024 swing
- -29.5pp toward R · 2008: -18.4pp · 2024: -47.9pp
- All cycles
- 2024: R+47.9 2020: R+44.9 2016: R+46.0 2012: R+24.6 2008: R+18.4
Not yet ingested
- Civics
- —
Market trends
- HPI YoY
- ▲ 5.71%
- Current HPI
- 195.9402
- Rent YoY
- —
- Metro
- —
- State GDP YoY
- ▲ 1.68%
- F500 in state
- 34
Industry mix (Fortune 500 HQ in PA)
| Industry | F500 HQs | Revenue |
|---|---|---|
| Healthcare | 2 | $309B |
|
||
| Insurance | 2 | $27B |
|
||
| Telecommunications / Media | 1 | $124B |
|
||
| Industrial Distribution | 1 | $22B |
|
||
| Financial Services | 1 | $20B |
|
||
| Chemicals / Materials | 1 | $18B |
|
||
Price history
1 event — show timeline
- 2026-05-29 Listed $99,900 NMPA
Property tax history
+7.3%/yrLatest (2026): $463 · +4.9% YoY. Source: county tax records.
Cash-flow waterfall
monthlySold comps — $/sqft
last 12 mo · ≤1 miLoading sold comps…