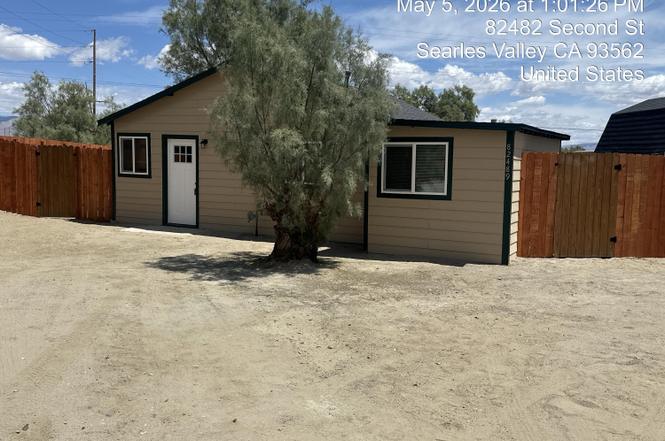
82489 2nd St · Searles Valley, CA
Flood risk 1/10 · Minimal
- FEMA flood zone
- X (unshaded)
- Chance of flooding over 30 yrs
- 0.0%
- Est. flood insurance / yr
- $507 – $1,088
Fire risk 3/10 · Minor
- Est. fire insurance / yr
- $659 – $1,223
Heat risk 8/10 · Major
- Hot days now (above 107°F)
- 7 days/yr
- Hot days in 30 yrs
- 19 days/yr
Wind risk 1/10 · Minimal
- Chance of severe wind over 30 yrs
- —
Air-quality risk 4/10 · Minor
- Unhealthy air days now
- 4 days/yr
- Unhealthy air days in 30 yrs
- 5 days/yr
Risk factors via First Street. Map © Google.
Why this score? — see what drove the C- grade
The composite is a weighted blend of 9 inputs, each scored 0–100. Each bar is that input's sub-score; the figure is the points it added to the 100-point composite (weight × sub-score).
- Cash flow +18.7/30.0
- ARV discount +7.5/15.0
- DSCR +5.9/10.0
- Appreciation +5.0/10.0
- 1% rule +3.7/10.0
- Livability +3.1/5.0
- Schools +3.0/10.0
- Rent growth +2.5/5.0
- Condition / age +2.5/5.0
$109,000
🖨 Deal sheet (PDF) 📄 Offer letter ✓ Due diligence
Listing remarks MLS
Perfectly renovated 3 bedroom 2 bath home ready for it's new owners. Positioned perfectly on a fully fenced corner lot this home has it all. New roof, doors, dual pane windows, new flooring, new kitchen cabinets, counters, and all appliances, make this a must see. Wood style tile floors throughout make maintenance a breeze. Primary suite features full bathroom and ample closet space. Additional full bathroom with stacked washer dryer hookups can be found just off the kitchen, The 3rd bedroom has access to backyard. New Central Heat and A/C make this comfortable year round living. The front yard has ample room for all your desert toys. If you want turn key, ready to go, nothing needed but your belongings this is the home for you.
Key facts
- 7,000 sq ft lot
- Garage
- Built 1935
Property features AI
Finance
- Other: Sale terms: Conventional, VA, FHA, Cash; Possession at close of escrow; Will consider lease
- HOA & community: No monthly association fee; Not in a gated community; PUD: No
Exterior
- Parking: Driveway parking; 10 total parking spaces (all uncovered/assigned)
- Security: No security features
- Utilities: Septic tank; Fee simple land
- Home design: Single-family residence; Attached; One story; Entry level: One; Composition shingle roof; Facing direction: Not specified
- Construction: Built (year sourced from assessor); Slab foundation; Composition shingle construction
- Exterior features: Corner lot; Wood fencing; No security system
Interior
- Kitchen: Remodeled kitchen; Refrigerator; Gas range; Microwave oven
- Flooring: Tile flooring
- Bathrooms: 2 full bathrooms
- Heating & cooling: Central heating; Natural gas heat; Air conditioning
- Interior features: Unfurnished; Updated/remodeled interior; Living room
- Laundry & utility: Stackable washer/dryer hookup
Neighborhood map
What this means for you Summary
Snapshot
- This is a 2-bed/1.0-bath single-family listed at $109k.
Deal economics
- At list price, monthly cash flow is $107 ($1k/yr) — positive.
- The deal already cash-flows at list — no discount required.
- To meet the 1% rule (rent ≥ 1% of price), the offer needs to be $95k (12.8% below list).
- Recommended offer: $95k (12.8% below list) — sets the bar for 1% rule.
Location & tenants
- Location reads 62/100 on livability (#500 in CA) — a middle-class / working-renter tenant base. Strengths: cost of living A+, housing A+, crime B; Watch: health & safety C-, amenities F, commute F.
- Trona Joint Unified (rural): math 25% / reading 40% proficiency, ranked #1,004 of 1,400 in CA (top 72%) — families likely to look elsewhere, expect single-tenant / working-renter base with shorter leases; 61% free/reduced lunch — lower-income household profile, screen leases tightly.
- Zoned schools: Trona Elementary (math 12% / reading 22%, grade F, #1,340 of 1,571 statewide, top 88%, 131 students, 71% FRL); Trona High (math 5% / reading 34%, grade F, #987 of 1,170 statewide, top 86%, 116 students, 76% FRL).
- Zoned-school proficiency averages 18% at this address vs 32% district-wide (-14 pts) — the specific schools serving this property underperform the Trona Joint Unified average; the district grade overstates school quality for this exact location.
- Market conditions: 55 active listings in the ZIP; 2 comparable units currently listed for rent nearby; 5,458 units permitted in San Bernardino County in 2024 (1,500 in 5+ unit buildings).
Forward outlook
- In year one you build about $4k of equity ($754 loan paydown + $3k appreciation (3.0% local appreciation)).
- San Bernardino County population projected at +15% by 2050 — modest demand growth; plan on rents tracking national, not racing it.
- At projected returns (3.0% appreciation + 3.0% rent growth), your $31k cash investment doubles in ~5 years — after that, you're playing with house money.
- By year 9, paydown + projected appreciation supports a ~$34k cash-out refi (75% LTV) — recoverable capital for the next deal without selling this one.
Negotiation context
- It's been on market 42 days — a 3% lower offer ($106k) is reasonable based on typical stale-listing flexibility.
- 3 sale attempts since 2y ago with the ask held roughly flat each time — persistent listings suggest the price (not the market) is what's stuck; bring a comps-based counter.
- Current owner paid $37k; list at $109k implies a 193% gain — meaningful room to come down on a strong offer.
Risks & watch-outs
- Watch-outs: built in 1935 — expect roof / HVAC / electrical / plumbing capex.
Questions for the listing agent
- It's been on market 42 days. Have you received any prior offers? Is the seller open to a 13% concession, seller financing, or rate buy-down credit?
- Built in 1935 — when were the roof, HVAC, electrical panel, plumbing, and water heater last replaced?
- Is there a deadline driving the sale (1031 exchange, divorce, estate, relocation)? That informs how much negotiation room exists.
- Schools are F-rated, which usually means shorter tenancies and higher turnover. Who's the typical renter profile here, and what's been the actual vacancy rate?
- What's the average days-on-market for RENTAL listings here right now (not sales)? A rising rental-DOM trend means longer vacancies and softer asking-rent achievability than the comps imply.
- What's the recent tenant-quality profile in this submarket — average credit score on applications, eviction rate, late-payment / NSF rate, and stable-employment percentage? A property-management company in the area should have these aggregated.
- How much new for-sale + rental construction is in the pipeline within 1–3 miles? Heavy new supply typically softens prices + rents 12–24 months out; constrained supply supports both.
Investment metrics
- 1% rule
- 0.87% ✗
- Cap rate
- 7.47%
- Cash-on-cash
- 4.20%
- DSCR
- 1.19
- GRM
- 9.6
CMA / ARV
- ARV (median comp)
- $17,300
- List price
- $109,000
- Delta
- 530.06%
- Verdict
- OVERPRICED
- Comps
- 7 within 1.0 mi
Show comp detail 2 sales within ~0.75 mi
| Address | Dist | Beds/Ba | Sqft | Sold | Price | $/sf | Match |
|---|---|---|---|---|---|---|---|
| 12168 B St | 0.57mi | 1/1.0 (-1) | 739 (-9%) | 19mo | $20,000 | $27 | 37 |
| 12331 Beech | 0.72mi | 3/1.0 (+1) | 925 (+14%) | 3mo | $17,300 | $19 | 36 |
Match score weights: distance 35% · size 25% · config 20% · recency 20%. Top-matched comps best support the ARV.
Projected returns pro-forma
3.0% appreciation · 3.0% rent growth · sell at horizon
- IRR
- 11.4%
- Equity multiple
- 1.65×
- Total profit
- $19,887
- Equity at exit
- $49,011
- IRR
- 13.5%
- Equity multiple
- 3.01×
- Total profit
- $61,198
- Equity at exit
- $75,532
Cash invested: $30,520 (down + closing). Projections, not guarantees.
Landlord ↔ Tenant lean methodology
- Overall (STATE)
- 18 Strongly Tenant-Friendly
- State California
- 18 Strongly Tenant-Friendly · D+13
- County
- — inherits STATE
- City
- — inherits STATE
ZIP-level market 93562
- Active inventory
- 55
- Price-to-rent
- 9.6×
Monthly cashflow live
- Estimated rent
- $951 medium interval (Pro) →
- Mortgage (P&I)
- −$572
- Tax from tax record
- −$27 /mo · $324/yr
- Insurance
- −$45
- HOA
- −$0
- Vacancy / Maint / Mgmt
- −$200
- Net cashflow
- $107
Break-even live
Sensitivity live
| Price | -10% $169 | -5% $138 | +0% $107 | +5% $76 | +10% $45 |
|---|---|---|---|---|---|
| Rent | -10% $32 | -5% $69 | +0% $107 | +5% $144 | +10% $182 |
| Rate | -1.0pp $162 | -0.5pp $135 | base $107 | +0.5pp $79 | +1.0pp $50 |
UW: 25.0% down · 7.5% · 30yr · 1.5% tax · 5.0% vac · 8.0% maint · 8.0% mgmt
Financing live
Cash to close
- Down payment
- $27,250
- Closing costs
- $3,270
- Reserves months
- —
- Total cash needed
- —
Loan-product check · same deal, 3 products live
Conventional
25% down · 7.5% · 30yr
- Down + closing
- —
- Monthly P&I
- —
- Monthly cashflow
- —
- DSCR
- —
- Eligible?
- —
Personal DTI + credit; lowest rate.
DSCR
20% down · 8.5% · 30yr
- Down + closing
- —
- Monthly P&I
- —
- Monthly cashflow
- —
- DSCR
- —
- Eligible?
- —
No personal income docs; deal must DSCR.
Hard money
10% down · 12.0% · 12mo
- Down + closing
- —
- Monthly P&I
- —
- Monthly cashflow
- —
- DSCR
- —
- Eligible?
- —
Short-term bridge; refi at stabilization.
Rent comps 2 comps
| Address | Beds | Baths | Sqft | Rent | $/sqft | DOM | Units | Dist |
|---|---|---|---|---|---|---|---|---|
| 12168 B St Trona, CA | 2.0 | 1.0 | 739 | $1,000 | $1.35 | 45d | 1 | 0.60mi |
| 13350 Aster St Trona, CA | 2.0 | 1.0 | 720 | $825 | $1.15 | 45d | 1 | 1.47mi |
Listing history 22 events
-
2026-06-19status $109,000 Pending 42 DOM
-
2026-06-18days on market $109,000 Active Under Contract 42 DOM
-
2026-06-17days on market $109,000 Active Under Contract 41 DOM
-
2026-06-16days on market $109,000 Active Under Contract 40 DOM
-
2026-06-15days on market $109,000 Active Under Contract 39 DOM
-
2026-06-14days on market $109,000 Active Under Contract 37 DOM
-
2026-06-13days on market $109,000 Active Under Contract 36 DOM
-
2026-06-10days on market $109,000 Active Under Contract 34 DOM
-
2026-06-09days on market $109,000 Active Under Contract 33 DOM
-
2026-06-08days on market $109,000 Active Under Contract 32 DOM
-
2026-06-07days on market $109,000 Active Under Contract 31 DOM
-
2026-06-05days on market $109,000 Active Under Contract 28 DOM
-
2026-06-03days on market $109,000 Active Under Contract 27 DOM
-
2026-06-03days on market $109,000 Active Under Contract 26 DOM
-
2026-06-01days on market $109,000 Active Under Contract 25 DOM
-
2026-05-31days on market $109,000 Active Under Contract 24 DOM
-
2026-05-07$109,000 Active 738-char remark
Show marketing remark (738 chars)
Perfectly renovated 3 bedroom 2 bath home ready for it's new owners. Positioned perfectly on a fully fenced corner lot this home has it all. New roof, doors, dual pane windows, new flooring, new kitchen cabinets, counters, and all appliances, make this a must see. Wood style tile floors throughout make maintenance a breeze. Primary suite features full bathroom and ample closet space. Additional full bathroom with stacked washer dryer hookups can be found just off the kitchen, The 3rd bedroom has access to backyard. New Central Heat and A/C make this comfortable year round living. The front yard has ample room for all your desert toys. If you want turn key, ready to go, nothing needed but your belongings this is the home for you.
-
2025-01-30soldstatus $37,200 Sold
Show marketing remark (99 chars)
SELLER FINANCING AVAILABLE Seller Financing enabling monthly payments with 5-10-15 year loan terms.
-
2024-10-16$37,200 Active
Show marketing remark (99 chars)
SELLER FINANCING AVAILABLE Seller Financing enabling monthly payments with 5-10-15 year loan terms.
-
1992-11-17soldstatus $10,000
-
1979-04-12soldstatus $14,500
ⓘ Source: listings_history table (triggers on properties + properties_extension) + one-shot
backfill from property_details.listing_events for pre-trigger history.
Tax reassessment forecast CA · Resets to sale price
- Current annual tax
- $324 · $27/mo
- Projected year-2 tax
- $828 · $69/mo
- Expected delta
- +$505/yr (+$42/mo · 155.9%)
ⓘ Screening estimate from a state-policy table — verify with the county assessor before closing.
Climate risk First Street
- Flood 1/10 Low FEMA zone X (unshaded) · 0% chance over 30 yrs
- Wildfire 3/10 Moderate
- Heat 8/10 Severe 7 d/yr ≥107°F today · 19 d/yr by 30 yrs out
- Wind 1/10 Low
- Air quality 4/10 Moderate 4 unhealthy d/yr today · 5 by 30 yrs out
Nearby sold comps map
Loading sold comps map…
Walkable amenities ~0.75 mi
Loading nearby amenities…
Taxation est. · year 1
- Rental income
- $11,406
- − Mortgage interest
- −$6,106
- − Property taxes
- −$324
- − Insurance
- −$545
- − Repairs & maintenance
- −$912
- − Management
- −$912
- − Depreciation
- −$3,171
- Taxable loss
- −$564
- Est. tax savings @ 24.0%
- +$135
- After-tax cash flow
- $1,418/yr
For passive investors: Depreciation is non-cash, so a rental often shows a tax loss while cash-flowing — sheltering income. Rental losses are passive: they offset passive income freely, and up to $25,000/yr can offset ordinary (W-2) income if you actively participate and your MAGI is under $100k (phasing out to $0 by $150k); unused losses carry forward. On sale, claimed depreciation is recaptured at up to 25%, and gains may owe capital-gains tax (a 1031 exchange can defer both). Figures are a year-1 estimate at your 24.0% rate — not tax advice; consult a CPA.
Schools (NCES district)
- District
- Trona Joint Unified
- NCES district ID
- 0639840
- Math proficiency
- 25% ▲ 5.00%
- Reading proficiency
- 40% ▲ 5.00%
- Median HH income
- $35,514
- Composite
- 29.6/100
- National rank
- #11751
- State rank
- #1004 of 1400 in CA
Livability — Searles Valley
- Score
- 62/100
- State rank
- #500
- US rank
- #16976
Category grades
Schools grade is shown separately in the Schools card above.
Census & demographics
- Census place
- Searles Valley, CA
- Population (ZIP)
- 1,822
Population outlook (San Bernardino County) Hauer SSP2
- Today (2025)
- 2,300,329 people
- By 2030
- 2,378,907 · +3.4%
- By 2040
- 2,523,137 · +9.7%
- By 2050
- 2,642,388 · +14.9%
- By 2075
- 2,880,769 · +25.2%
- By 2100
- 2,909,436 · +26.5%
Race, ethnicity, and origin ACS 2023
- Neighborhood character
- Predominantly White (65%)
- Race & ethnicity
- White 65% Hispanic / Latino 22% Two or more races 14% Black 2% Native American 2% Asian 1%
- Hispanic origin (detail)
- Mexican 16% Cuban 2%
- Common ancestry
- Italian 6% Slovak 2% Russian 1%
- Foreign-born
- 2% · Canada, China
- Languages at home
- 94% English-only · Spanish 4% Chinese 1%
Political lean MEDSL · San Bernardino
- 2024 margin
- Toss-up / Even · D 47.5% · R 49.7% · Other 2.8%
- 2008→2024 swing
- -8.5pp toward R · 2008: 6.3pp · 2024: -2.1pp
- All cycles
- 2024: R+2.1 2020: D+10.7 2016: D+9.8 2012: D+5.4 2008: D+6.3
Not yet ingested
- Civics
- —
Market trends
- HPI YoY
- —
- Current HPI
- —
- Rent YoY
- —
- Metro
- —
- State GDP YoY
- ▲ 3.21%
- F500 in state
- 116
Industry mix (Fortune 500 HQ in CA)
| Industry | F500 HQs | Revenue |
|---|---|---|
| Technology | 27 | $1,492B |
|
||
| Financial Services | 3 | $174B |
|
||
| Retail | 3 | $44B |
|
||
| Insurance | 3 | $26B |
|
||
| Media / Entertainment | 2 | $115B |
|
||
| Pharmaceuticals / Biotech | 2 | $62B |
|
||
Price history
+651.7% since first listed8 events — show timeline
- 2026-05-19 Contingent — GPSMLS
- 2026-05-19 Contingent — SSMLS
- 2026-05-07 Listed $109,000 SSMLS
- 2026-05-07 Listed $109,000 GPSMLS
- 2025-01-30 Sold (MLS) $37,200 SDMLS
- 2024-10-16 Listed $37,200 SDMLS
- 1992-11-17 Sold (Public Records) $10,000 Public Records
- 1979-04-12 Sold (Public Records) $14,500 Public Records
Property tax history
+2.0%/yrLatest (2025): $324 · +1.9% YoY. Source: county tax records.
Cash-flow waterfall
monthlySold comps — $/sqft
last 12 mo · ≤1 miLoading sold comps…