 🌊 Lakefront
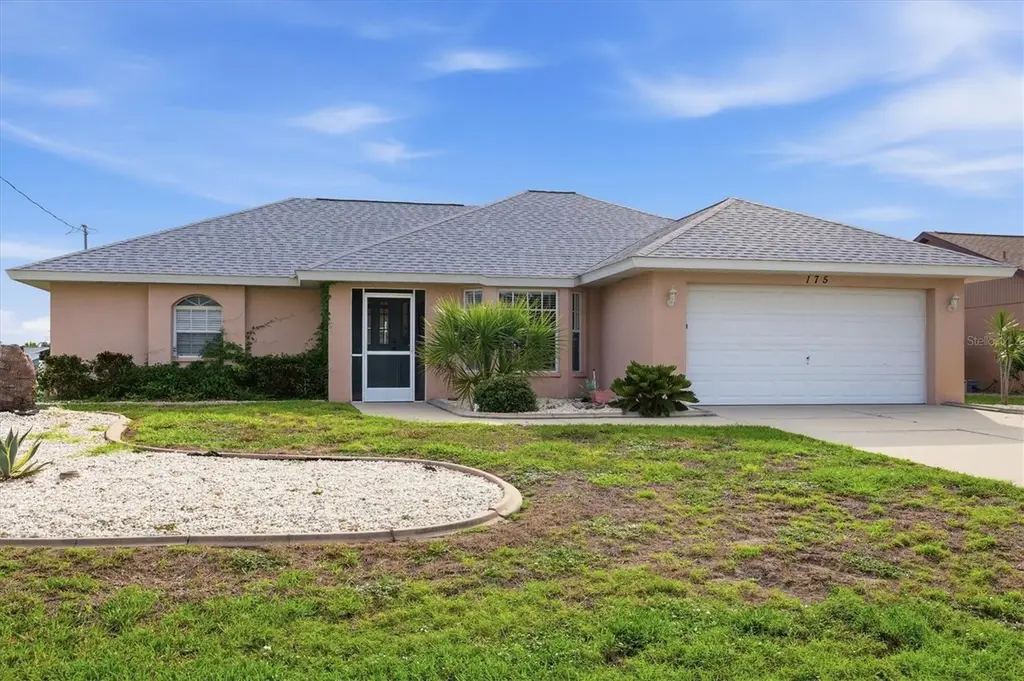
175 Bunker Rd · Rotonda, FL
Flood risk 8/10 · Major
- FEMA flood zone
- X (shaded)
- Chance of flooding over 30 yrs
- 0.96%
- Est. flood insurance / yr
- $507 – $1,088
Fire risk 2/10 · Minimal
- Est. fire insurance / yr
- $947 – $1,759
Heat risk 10/10 · Severe
- Hot days now (above 107°F)
- 7 days/yr
- Hot days in 30 yrs
- 29 days/yr
Wind risk 10/10 · Severe
- Chance of severe wind over 30 yrs
- 99.0%
Air-quality risk 2/10 · Minimal
- Unhealthy air days now
- 1 days/yr
- Unhealthy air days in 30 yrs
- 1 days/yr
Risk factors via First Street. Map © Google.
Why this score? — see what drove the D- grade
The composite is a weighted blend of 9 inputs, each scored 0–100. Each bar is that input's sub-score; the figure is the points it added to the 100-point composite (weight × sub-score).
- Cash flow +8.8/30.0
- ARV discount +6.2/15.0
- Appreciation +5.6/10.0
- Schools +4.6/10.0
- Livability +3.4/5.0
- 1% rule +2.9/10.0
- Condition / age +2.5/5.0
- DSCR +2.4/10.0
- Rent growth +2.4/5.0
$385,000
🖨 Deal sheet 📄 Offer letter ✓ Due diligence
Listing remarks MLS
Turn key pool home on Pebble Beach Canal. Tile floors through out. Split livingroom and familyroom off the kitchen. Inside laundry complete with washer and dryer. Roll down shutters on the lanai opening. 20x9 cover lanai plus pool cage. Area has some of the finest sport fishing in the country along with several parks and community centers. Rotonda is a golf course community with 5 golf courses. community boat ramp, playground and near the famous beaches of Boca Grande and Manasota Key. Just bring your cloths and enjoy the features and amenities Rotonda has to offer. Call today for your private showing.
Key facts
- Close to golf
- Hurricane shutters
- Screened lanai
Tags
Property features AI
Finance
- Other: Property is homesteaded
- Financial info: No lease restrictions indicated
- HOA & community: HOA required (Rotonda West) with annual fee of $190 (about $15.83/month); Pets allowed
Exterior
- Parking: Attached 2-car garage
- Utilities: Electricity connected; Public sewer; Water connected (canal/lake used for irrigation)
- Home design: Single family residence; One story; Faces southwest; Residential property
- Construction: Block construction; Shingle roof; Slab foundation; Built with approximately 1,757 sq ft of living area (public records)
- Exterior features: Covered patio; Screened patio; Sliding doors; Private heated gunite pool with screen enclosure and outside bath access; On a freshwater canal (canal access and view) with 81 feet of frontage; Asphalt road access
Interior
- Kitchen: Dishwasher; Range; Microwave; Refrigerator; Exhaust fan
- Bedrooms: 3 bedrooms
- Flooring: Ceramic tile; Tile floors
- Bathrooms: 2 full bathrooms
- Heating & cooling: Electric heating; Central air conditioning
- Interior features: Ceiling fans; Eat-in kitchen; Kitchen open to family room; Split bedroom layout; Walk-in closets
- Laundry & utility: Washer; Dryer; Dedicated laundry room
Neighborhood map
What this means for you Summary
Snapshot
- This is a 3-bed/2.0-bath single-family listed at $385k.
Deal economics
- At list price, monthly cash flow is $-381 ($-5k/yr) — negative.
- To cash-flow at today's rent, offer at most $318k (17.5% below list).
- To meet the 1% rule (rent ≥ 1% of price), the offer needs to be $303k (21.2% below list).
- Recommended offer: $303k (21.2% below list) — sets the bar for 1% rule.
- Cap rate 5.3% vs local median 3.1% in Rotonda — top-decile yield for the area; either an underpriced asset or a hidden risk that comps aren't pricing in. Stress-test before assuming the spread holds.
Location & tenants
- Location reads 67/100 on livability (#548 in FL) — a middle-class / working-renter tenant base. Strengths: crime A+, housing A-, cost of living B+; Watch: schools D, amenities F, commute F.
- Charlotte (suburban): math 54% / reading 54% proficiency, ranked #22 of 73 in FL (top 30%) — acceptable for families but not a draw, mixed tenant base, ~2y average lease.
- Market conditions: Rents soft (-0.2%/yr); 863 active listings in the ZIP; 38 comparable units currently listed for rent nearby; rentals at typical pace (median 22d on market — plan ~3-4 weeks tenant-placement turnaround); solid renter incomes; 4,585 units permitted in Charlotte County in 2024 (703 in 5+ unit buildings).
- At $3,034/mo this rent would consume 45% of the median local household income ($80k/yr) (locally 91% of renters already pay >50% of income on rent) — very limited rent-growth headroom before tenants either downsize or default.
Forward outlook
- In year one you build about $7k of equity ($3k loan paydown + $5k appreciation (1.2% local appreciation)).
- Charlotte County population projected at +24% by 2050 — long-run rental-demand tailwind backs the buy-and-hold thesis.
- By year 5, paydown + projected appreciation supports a ~$34k cash-out refi (75% LTV) — recoverable capital for the next deal without selling this one.
Negotiation context
- Only 7 days on market — expect competitive offers; lowballing is unlikely to land.
- 4 sale attempts since 13y ago with the ask held roughly flat each time — persistent listings suggest the price (not the market) is what's stuck; bring a comps-based counter.
Risks & watch-outs
- Watch-outs: flood insurance adds $66/mo.
- Climate carrying-cost: severe flood risk; severe wind risk, 99% chance of damaging wind over 30y; extreme-heat days projected 7→29/yr by 2055 (HVAC capex compounding) — expect insurance premiums to compound above CPI over the hold.
Questions for the listing agent
- What do current leases actually rent for vs. the listed asking? Can we see a recent rent roll and the last 12 months of T-12 income?
- What's the actual annual flood-insurance premium (NFIP or private), and is the property in a SFHA with mandatory coverage?
- What does the HOA fee cover, when was the last increase, and are there any pending special assessments or reserve-fund shortfalls?
- Is there a deadline driving the sale (1031 exchange, divorce, estate, relocation)? That informs how much negotiation room exists.
- Schools are D-rated, which usually means shorter tenancies and higher turnover. Who's the typical renter profile here, and what's been the actual vacancy rate?
- The area grade is low — what's the realistic commute time and amenity access for the typical tenant pool here? Any planned neighborhood developments (good or bad) we should know about?
- This sits on a lake — are riparian / water-frontage rights deeded with the parcel? Any dock permits, shoreline easements, or HOA water-use restrictions?
- What's the documented flood / surge / shoreline-erosion history here (FEMA AND non-FEMA — e.g., storm surge, creek backup, septic-field saturation)?
- Any water-quality or seasonal algae-bloom issues that affect tenant satisfaction or short-term-rental demand?
- What's the average days-on-market for RENTAL listings here right now (not sales)? A rising rental-DOM trend means longer vacancies and softer asking-rent achievability than the comps imply.
- What's the recent tenant-quality profile in this submarket — average credit score on applications, eviction rate, late-payment / NSF rate, and stable-employment percentage? A property-management company in the area should have these aggregated.
- How much new for-sale + rental construction is in the pipeline within 1–3 miles? Heavy new supply typically softens prices + rents 12–24 months out; constrained supply supports both.
Investment metrics
- 1% rule
- 0.79% ✗
- Cap rate
- 5.31%
- Cash-on-cash
- -3.50%
- DSCR
- 0.84
- GRM
- 10.6
CMA / ARV
- ARV (on-the-fly)
- $374,241
- Comps found
- 12
Show comp detail 12 sales within ~0.75 mi
| Address | Dist | Beds/Ba | Sqft | Sold | Price | $/sf | Match |
|---|---|---|---|---|---|---|---|
| 209 Mark Twain Ln | 0.11mi | 3/2.0 | 1,588 (-10%) | 4mo | $306,100 | $193 | 76 |
| 158 Mark Twain Ln | 0.29mi | 3/2.0 | 1,670 (-5%) | 5mo | $359,000 | $215 | 74 |
| 36 Pinehurst Ct | 0.54mi | 3/2.0 | 1,720 (-2%) | 2mo | $390,000 | $227 | 70 |
| 239 Annapolis Ln | 0.67mi | 3/2.0 | 1,747 (-1%) | 3mo | $130,000 | $74 | 65 |
| 46 Bunker Ct | 0.60mi | 3/2.0 | 1,818 (+4%) | 2mo | $339,000 | $186 | 65 |
| 254 Mark Twain Ln | 0.42mi | 4/2.0 (+1) | 1,874 (+7%) | 2mo | $399,900 | $213 | 63 |
| 27 Mariner Ln | 0.54mi | 3/2.5 | 1,652 (-6%) | 1mo | $420,000 | $254 | 62 |
| 13 Bunker Pl | 0.48mi | 3/2.0 | 1,568 (-11%) | 4mo | $359,900 | $230 | 56 |
| 14 Bunker Ct | 0.74mi | 3/2.0 | 1,854 (+6%) | 3mo | $345,000 | $186 | 54 |
| 13 Bunker Ln | 0.57mi | 3/2.0 | 1,597 (-9%) | 6mo | $340,000 | $213 | 53 |
| 25 Mariner Ln | 0.56mi | 3/2.0 | 1,592 (-9%) | 11mo | $330,000 | $207 | 50 |
| 30 Bunker Ln | 0.59mi | 3/2.0 | 1,972 (+12%) | 8mo | $409,000 | $207 | 45 |
Match score weights: distance 35% · size 25% · config 20% · recency 20%. Top-matched comps best support the ARV.
Projected returns pro-forma
1.25% appreciation · 0.0% rent growth · sell at horizon
- IRR
- -3.9%
- Equity multiple
- 0.80×
- Total profit
- $-21,099
- Equity at exit
- $136,466
- IRR
- -0.4%
- Equity multiple
- 0.95×
- Total profit
- $-5,304
- Equity at exit
- $185,308
Cash invested: $107,800 (down + closing). Projections, not guarantees.
Landlord ↔ Tenant lean methodology
- Overall (STATE)
- 87 Strongly Landlord-Friendly
- State Florida
- 87 Strongly Landlord-Friendly · R+3
- County
- — inherits STATE
- City
- — inherits STATE
ZIP-level market 33947
- Home prices YoY
- 0.4%
- Rents YoY
- -0.2%
- Active inventory
- 863
- Price-to-rent
- 10.6×
Monthly cashflow live
- Estimated rent
- $3,034 high interval (Pro) →
- Mortgage (P&I)
- −$2,019
- Tax from tax record
- −$517 /mo · $6,200/yr
- Insurance
- −$160
- Flood insurance flood zone
- −$66 /mo · $798/yr
- HOA
- −$15
- Vacancy / Maint / Mgmt
- −$637
- Net cashflow
- $-381
Break-even live
UW: 25.0% down · 7.5% · 30yr · 1.5% tax · 5.0% vac · 8.0% maint · 8.0% mgmt
Financing live
Cash to close
- Down payment
- $96,250
- Closing costs
- $11,550
- Reserves months
- —
- Total cash needed
- —
Loan-product check · same deal, 3 products live
Conventional
25% down · 7.5% · 30yr
- Down + closing
- —
- Monthly P&I
- —
- Monthly cashflow
- —
- DSCR
- —
- Eligible?
- —
Personal DTI + credit; lowest rate.
DSCR
20% down · 8.5% · 30yr
- Down + closing
- —
- Monthly P&I
- —
- Monthly cashflow
- —
- DSCR
- —
- Eligible?
- —
No personal income docs; deal must DSCR.
Hard money
10% down · 12.0% · 12mo
- Down + closing
- —
- Monthly P&I
- —
- Monthly cashflow
- —
- DSCR
- —
- Eligible?
- —
Short-term bridge; refi at stabilization.
Rent comps 38 comps
| Address | Beds | Baths | Sqft | Rent | $/sqft | DOM | Units | Dist |
|---|---|---|---|---|---|---|---|---|
| 181 Bunker Rd Rotonda West, FL | 2.0 | 2.0 | 1355 | $4,600 | $3.39 | 21d | 1 | 0.04mi |
| 80 Mariner Ln Rotonda West, FL | 3.0 | 2.0 | 2052 | $4,800 | $2.34 | 21d | 1 | 0.20mi |
| 36 Bunker Cir Rotonda West, FL | 2.0 | 2.0 | 1533 | $3,999 | $2.61 | 21d | 1 | 0.28mi |
| 65 Fairway Rd Rotonda West, FL | 3.0 | 2.0 | 1865 | $2,700 | $1.45 | 21d | 1 | 0.29mi |
| 87 Mark Twain Ln Rotonda West, FL | 3.0 | 2.0 | 1235 | $2,500 | $2.02 | 21d | 1 | 0.41mi |
| 25 Fairway Rd Rotonda West, FL | 3.0 | 2.0 | 2068 | $2,375 | $1.15 | 21d | 1 | 0.56mi |
| 22 Mariner Ln Rotonda West, FL | 3.0 | 2.0 | 2015 | $4,200 | $2.08 | 21d | 1 | 0.57mi |
| 42 Mark Twain Ln Rotonda West, FL | 3.0 | 2.5 | 1677 | $2,800 | $1.67 | 21d | 1 | 0.64mi |
| 230 Annapolis Ln Rotonda West, FL | 3.0 | 2.0 | 1768 | $1,800 | $1.02 | 21d | 1 | 0.64mi |
| 285 Mark Twain Ln Rotonda West, FL | 3.0 | 2.0 | 1759 | $1,750 | $0.99 | 21d | 1 | 0.65mi |
| 239 Annapolis Ln Rotonda West, FL | 3.0 | 2.0 | 1747 | $2,000 | $1.14 | 21d | 1 | 0.65mi |
| 118 Caddy Rd Rotonda West, FL | 3.0 | 2.0 | 1828 | $2,795 | $1.53 | 21d | 1 | 0.75mi |
| 65 Oakland Hills Pl Rotonda West, FL | 2.0 | 2.0 | 1444 | $4,500 | $3.12 | 21d | 1 | 0.79mi |
| 30 Pinehurst Pl Rotonda West, FL | 3.0 | 3.0 | 2461 | $3,900 | $1.58 | 21d | 1 | 0.82mi |
| 12 Broadmoor Rd Unit 1 Rotonda West, FL | 3.0 | 2.0 | 2065 | $3,500 | $1.69 | 21d | 1 | 0.84mi |
| 37 Oakland Hills Pl Rotonda West, FL | 3.0 | 2.0 | 1321 | $4,000 | $3.03 | 21d | 1 | 0.90mi |
| 60 Golfview Rd Rotonda West, FL | 3.0 | 2.0 | 1336 | $5,550 | $4.15 | 21d | 1 | 0.96mi |
| 64 Golfview Rd Rotonda West, FL | 4.0 | 2.0 | 1697 | $1,795 | $1.06 | 14d | 1 | 0.98mi |
| 511 Sweetwater Dr Rotonda West, FL | 4.0 | 2.5 | 2160 | $2,200 | $1.02 | 21d | 1 | 1.02mi |
| 123 Marker Rd Rotonda West, FL | 3.0 | 2.0 | 2006 | $2,400 | $1.20 | 14d | 1 | 1.03mi |
| 155 Long Meadow Ln Rotonda West, FL | 3.0 | 2.0 | 1598 | $4,500 | $2.82 | 21d | 1 | 1.04mi |
| 173 Rotonda Cir Rotonda West, FL | 3.0 | 2.0 | 1350 | $3,200 | $2.37 | 21d | 1 | 1.05mi |
| 188 Boundary Blvd Unit B Rotonda West, FL | 2.0 | 2.0 | 2086 | $2,000 | $0.96 | 21d | 1 | 1.08mi |
| 18 Golfview Ct Rotonda West, FL | 3.0 | 2.0 | 1686 | $3,000 | $1.78 | 21d | 1 | 1.09mi |
| 45 Oakland Hills Ct Rotonda West, FL | 4.0 | 2.0 | 1536 | $2,700 | $1.76 | 21d | 1 | 1.10mi |
| 527 Rotonda Cir Rotonda West, FL | 3.0 | 2.0 | 1586 | $2,375 | $1.50 | 21d | 1 | 1.18mi |
| 127 White Marsh Ln Rotonda West, FL | 3.0 | 2.0 | 2216 | $2,700 | $1.22 | 21d | 1 | 1.19mi |
| 130 Boundary Blvd Unit B Rotonda West, FL | 2.0 | 2.0 | 2060 | $2,000 | $0.97 | 21d | 1 | 1.27mi |
| 72 Long Meadow Ln Rotonda West, FL | 3.0 | 2.0 | 1945 | $1,920 | $0.99 | 14d | 1 | 1.27mi |
| 100 Rotonda Lakes Cir Rotonda West, FL | 1.0–3.0 | 1.0–2.0 | 1024 | $1,232 | $1.20 | 14d | 1 | 1.28mi |
| 502 Sunset Rd N Rotonda West, FL | 3.0 | 2.0 | 1636 | $2,100 | $1.28 | 21d | 1 | 1.34mi |
| 589 Rotonda Cir Rotonda West, FL | 3.0 | 2.5 | 2190 | $4,200 | $1.92 | 21d | 1 | 1.37mi |
| 113 Boundary Blvd #2 Rotonda West, FL | 3.0 | 2.0 | 1323 | $1,625 | $1.23 | 14d | 1 | 1.37mi |
| 113 Boundary Blvd Unit B 1 Rotonda West, FL | 3.0 | 2.0 | 1325 | $1,695 | $1.28 | 21d | 1 | 1.37mi |
| 72 Long Meadow Ct Rotonda West, FL | 3.0 | 2.0 | 1570 | $5,200 | $3.31 | 21d | 1 | 1.38mi |
| 93 Boundary Blvd #303 Rotonda West, FL | 2.0 | 2.0 | 1228 | $2,800 | $2.28 | 14d | 1 | 1.44mi |
| 114 Albatross Rd Rotonda West, FL | 3.0 | 2.0 | 1648 | $5,300 | $3.22 | 21d | 1 | 1.47mi |
| 613 Boundary Blvd Rotonda West, FL | 3.0 | 2.0 | 2469 | $2,900 | $1.17 | 21d | 1 | 1.48mi |
HOA detail
- Monthly dues
- $15 · $180/yr
- Likely covers
- pool
Listing history 7 events
-
2026-06-18days on market $385,000 Active 7 DOM
-
2026-06-17days on market $385,000 Active 6 DOM
-
2026-06-16days on market $385,000 Active 5 DOM
-
2026-06-15days on market $385,000 Active 4 DOM
-
2026-06-14days on market $385,000 Active 2 DOM
-
2026-06-13remarks 699-char remark
-
2026-06-13$385,000 Active 1 DOM
ⓘ Source: listings_history table (triggers on properties + properties_extension) + one-shot
backfill from property_details.listing_events for pre-trigger history.
Tax reassessment forecast FL · Resets to sale price
- Current annual tax
- $6,200 · $517/mo
- Projected year-2 tax
- $6,200 · $517/mo
- Expected delta
- $0/yr ($0/mo · -0.0%)
ⓘ Screening estimate from a state-policy table — verify with the county assessor before closing.
Climate risk First Street
- Flood 8/10 Severe FEMA zone X (shaded) · 96% chance over 30 yrs
- Wildfire 2/10 Low
- Heat 10/10 Extreme 7 d/yr ≥107°F today · 29 d/yr by 30 yrs out
- Wind 10/10 Extreme 99% chance of damaging wind over 30 yrs
- Air quality 2/10 Low 1 unhealthy d/yr today · 1 by 30 yrs out
Nearby sold comps map
Loading sold comps map…
Walkable amenities ~0.75 mi
Loading nearby amenities…
Taxation est. · year 1
- Rental income
- $36,405
- − Mortgage interest
- −$21,566
- − Property taxes
- −$6,200
- − Insurance
- −$2,722
- − Repairs & maintenance
- −$2,912
- − Management
- −$2,912
- − HOA
- −$180
- − Depreciation
- −$11,200
- Taxable loss
- −$11,288
- Est. tax savings @ 24.0%
- +$2,709
- After-tax cash flow
- $-1,861/yr
For passive investors: Depreciation is non-cash, so a rental often shows a tax loss while cash-flowing — sheltering income. Rental losses are passive: they offset passive income freely, and up to $25,000/yr can offset ordinary (W-2) income if you actively participate and your MAGI is under $100k (phasing out to $0 by $150k); unused losses carry forward. On sale, claimed depreciation is recaptured at up to 25%, and gains may owe capital-gains tax (a 1031 exchange can defer both). Figures are a year-1 estimate at your 24.0% rate — not tax advice; consult a CPA.
Schools (NCES district)
- District
- Charlotte
- NCES district ID
- 1200240
- Math proficiency
- 54% ▼ -6.00%
- Reading proficiency
- 54% ▼ -1.00%
- Median HH income
- $44,864
- Composite
- 45.62/100
- National rank
- #2586
- State rank
- #22 of 73 in FL
Livability — Rotonda
- Score
- 67/100
- State rank
- #548
- US rank
- #10359
Category grades
Schools grade is shown separately in the Schools card above.
Census & demographics
- Census place
- Rotonda, FL
- County
- Charlotte County · 196,994 people
- City population
- 10,490
- Metro
- Punta Gorda, FL
- Population (ZIP)
- 10,447
- Household income
- $80,091
- Rent vs Own
- Severe rent burden
- 91.0
Population outlook (Charlotte County) Hauer SSP2
- Today (2025)
- 198,646 people
- By 2030
- 210,507 · +6.0%
- By 2040
- 230,857 · +16.2%
- By 2050
- 247,148 · +24.4%
- By 2075
- 281,777 · +41.8%
- By 2100
- 293,609 · +47.8%
Race, ethnicity, and origin ACS 2023
- Neighborhood character
- Predominantly White (96%)
- Race & ethnicity
- White 96% Hispanic / Latino 2% Two or more races 2%
- Common ancestry
- Romanian 5% Lithuanian 4% Slovak 4%
- Foreign-born
- 8% · Canada, Vietnam
- Languages at home
- 93% English-only · Russian/Polish/Slavic 3% Spanish 2% German/W. Germanic 1%
Political lean MEDSL · Charlotte
- 2024 margin
- Solid R (+34.0) · D 32.7% · R 66.7%
- 2008→2024 swing
- -26.7pp toward R · 2008: -7.2pp · 2024: -34.0pp
- All cycles
- 2024: R+34.0 2020: R+26.6 2016: R+27.8 2012: R+14.3 2008: R+7.2
Not yet ingested
- Civics
- —
Market trends
- HPI YoY
- ▲ 1.25%
- Current HPI
- 311.3231
- Rent YoY
- ▼ -0.22%
- Metro
- Punta Gorda, FL
- State GDP YoY
- ▲ 3.28%
- F500 in state
- 36
Industry mix (Fortune 500 HQ in FL)
| Industry | F500 HQs | Revenue |
|---|---|---|
| Industrial Technology | 2 | $29B |
|
||
| Insurance | 2 | $17B |
|
||
| Retail | 1 | $60B |
|
||
| Technology Distribution | 1 | $58B |
|
||
| Homebuilding | 1 | $35B |
|
||
| Technology Manufacturing | 1 | $35B |
|
||
Price history
+148.4% since first listed11 events — show timeline
- 2026-06-11 Listed $385,000 Stellar MLS as Distributed by MLS Grid
- 2022-05-02 Sold (Public Records) $425,000 Public Records
- 2022-04-29 Sold (MLS) $425,000 Stellar MLS as Distributed by MLS Grid
- 2022-02-18 Pending — Stellar MLS as Distributed by MLS Grid
- 2022-02-15 Listed $377,000 Stellar MLS as Distributed by MLS Grid
- 2013-10-14 Sold (Public Records) $174,000 Public Records
- 2013-10-04 Sold (MLS) $174,000 Stellar MLS as Distributed by MLS Grid
- 2013-07-25 Listed $178,900 Stellar MLS as Distributed by MLS Grid
- 2013-07-11 Sold (Public Records) $155,000 Public Records
- 2013-07-10 Sold (MLS) $155,000 Stellar MLS as Distributed by MLS Grid
- 2013-01-17 Listed $155,000 Stellar MLS as Distributed by MLS Grid
Property tax history
+9.2%/yrLatest (2025): $6,200 · +1.9% YoY. Source: county tax records.
Cash-flow waterfall
monthlySold comps — $/sqft
last 12 mo · ≤1 miLoading sold comps…