160 Private Road 481 · Carl's Corner, TX
Flood risk 3/10 · Minor
- FEMA flood zone
- A
- Chance of flooding over 30 yrs
- 0.1%
- Est. flood insurance / yr
- $1,009 – $1,996
Fire risk 5/10 · Moderate
- Est. fire insurance / yr
- $1,222 – $2,270
Heat risk 6/10 · Moderate
- Hot days now (above 110°F)
- 4 days/yr
- Hot days in 30 yrs
- 13 days/yr
Wind risk 6/10 · Moderate
- Chance of severe wind over 30 yrs
- 27.0%
Air-quality risk 2/10 · Minimal
- Unhealthy air days now
- 1 days/yr
- Unhealthy air days in 30 yrs
- 2 days/yr
Risk factors via First Street. Map © Google.
Why this score? — see what drove the C grade
The composite is a weighted blend of 9 inputs, each scored 0–100. Each bar is that input's sub-score; the figure is the points it added to the 100-point composite (weight × sub-score).
- Cash flow +20.9/30.0
- ARV discount +15.0/15.0
- DSCR +6.7/10.0
- 1% rule +6.0/10.0
- Schools +3.5/10.0
- Rent growth +2.5/5.0
- Livability +2.5/5.0
- Condition / age +2.5/5.0
- Appreciation +0.0/10.0
$119,900
🖨 Deal sheet (PDF) 📄 Offer letter ✓ Due diligence
Listing remarks MLS
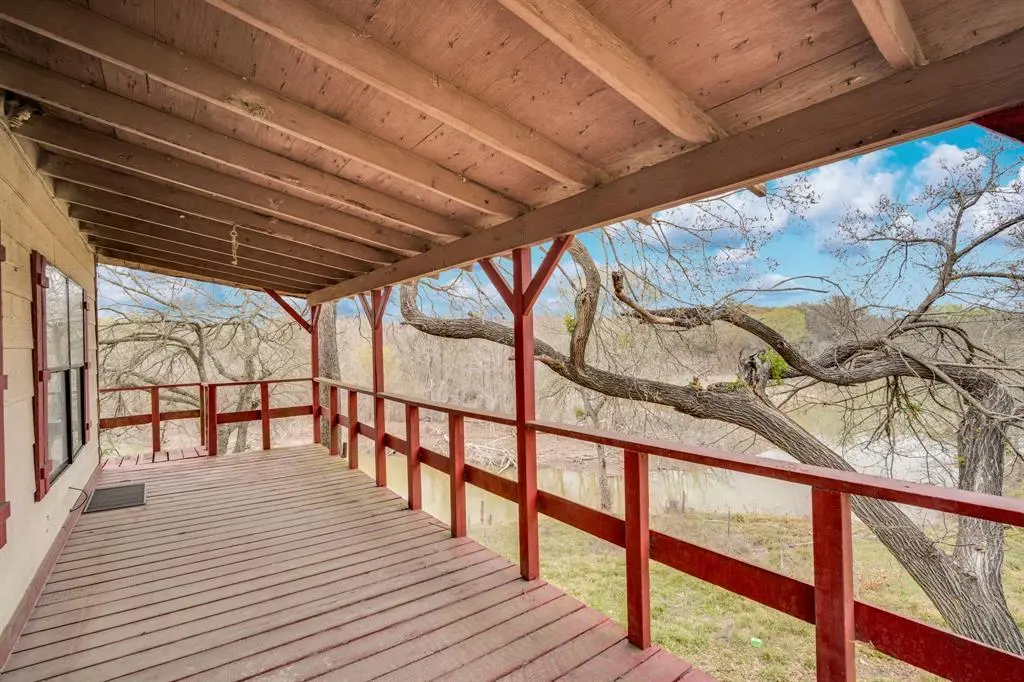
Enjoy peaceful lake views right from your covered balcony at this 2-bedroom, 2-bath home situated on approximately .5 acres. With 1,344 square feet of living space, the layout offers solid potential for a weekend getaway, full-time cabin living, or an investment property. The .5 acre lot provides room to spread out and enjoy the natural setting, while the elevated balcony gives you a front-row seat to relaxing water views. Whether you’re looking to create a cozy rental or a personal retreat, this property offers the location to make it happen. With some vision and renovation, this lake-view property could truly shine making it an ideal project for investors or buyers ready to roll up their sleeves and add value.
Key facts
- Lake views
- Covered balcony
- Elevated balcony
Tags
Neighborhood map
What this means for you Summary
Snapshot
- This is a 2-bed/2.0-bath single-family listed at $120k.
Deal economics
- At list price, monthly cash flow is $42 ($505/yr) — positive.
- The deal already cash-flows at list — no discount required.
- Meets the 1% rule at list price ($1k rent vs $120k).
- Recommended offer: $109k (9.0% below list) — sets the bar for market timing.
Location & tenants
- Location reads: area grade C — affects rentability + tenant quality, not the cash-flow math above.
- Hillsboro ISD (town): math 46% / reading 39% proficiency, ranked #370 of 826 in TX (top 45%) — families likely to look elsewhere, expect single-tenant / working-renter base with shorter leases; 71% free/reduced lunch — lower-income household profile, screen leases tightly.
- Zoned schools: Hillsboro Int (math 43% / reading 35%, grade F, #690 of 1,662 statewide, top 42%, 429 students, 81% FRL); Hillsboro J H (math 47% / reading 40%, grade D, #530 of 1,662 statewide, top 32%, 272 students, 72% FRL); Hillsboro H S (math 52% / reading 47%, grade D, #509 of 1,632 statewide, top 34%, 604 students, 78% FRL).
- Market conditions: 161 active listings in the ZIP; 65 units permitted in Hill County in 2024 (0 in 5+ unit buildings).
Forward outlook
- Local home prices are declining (-3.0%/yr); year-one equity from $829 of loan paydown is wiped out by about $4k of value loss. Plan a longer hold.
- Hill County population projected at -12% by 2050 — secular population decline; favor cash flow + early exit over multi-decade hold.
Negotiation context
- It's been on market 119 days — a 9% lower offer ($109k) is reasonable based on typical stale-listing flexibility.
- 2 sale attempts since 4y ago; this cycle's ask has dropped $20k (14%) from the opening price — seller is motivated, your offer sets the floor, not the list.
Risks & watch-outs
- Watch-outs: flood insurance adds $125/mo.
- Climate carrying-cost: in FEMA flood zone A (mandatory federal flood insurance); major wind risk, 27% chance of damaging wind over 30y; moderate wildfire risk; extreme-heat days projected 4→13/yr by 2055 (HVAC capex compounding) — expect insurance premiums to compound above CPI over the hold.
Questions for the listing agent
- It's been on market 119 days. Have you received any prior offers? Is the seller open to a 9% concession, seller financing, or rate buy-down credit?
- What's the actual annual flood-insurance premium (NFIP or private), and is the property in a SFHA with mandatory coverage?
- Why hasn't it sold? Are there any deal-killer items the seller is aware of (foundation, flood, title, zoning, code violations)?
- Is there a deadline driving the sale (1031 exchange, divorce, estate, relocation)? That informs how much negotiation room exists.
- What's the average days-on-market for RENTAL listings here right now (not sales)? A rising rental-DOM trend means longer vacancies and softer asking-rent achievability than the comps imply.
- What's the recent tenant-quality profile in this submarket — average credit score on applications, eviction rate, late-payment / NSF rate, and stable-employment percentage? A property-management company in the area should have these aggregated.
- How much new for-sale + rental construction is in the pipeline within 1–3 miles? Heavy new supply typically softens prices + rents 12–24 months out; constrained supply supports both.
Investment metrics
- 1% rule
- 1.10% ✓
- Cap rate
- 7.97%
- Cash-on-cash
- 5.98%
- DSCR
- 1.27
- GRM
- 7.6
CMA / ARV
- ARV (median comp)
- $196,723
- List price
- $119,900
- Delta
- -39.05%
- Verdict
- UNDERPRICED
- Comps
- 3 within 1.0 mi
Show comp detail 1 sale within ~0.75 mi
| Address | Dist | Beds/Ba | Sqft | Sold | Price | $/sf | Match |
|---|---|---|---|---|---|---|---|
| 360 Private Rd 477 | 0.37mi | 2/1.5 | 1,290 (-4%) | 18mo | $310,000 | $240 | 59 |
Match score weights: distance 35% · size 25% · config 20% · recency 20%. Top-matched comps best support the ARV.
Projected returns pro-forma
-3.0% appreciation · 3.0% rent growth · sell at horizon
- IRR
- -13.8%
- Equity multiple
- 0.50×
- Total profit
- $-16,624
- Equity at exit
- $17,877
- IRR
- -4.8%
- Equity multiple
- 0.69×
- Total profit
- $-10,514
- Equity at exit
- $10,367
Cash invested: $33,572 (down + closing). Projections, not guarantees.
Landlord ↔ Tenant lean methodology
- Overall (STATE)
- 87 Strongly Landlord-Friendly
- State Texas
- 87 Strongly Landlord-Friendly · R+5
- County
- — inherits STATE
- City
- — inherits STATE
ZIP-level market 76645
- Home prices YoY
- -33.5%
- Active inventory
- 161
- Price-to-rent
- 7.6×
Monthly cashflow live
- Estimated rent
- $1,320 medium interval (Pro) →
- Mortgage (P&I)
- −$629
- Tax from tax record
- −$197 /mo · $2,365/yr
- Insurance
- −$50
- Flood insurance flood zone
- −$125 /mo · $1,502/yr
- HOA
- −$0
- Lot rent
- −$0
- Vacancy / Maint / Mgmt
- −$277
- Net cashflow
- $42
Break-even live
Sensitivity live
| Price | -10% $110 | -5% $76 | +0% $42 | +5% $8 | +10% $-26 |
|---|---|---|---|---|---|
| Rent | -10% $-62 | -5% $-10 | +0% $42 | +5% $94 | +10% $146 |
| Rate | -1.0pp $102 | -0.5pp $73 | base $42 | +0.5pp $11 | +1.0pp $-21 |
UW: 25.0% down · 7.5% · 30yr · 1.5% tax · 5.0% vac · 8.0% maint · 8.0% mgmt
Financing live
Cash to close
- Down payment
- $29,975
- Closing costs
- $3,597
- Reserves months
- —
- Total cash needed
- —
Loan-product check · same deal, 3 products live
Conventional
25% down · 7.5% · 30yr
- Down + closing
- —
- Monthly P&I
- —
- Monthly cashflow
- —
- DSCR
- —
- Eligible?
- —
Personal DTI + credit; lowest rate.
DSCR
20% down · 8.5% · 30yr
- Down + closing
- —
- Monthly P&I
- —
- Monthly cashflow
- —
- DSCR
- —
- Eligible?
- —
No personal income docs; deal must DSCR.
Hard money
10% down · 12.0% · 12mo
- Down + closing
- —
- Monthly P&I
- —
- Monthly cashflow
- —
- DSCR
- —
- Eligible?
- —
Short-term bridge; refi at stabilization.
Listing history 23 events
-
2026-06-22days on market $119,900 Active 119 DOM
-
2026-06-21days on market $119,900 Active 118 DOM
-
2026-06-21days on market $119,900 Active 117 DOM
-
2026-06-18days on market $119,900 Active 115 DOM
-
2026-06-17days on market $119,900 Active 114 DOM
-
2026-06-16days on market $119,900 Active 113 DOM
-
2026-06-15days on market $119,900 Active 112 DOM
-
2026-06-13days on market $119,900 Active 110 DOM
-
2026-06-12days on market $119,900 Active 109 DOM
-
2026-06-10days on market $119,900 Active 106 DOM
-
2026-06-08days on market $119,900 Active 105 DOM
-
2026-06-08days on market $119,900 Active 104 DOM
-
2026-06-07days on market $119,900 Active 103 DOM
-
2026-06-03days on market $119,900 Active 100 DOM
-
2026-06-02days on market $119,900 Active 99 DOM
-
2026-06-01days on market $119,900 Active 98 DOM
-
2026-05-31days on market $119,900 Active 97 DOM
-
2026-04-21price $119,900 727-char remark
Show marketing remark (727 chars)
Enjoy peaceful lake views right from your covered balcony at this 2-bedroom, 2-bath home situated on approximately .5 acres. With 1,344 square feet of living space, the layout offers solid potential for a weekend getaway, full-time cabin living, or an investment property. The .5 acre lot provides room to spread out and enjoy the natural setting, while the elevated balcony gives you a front-row seat to relaxing water views. Whether you’re looking to create a cozy rental or a personal retreat, this property offers the location to make it happen. With some vision and renovation, this lake-view property could truly shine making it an ideal project for investors or buyers ready to roll up their sleeves and add value.
-
2026-02-22$139,900 Active 727-char remark
Show marketing remark (727 chars)
Enjoy peaceful lake views right from your covered balcony at this 2-bedroom, 2-bath home situated on approximately .5 acres. With 1,344 square feet of living space, the layout offers solid potential for a weekend getaway, full-time cabin living, or an investment property. The .5 acre lot provides room to spread out and enjoy the natural setting, while the elevated balcony gives you a front-row seat to relaxing water views. Whether you’re looking to create a cozy rental or a personal retreat, this property offers the location to make it happen. With some vision and renovation, this lake-view property could truly shine making it an ideal project for investors or buyers ready to roll up their sleeves and add value.
-
2023-03-11historical
-
2023-02-03price $189,900
-
2022-12-16$199,900 Active
-
2000-01-03soldstatus
ⓘ Source: listings_history table (triggers on properties + properties_extension) + one-shot
backfill from property_details.listing_events for pre-trigger history.
Tax reassessment forecast TX · Resets to sale price
- Current annual tax
- $2,365 · $197/mo
- Projected year-2 tax
- $2,365 · $197/mo
- Expected delta
- $0/yr ($0/mo · 0.0%)
ⓘ Screening estimate from a state-policy table — verify with the county assessor before closing.
Climate risk First Street
- Flood 3/10 Moderate FEMA zone A · 10% chance over 30 yrs
- Wildfire 5/10 Major
- Heat 6/10 Major 4 d/yr ≥110°F today · 13 d/yr by 30 yrs out
- Wind 6/10 Major 27% chance of damaging wind over 30 yrs
- Air quality 2/10 Low 1 unhealthy d/yr today · 2 by 30 yrs out
Nearby sold comps map
Loading sold comps map…
Walkable amenities ~0.75 mi
Loading nearby amenities…
Taxation est. · year 1
- Rental income
- $15,844
- − Mortgage interest
- −$6,716
- − Property taxes
- −$2,365
- − Insurance
- −$2,102
- − Repairs & maintenance
- −$1,268
- − Management
- −$1,268
- − Depreciation
- −$3,488
- Taxable loss
- −$1,362
- Est. tax savings @ 24.0%
- +$327
- After-tax cash flow
- $832/yr
For passive investors: Depreciation is non-cash, so a rental often shows a tax loss while cash-flowing — sheltering income. Rental losses are passive: they offset passive income freely, and up to $25,000/yr can offset ordinary (W-2) income if you actively participate and your MAGI is under $100k (phasing out to $0 by $150k); unused losses carry forward. On sale, claimed depreciation is recaptured at up to 25%, and gains may owe capital-gains tax (a 1031 exchange can defer both). Figures are a year-1 estimate at your 24.0% rate — not tax advice; consult a CPA.
Schools (NCES district)
- District
- Hillsboro ISD
- NCES district ID
- 4823280
- Math proficiency
- 46% ▲ 4.00%
- Reading proficiency
- 39% ▲ 2.00%
- Median HH income
- $34,483
- Composite
- 35.12/100
- National rank
- #5016
- State rank
- #370 of 826 in TX
Livability — Carl's Corner
No livability data for this city. (Only ~50 U.S. cities are tracked.)
Census & demographics
- Population (ZIP)
- 11,321
Population outlook (Hill County) Hauer SSP2
- Today (2025)
- 34,013 people
- By 2030
- 33,289 · -2.1%
- By 2040
- 31,688 · -6.8%
- By 2050
- 30,100 · -11.5%
- By 2075
- 26,818 · -21.2%
- By 2100
- 22,918 · -32.6%
Race, ethnicity, and origin ACS 2023
- Neighborhood character
- Diverse neighborhood (Simpson 0.60)
- Race & ethnicity
- White 52% Hispanic / Latino 34% Black 10% Two or more races 8% Native American 1%
- Hispanic origin (detail)
- Mexican 32%
- Common ancestry
- Slovak 1% Lithuanian 1% Serbian 1%
- Foreign-born
- 11% · Canada
- Languages at home
- 73% English-only · Spanish 26%
Political lean MEDSL · Hill
- 2024 margin
- Solid R (+64.4) · D 17.5% · R 81.8%
- 2008→2024 swing
- -23.0pp toward R · 2008: -41.4pp · 2024: -64.4pp
- All cycles
- 2024: R+64.4 2020: R+60.7 2016: R+58.4 2012: R+53.0 2008: R+41.4
Not yet ingested
- Civics
- —
Market trends
- HPI YoY
- ▼ -124.83%
- Current HPI
- 248.3182
- Rent YoY
- —
- Metro
- —
- State GDP YoY
- ▲ 3.95%
- F500 in state
- 110
Industry mix (Fortune 500 HQ in TX)
| Industry | F500 HQs | Revenue |
|---|---|---|
| Energy | 16 | $1,198B |
|
||
| Technology | 5 | $198B |
|
||
| Engineering / Construction | 4 | $72B |
|
||
| Energy Services | 3 | $60B |
|
||
| Utilities | 3 | $41B |
|
||
| Healthcare | 2 | $330B |
|
||
Price history
-40.0% since first listed6 events — show timeline
- 2026-04-21 Price Changed $119,900 NTREIS
- 2026-02-22 Listed $139,900 NTREIS
- 2023-03-11 Listing Removed — NTREIS
- 2023-02-03 Price Changed $189,900 NTREIS
- 2022-12-16 Listed $199,900 NTREIS
- 2000-01-03 Sold (Public Records) — Public Records
Property tax history
+5.2%/yrLatest (2025): $2,365 · +11.4% YoY. Source: county tax records.
Cash-flow waterfall
monthlySold comps — $/sqft
last 12 mo · ≤1 miLoading sold comps…