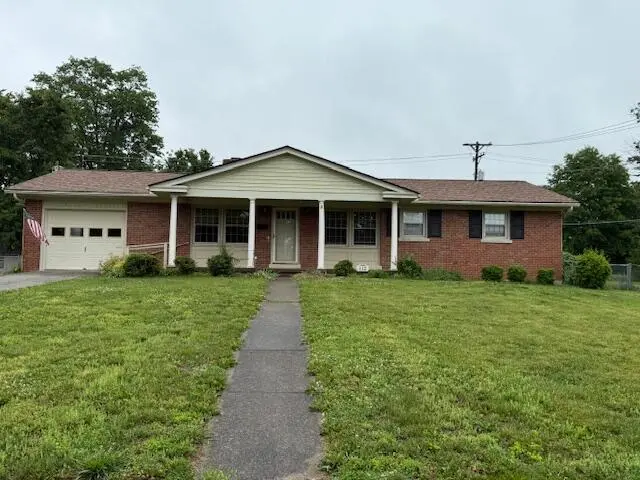
112 Charlotte Dr · Cynthiana, KY
Flood risk 1/10 · Minimal
- FEMA flood zone
- X (unshaded)
- Chance of flooding over 30 yrs
- 0.0%
- Est. flood insurance / yr
- $507 – $1,088
Fire risk 1/10 · Minimal
- Est. fire insurance / yr
- $839 – $1,559
Heat risk 4/10 · Minor
- Hot days now (above 102°F)
- 7 days/yr
- Hot days in 30 yrs
- 19 days/yr
Wind risk 2/10 · Minimal
- Chance of severe wind over 30 yrs
- 2.0%
Air-quality risk 2/10 · Minimal
- Unhealthy air days now
- 1 days/yr
- Unhealthy air days in 30 yrs
- 2 days/yr
Risk factors via First Street. Map © Google.
Why this score? — see what drove the C- grade
The composite is a weighted blend of 9 inputs, each scored 0–100. Each bar is that input's sub-score; the figure is the points it added to the 100-point composite (weight × sub-score).
- Cash flow +15.4/30.0
- Appreciation +10.0/10.0
- ARV discount +7.5/15.0
- DSCR +4.7/10.0
- Livability +3.7/5.0
- 1% rule +3.2/10.0
- Rent growth +2.5/5.0
- Condition / age +2.5/5.0
- Schools +2.2/10.0
$269,900
🖨 Deal sheet (PDF) 📄 Offer letter ✓ Due diligence
Listing remarks MLS
Great location! Well established neighborhood. Come see this charming 3 bedroom/1.5 bath home, large living room with fireplace and gleaming hardwood floor, large eat-in kitchen and den. Large fenced in back yard with a storage shed. This property is meticulous kept. Lots of updates throughout home. Come make me your own.
Key facts
- 1,550 sq ft lot
- Garage
- Built 1955
Property features AI
Exterior
- Parking: Attached garage; Driveway; Off-street parking; Garage faces front
- Utilities: Public sewer; Electricity connected; Natural gas available; Sewer connected; Water connected
- Home design: House; One story
- Construction: Brick veneer exterior; Block foundation; Dimensional-style roof
- Exterior features: Shed(s); Chain link fencing; Public water; Not on waterfront; No notable view
Interior
- Kitchen: Dishwasher; Refrigerator; Range
- Bedrooms: 3 total rooms (includes bedrooms and living areas)
- Flooring: Hardwood; Laminate
- Bathrooms: 1 full bathroom; 1 half bathroom
- Heating & cooling: Electric forced-air heating; Electric cooling
- Interior features: Eat-in kitchen; Primary bedroom on the first floor; Accessible approach with ramp; Accessible kitchen; Fireplace; Crawl space basement
- Laundry & utility: Washer hookup (main level); Electric dryer hookup
Neighborhood map
What this means for you Summary
Snapshot
- This is a 3-bed/1.5-bath single-family listed at $270k.
Deal economics
- At list price, monthly cash flow is $103 ($1k/yr) — positive.
- The deal already cash-flows at list — no discount required.
- To meet the 1% rule (rent ≥ 1% of price), the offer needs to be $220k (18.5% below list).
- Recommended offer: $220k (18.5% below list) — sets the bar for 1% rule.
- Cap rate 6.7% vs local median 3.4% in Cynthiana — top-decile yield for the area; either an underpriced asset or a hidden risk that comps aren't pricing in. Stress-test before assuming the spread holds.
Location & tenants
- Location reads 74/100 on livability (#113 in KY, #4,911 nationally) — a middle-class / working-renter tenant base. Strengths: cost of living A+, housing A+, health & safety A+; Watch: amenities F, commute F, employment D-.
- Harrison County (town): math 21% / reading 32% proficiency, ranked #133 of 165 in KY (top 81%) — low school quality limits family demand, transient renter base, plan for 1-2y turnover.
- Zoned schools: Eastside Elementary School (math 22% / reading 27%, grade F, #489 of 676 statewide, top 76%, 411 students, 61% FRL); Harrison County Middle School (math 19% / reading 35%, grade F, #172 of 217 statewide, top 80%, 607 students, 58% FRL); Harrison County High School (math 29% / reading 41%, grade F, #74 of 254 statewide, top 29%, 865 students, 46% FRL).
- Market conditions: 96 active listings in the ZIP; 1 comparable units currently listed for rent nearby; 69 units permitted in Harrison County in 2024 (0 in 5+ unit buildings).
Forward outlook
- In year one you build about $29k of equity ($2k loan paydown + $27k appreciation (10.0% local appreciation)).
- Harrison County population projected to shrink 10% by 2050 — rents likely to lag national; underwrite the cash flow, not the appreciation.
- At projected returns (10.0% appreciation + 3.0% rent growth), your $76k cash investment doubles in ~3 years — after that, you're playing with house money.
- By year 2, paydown + projected appreciation supports a ~$46k cash-out refi (75% LTV) — recoverable capital for the next deal without selling this one.
Negotiation context
- It's been on market 68 days — a 6% lower offer ($254k) is reasonable based on typical stale-listing flexibility.
- 4 sale attempts since 6y ago with the ask held roughly flat each time — persistent listings suggest the price (not the market) is what's stuck; bring a comps-based counter.
Risks & watch-outs
- Watch-outs: built in 1955 — expect roof / HVAC / electrical / plumbing capex.
Questions for the listing agent
- It's been on market 68 days. Have you received any prior offers? Is the seller open to a 18% concession, seller financing, or rate buy-down credit?
- Built in 1955 — when were the roof, HVAC, electrical panel, plumbing, and water heater last replaced?
- Why hasn't it sold? Are there any deal-killer items the seller is aware of (foundation, flood, title, zoning, code violations)?
- Is there a deadline driving the sale (1031 exchange, divorce, estate, relocation)? That informs how much negotiation room exists.
- What's the average days-on-market for RENTAL listings here right now (not sales)? A rising rental-DOM trend means longer vacancies and softer asking-rent achievability than the comps imply.
- What's the recent tenant-quality profile in this submarket — average credit score on applications, eviction rate, late-payment / NSF rate, and stable-employment percentage? A property-management company in the area should have these aggregated.
- How much new for-sale + rental construction is in the pipeline within 1–3 miles? Heavy new supply typically softens prices + rents 12–24 months out; constrained supply supports both.
Investment metrics
- 1% rule
- 0.82% ✗
- Cap rate
- 6.75%
- Cash-on-cash
- 1.63%
- DSCR
- 1.07
- GRM
- 10.2
CMA / ARV
- ARV (on-the-fly)
- $175,674
- Comps found
- 12
Show comp detail 12 sales within ~0.75 mi
| Address | Dist | Beds/Ba | Sqft | Sold | Price | $/sf | Match |
|---|---|---|---|---|---|---|---|
| 101 Charlotte Dr | 0.08mi | 3/2.0 | 1,678 (+9%) | 2mo | $250,000 | $149 | 78 |
| 105 Taylor Dr | 0.28mi | 3/1.0 | 1,654 (+7%) | 1mo | $275,000 | $166 | 72 |
| 145 N Elmarch Ave | 0.39mi | 3/1.0 | 1,668 (+8%) | 6mo | $190,000 | $114 | 61 |
| 235 Wilson Ave | 0.47mi | 2/1.0 (-1) | 1,464 (-5%) | 8mo | $160,000 | $109 | 57 |
| 105 Sonley Dr | 0.17mi | 4/2.0 (+1) | 1,677 (+9%) | 18mo | $224,900 | $134 | 55 |
| 115 Vine St | 0.51mi | 2/1.0 (-1) | 1,476 (-4%) | 21mo | $49,000 | $33 | 45 |
| 102 Reynolds Ave | 0.74mi | 2/1.5 (-1) | 1,666 (+8%) | 3mo | $285,000 | $171 | 44 |
| 316 S Elmarch Ave | 0.53mi | 2/1.5 (-1) | 1,721 (+12%) | 9mo | $195,000 | $113 | 44 |
| 114 Battle Grove Ave | 0.59mi | 3/3.0 | 1,635 (+6%) | 21mo | $230,000 | $141 | 39 |
| 412 East Pleasant St | 0.60mi | 2/1.0 (-1) | 1,369 (-11%) | 11mo | $140,000 | $102 | 38 |
| 129 Old Lair Rd | 0.74mi | 3/2.0 | 1,364 (-12%) | 11mo | $146,000 | $107 | 36 |
| 119 Webster Ave | 0.70mi | 2/1.0 (-1) | 1,368 (-11%) | 23mo | $50,000 | $37 | 23 |
Match score weights: distance 35% · size 25% · config 20% · recency 20%. Top-matched comps best support the ARV.
Projected returns pro-forma
10.0% appreciation · 3.0% rent growth · sell at horizon
- IRR
- 25.4%
- Equity multiple
- 3.03×
- Total profit
- $153,420
- Equity at exit
- $243,147
- IRR
- 22.4%
- Equity multiple
- 6.91×
- Total profit
- $446,443
- Equity at exit
- $524,356
Cash invested: $75,572 (down + closing). Projections, not guarantees.
Landlord ↔ Tenant lean methodology
- Overall (STATE)
- 83 Strongly Landlord-Friendly
- State Kentucky
- 83 Strongly Landlord-Friendly · R+16
- County
- — inherits STATE
- City
- — inherits STATE
ZIP-level market 41031
- Home prices YoY
- 4.4%
- Active inventory
- 96
- Price-to-rent
- 10.2×
Monthly cashflow live
- Estimated rent
- $2,200 medium interval (Pro) →
- Mortgage (P&I)
- −$1,415
- Tax from tax record
- −$108 /mo · $1,291/yr
- Insurance
- −$112
- HOA
- −$0
- Vacancy / Maint / Mgmt
- −$462
- Net cashflow
- $103
Break-even live
Sensitivity live
| Price | -10% $255 | -5% $179 | +0% $103 | +5% $26 | +10% $-50 |
|---|---|---|---|---|---|
| Rent | -10% $-71 | -5% $16 | +0% $103 | +5% $189 | +10% $276 |
| Rate | -1.0pp $238 | -0.5pp $171 | base $103 | +0.5pp $33 | +1.0pp $-39 |
UW: 25.0% down · 7.5% · 30yr · 1.5% tax · 5.0% vac · 8.0% maint · 8.0% mgmt
Financing live
Cash to close
- Down payment
- $67,475
- Closing costs
- $8,097
- Reserves months
- —
- Total cash needed
- —
Loan-product check · same deal, 3 products live
Conventional
25% down · 7.5% · 30yr
- Down + closing
- —
- Monthly P&I
- —
- Monthly cashflow
- —
- DSCR
- —
- Eligible?
- —
Personal DTI + credit; lowest rate.
DSCR
20% down · 8.5% · 30yr
- Down + closing
- —
- Monthly P&I
- —
- Monthly cashflow
- —
- DSCR
- —
- Eligible?
- —
No personal income docs; deal must DSCR.
Hard money
10% down · 12.0% · 12mo
- Down + closing
- —
- Monthly P&I
- —
- Monthly cashflow
- —
- DSCR
- —
- Eligible?
- —
Short-term bridge; refi at stabilization.
Rent comps 1 comps
| Address | Beds | Baths | Sqft | Rent | $/sqft | DOM | Units | Dist |
|---|---|---|---|---|---|---|---|---|
| 28 Heron Pl Cynthiana, KY | 2.0 | 2.0 | 1296 | $2,200 | $1.70 | 15d | 1 | 0.63mi |
Listing history 27 events
-
2026-06-21statusdays on market $269,900 Pending 68 DOM
-
2026-06-18days on market $269,900 Active 66 DOM
-
2026-06-17days on market $269,900 Active 65 DOM
-
2026-06-16days on market $269,900 Active 64 DOM
-
2026-06-15days on market $269,900 Active 63 DOM
-
2026-06-14days on market $269,900 Active 61 DOM
-
2026-06-10days on market $269,900 Active 58 DOM
-
2026-06-09days on market $269,900 Active 57 DOM
-
2026-06-08days on market $269,900 Active 56 DOM
-
2026-06-07days on market $269,900 Active 55 DOM
-
2026-06-03days on market $269,900 Active 51 DOM
-
2026-06-02days on market $269,900 Active 50 DOM
-
2026-06-01days on market $269,900 Active 49 DOM
-
2026-05-31days on market $269,900 Active 48 DOM
-
2026-05-31pricedays on market $269,900 Active 47 DOM
-
2026-04-27status Active
-
2026-04-24historical Contingent
-
2026-04-11$275,000 Active
-
2025-06-11soldstatus $240,000
-
2025-06-10soldstatus $240,000 Closed 326-char remark
Show marketing remark (326 chars)
Great location! Well established neighborhood. Come see this charming 3 bedroom/1.5 bath home, large living room with fireplace and gleaming hardwood floor, large eat-in kitchen and den. Large fenced in back yard with a storage shed. This property is meticulous kept. Lots of updates throughout home. Come make me your own.
-
2025-05-16status Pending 326-char remark
Show marketing remark (326 chars)
Great location! Well established neighborhood. Come see this charming 3 bedroom/1.5 bath home, large living room with fireplace and gleaming hardwood floor, large eat-in kitchen and den. Large fenced in back yard with a storage shed. This property is meticulous kept. Lots of updates throughout home. Come make me your own.
-
2025-05-13$249,900 Active 326-char remark
Show marketing remark (326 chars)
Great location! Well established neighborhood. Come see this charming 3 bedroom/1.5 bath home, large living room with fireplace and gleaming hardwood floor, large eat-in kitchen and den. Large fenced in back yard with a storage shed. This property is meticulous kept. Lots of updates throughout home. Come make me your own.
-
2021-01-28soldstatus $179,900 Sold 252-char remark
Show marketing remark (252 chars)
This 1541 sq. ft home is located in the beautiful, quiet neighborhood of Grandview. It is the perfect one level home, move in ready! The property offers a wonderful level back yard space with storage shed. It also features a new roof installed in 2019.
-
2021-01-28soldstatus $179,900
Show marketing remark (252 chars)
This 1541 sq. ft home is located in the beautiful, quiet neighborhood of Grandview. It is the perfect one level home, move in ready! The property offers a wonderful level back yard space with storage shed. It also features a new roof installed in 2019.
-
2020-11-17status Pending 252-char remark
Show marketing remark (252 chars)
This 1541 sq. ft home is located in the beautiful, quiet neighborhood of Grandview. It is the perfect one level home, move in ready! The property offers a wonderful level back yard space with storage shed. It also features a new roof installed in 2019.
-
2020-11-12$179,000 Active 252-char remark
Show marketing remark (252 chars)
This 1541 sq. ft home is located in the beautiful, quiet neighborhood of Grandview. It is the perfect one level home, move in ready! The property offers a wonderful level back yard space with storage shed. It also features a new roof installed in 2019.
-
2006-05-24soldstatus $149,500
ⓘ Source: listings_history table (triggers on properties + properties_extension) + one-shot
backfill from property_details.listing_events for pre-trigger history.
Tax reassessment forecast KY · Resets to sale price
- Current annual tax
- $1,291 · $108/mo
- Projected year-2 tax
- $2,321 · $193/mo
- Expected delta
- +$1,030/yr (+$86/mo · 79.8%)
ⓘ Screening estimate from a state-policy table — verify with the county assessor before closing.
Climate risk First Street
- Flood 1/10 Low FEMA zone X (unshaded) · 0% chance over 30 yrs
- Wildfire 1/10 Low
- Heat 4/10 Moderate 7 d/yr ≥102°F today · 19 d/yr by 30 yrs out
- Wind 2/10 Low 2% chance of damaging wind over 30 yrs
- Air quality 2/10 Low 1 unhealthy d/yr today · 2 by 30 yrs out
Nearby sold comps map
Loading sold comps map…
Walkable amenities ~0.75 mi
Loading nearby amenities…
Taxation est. · year 1
- Rental income
- $26,400
- − Mortgage interest
- −$15,119
- − Property taxes
- −$1,291
- − Insurance
- −$1,350
- − Repairs & maintenance
- −$2,112
- − Management
- −$2,112
- − Depreciation
- −$7,852
- Taxable loss
- −$3,435
- Est. tax savings @ 24.0%
- +$824
- After-tax cash flow
- $2,055/yr
For passive investors: Depreciation is non-cash, so a rental often shows a tax loss while cash-flowing — sheltering income. Rental losses are passive: they offset passive income freely, and up to $25,000/yr can offset ordinary (W-2) income if you actively participate and your MAGI is under $100k (phasing out to $0 by $150k); unused losses carry forward. On sale, claimed depreciation is recaptured at up to 25%, and gains may owe capital-gains tax (a 1031 exchange can defer both). Figures are a year-1 estimate at your 24.0% rate — not tax advice; consult a CPA.
Schools (NCES district)
- District
- Harrison County
- NCES district ID
- 2102580
- Math proficiency
- 21% ▼ -25.00%
- Reading proficiency
- 32% ▼ -19.00%
- Median HH income
- $39,744
- Composite
- 22.28/100
- National rank
- #8138
- State rank
- #133 of 165 in KY
Livability — Cynthiana
- Score
- 74/100
- State rank
- #113
- US rank
- #4911
Category grades
Schools grade is shown separately in the Schools card above.
Census & demographics
- Census place
- Cynthiana, KY
- Population (ZIP)
- 16,748
Population outlook (Harrison County) Hauer SSP2
- Today (2025)
- 18,605 people
- By 2030
- 18,361 · -1.3%
- By 2040
- 17,685 · -4.9%
- By 2050
- 16,845 · -9.5%
- By 2075
- 14,882 · -20.0%
- By 2100
- 12,314 · -33.8%
Race, ethnicity, and origin ACS 2023
- Neighborhood character
- Predominantly White (93%)
- Race & ethnicity
- White 93% Two or more races 4% Hispanic / Latino 2% Black 2%
- Common ancestry
- Slovak 2% Serbian 2% Italian 2%
- Foreign-born
- 1% · Canada
- Languages at home
- 97% English-only · Spanish 1% German/W. Germanic 1%
Political lean MEDSL · Harrison
- 2024 margin
- Solid R (+48.5) · D 25.1% · R 73.6% · Other 1.3%
- 2008→2024 swing
- -27.4pp toward R · 2008: -21.1pp · 2024: -48.5pp
- All cycles
- 2024: R+48.5 2020: R+44.4 2016: R+43.8 2012: R+29.1 2008: R+21.1
Not yet ingested
- Civics
- —
Market trends
- HPI YoY
- ▲ 14.31%
- Current HPI
- 339.482
- Rent YoY
- —
- Metro
- —
- State GDP YoY
- ▲ 1.81%
- F500 in state
- 4
Industry mix (Fortune 500 HQ in KY)
| Industry | F500 HQs | Revenue |
|---|---|---|
| Healthcare | 1 | $118B |
|
||
| Food / Beverage | 1 | $7B |
|
||
Price history
+83.9% since first listed12 events — show timeline
- 2026-04-27 Relisted — ImagineMLS
- 2026-04-24 Contingent — ImagineMLS
- 2026-04-11 Listed $275,000 ImagineMLS
- 2025-06-11 Sold (Public Records) $240,000 Public Records
- 2025-06-10 Sold (MLS) $240,000 ImagineMLS
- 2025-05-16 Pending — ImagineMLS
- 2025-05-13 Listed $249,900 ImagineMLS
- 2021-01-28 Sold (Public Records) $179,900 Public Records
- 2021-01-28 Sold (MLS) $179,900 ImagineMLS
- 2020-11-17 Pending — ImagineMLS
- 2020-11-12 Listed $179,000 ImagineMLS
- 2006-05-24 Sold (Public Records) $149,500 Public Records
Property tax history
-0.1%/yrLatest (2025): $1,291 · -2.7% YoY. Source: county tax records.
Cash-flow waterfall
monthlySold comps — $/sqft
last 12 mo · ≤1 miLoading sold comps…