2392 Douglas Rd #4 · Ferndale, WA
Flood risk No data
- FEMA flood zone
- —
- Chance of flooding over 30 yrs
- —
- Est. flood insurance / yr
- —
Fire risk No data
- Est. fire insurance / yr
- —
Heat risk No data
- Hot days now (above threshold)
- —
- Hot days in 30 yrs
- —
Wind risk No data
- Chance of severe wind over 30 yrs
- —
Air-quality risk No data
- Unhealthy air days now
- —
- Unhealthy air days in 30 yrs
- —
Risk factors via First Street. Map © Google.
Why this score? — see what drove the D+ grade
The composite is a weighted blend of 9 inputs, each scored 0–100. Each bar is that input's sub-score; the figure is the points it added to the 100-point composite (weight × sub-score).
- Cash flow +20.6/30.0
- DSCR +6.5/10.0
- 1% rule +5.4/10.0
- Schools +4.6/10.0
- Livability +4.0/5.0
- Rent growth +3.7/5.0
- Condition / age +2.5/5.0
- ARV discount +0.7/15.0
- Appreciation +0.0/10.0
$174,000
🖨 Deal sheet 📄 Offer letter ✓ Due diligence
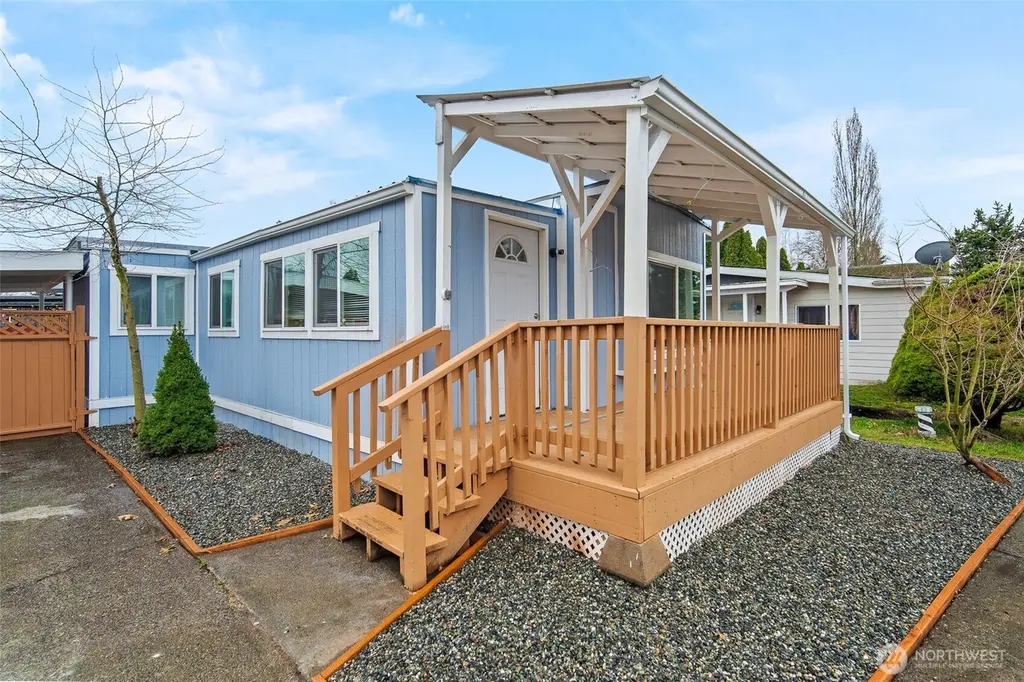
Listing remarks
Great opportunity to own this completely updated charming home. Spacious bright kitchen with lots of cabinets for storage, large living room, new double pain windows, new flooring, new paint, new Led lighting, new decks, move in ready. All new appliances included. Extra parking space, storage shed included. Located in Lamplighter Park, close distance to town amenities, grocery stores and downtown. Buyer must be approved by the park before closing. This is a Must See!!
Key facts
- Bright kitchen
- New flooring
- New paint
Tags
Neighborhood map
What this means for you Summary
Snapshot
- This is a 2-bed/1.0-bath manufactured listed at $174k.
Deal economics
- At list price, monthly cash flow is $232 ($3k/yr) — positive.
- The deal already cash-flows at list — no discount required.
- Meets the 1% rule at list price ($2k rent vs $174k).
- Recommended offer: $158k (9.0% below list) — sets the bar for market timing.
- Cap rate 7.9% vs local median 2.5% in Ferndale — top-decile yield for the area; either an underpriced asset or a hidden risk that comps aren't pricing in. Stress-test before assuming the spread holds.
Location & tenants
- Location reads 81/100 on livability (#79 in WA, #1,471 nationally) — a professional / high-income tenant draw. Strengths: commute A+, health & safety A+, housing A; Watch: amenities F, cost of living D-.
- Ferndale School District (suburban): math 43% / reading 58% proficiency, ranked #138 of 291 in WA (top 47%) — acceptable for families but not a draw, mixed tenant base, ~2y average lease.
- Market conditions: Rents rising fast (+4.8%/yr); 230 active listings in the ZIP; 15 comparable units currently listed for rent nearby; rentals at typical pace (median 21d on market — plan ~3-4 weeks tenant-placement turnaround); 40% of comp listings sitting > 30 days — soft ceiling on asking rent; solid renter incomes; 1,190 units permitted in Whatcom County in 2024 (327 in 5+ unit buildings).
Forward outlook
- Local home prices are declining (-3.0%/yr); year-one equity from $1k of loan paydown is wiped out by about $5k of value loss. Plan a longer hold.
- Whatcom County population projected at +28% by 2050 — long-run rental-demand tailwind backs the buy-and-hold thesis.
Negotiation context
- It's been on market 92 days — a 9% lower offer ($158k) is reasonable based on typical stale-listing flexibility.
Questions for the listing agent
- It's been on market 92 days. Have you received any prior offers? Is the seller open to a 9% concession, seller financing, or rate buy-down credit?
- Built in 1968 — when were the roof, HVAC, electrical panel, plumbing, and water heater last replaced?
- Why hasn't it sold? Are there any deal-killer items the seller is aware of (foundation, flood, title, zoning, code violations)?
- Is there a deadline driving the sale (1031 exchange, divorce, estate, relocation)? That informs how much negotiation room exists.
- Schools are B-rated — typically a magnet for longer-tenancy family renters. What's the average tenant stay here, and is there a school-zone premium baked into asking?
- The area grade is low — what's the realistic commute time and amenity access for the typical tenant pool here? Any planned neighborhood developments (good or bad) we should know about?
- What's the average days-on-market for RENTAL listings here right now (not sales)? A rising rental-DOM trend means longer vacancies and softer asking-rent achievability than the comps imply.
- What's the recent tenant-quality profile in this submarket — average credit score on applications, eviction rate, late-payment / NSF rate, and stable-employment percentage? A property-management company in the area should have these aggregated.
- How much new for-sale + rental construction is in the pipeline within 1–3 miles? Heavy new supply typically softens prices + rents 12–24 months out; constrained supply supports both.
Investment metrics
- 1% rule
- 1.04% ✓
- Cap rate
- 7.89%
- Cash-on-cash
- 5.72%
- DSCR
- 1.25
- GRM
- 8.0
CMA / ARV
- ARV (median comp)
- $151,113
- List price
- $174,000
- Delta
- 15.15%
- Verdict
- OVERPRICED
- Comps
- 2 within 1.0 mi
Projected returns pro-forma
-3.0% appreciation · 4.79% rent growth · sell at horizon
- IRR
- -5.4%
- Equity multiple
- 0.79×
- Total profit
- $-10,054
- Equity at exit
- $25,944
- IRR
- 6.2%
- Equity multiple
- 1.50×
- Total profit
- $24,564
- Equity at exit
- $15,044
Cash invested: $48,720 (down + closing). Projections, not guarantees.
Landlord ↔ Tenant lean methodology
- Overall (STATE)
- 28 Tenant-Leaning
- State Washington
- 28 Tenant-Leaning · D+8
- County
- — inherits STATE
- City
- — inherits STATE
ZIP-level market 98248
- Rents YoY
- 4.8%
- Active inventory
- 230
- Price-to-rent
- 8.0×
Monthly cashflow live
- Estimated rent
- $1,816 high interval (Pro) →
- Mortgage (P&I)
- −$912
- Tax est. 1.5%
- −$218 /mo · $2,610/yr
- Insurance
- −$72
- HOA
- −$0
- Vacancy / Maint / Mgmt
- −$381
- Net cashflow
- $232
Break-even live
UW: 25.0% down · 7.5% · 30yr · 1.5% tax · 5.0% vac · 8.0% maint · 8.0% mgmt
Financing live
Cash to close
- Down payment
- $43,500
- Closing costs
- $5,220
- Reserves months
- —
- Total cash needed
- —
Loan-product check · same deal, 3 products live
Conventional
25% down · 7.5% · 30yr
- Down + closing
- —
- Monthly P&I
- —
- Monthly cashflow
- —
- DSCR
- —
- Eligible?
- —
Personal DTI + credit; lowest rate.
DSCR
20% down · 8.5% · 30yr
- Down + closing
- —
- Monthly P&I
- —
- Monthly cashflow
- —
- DSCR
- —
- Eligible?
- —
No personal income docs; deal must DSCR.
Hard money
10% down · 12.0% · 12mo
- Down + closing
- —
- Monthly P&I
- —
- Monthly cashflow
- —
- DSCR
- —
- Eligible?
- —
Short-term bridge; refi at stabilization.
Rent comps 15 comps
| Address | Beds | Baths | Sqft | Rent | $/sqft | DOM | Units | Dist |
|---|---|---|---|---|---|---|---|---|
| 2375 Main St Unit 2371 203 Ferndale, WA | 2.0 | 2.0 | 986 | $1,675 | $1.70 | 43d | 1 | 0.21mi |
| 2342 Main St Apt 2 Ferndale, WA | 2.0 | 1.0 | 888 | $1,650 | $1.86 | 43d | 1 | 0.29mi |
| 2256 Douglas Rd Apt 1 Ferndale, WA | 2.0 | 1.0 | 802 | $1,500 | $1.87 | 43d | 1 | 0.38mi |
| 2250 Main St Unit 102 Ferndale, WA | 2.0 | 2.0 | 1000 | $1,835 | $1.83 | 21d | 1 | 0.46mi |
| 2325 Ferndale Ter Unit 2331-3 Ferndale, WA | 2.0 | 1.0 | 810 | $1,700 | $2.10 | 13d | 1 | 0.55mi |
| 5752 Legoe Ave #202 Ferndale, WA | 3.0 | 2.0 | 1100 | $1,950 | $1.77 | 43d | 1 | 0.63mi |
| 5739 Fallbrook Ln Unit 101 Ferndale, WA | 2.0 | 1.5 | 1088 | $1,995 | $1.83 | 13d | 1 | 0.65mi |
| 2175 Siddle Loop Unit 103 Ferndale, WA | 2.0 | 2.0 | 1058 | $2,015 | $1.90 | 21d | 1 | 0.70mi |
| 2177 Siddle Loop Unit 103 Ferndale, WA | 2.0 | 2.0 | 1058 | $1,965 | $1.86 | 21d | 1 | 0.71mi |
| 2160 Siddle Loop Unit 103 Ferndale, WA | 2.0 | 2.0 | 1058 | $2,015 | $1.90 | 21d | 1 | 0.76mi |
| 5601 3rd Ave Unit 7 Ferndale, WA | 1.0 | 1.0 | 600 | $1,200 | $2.00 | 13d | 1 | 0.79mi |
| 2127 Siddle St Unit 102 Ferndale, WA | 2.0 | 2.0 | 1003 | $1,890 | $1.88 | 21d | 1 | 0.84mi |
| 5775 Golden Eagle Dr Ferndale, WA | 1.0 | 1.0 | 600 | $1,350 | $2.25 | 43d | 1 | 0.91mi |
| 5731 3rd Ave Unit 101 Ferndale, WA | 2.0 | 1.5 | 1027 | $1,700 | $1.66 | 43d | 1 | 0.98mi |
| 2274 Thornton St Ferndale, WA | 3.0 | 1.0 | 1100 | $2,500 | $2.27 | 13d | 1 | 1.28mi |
Listing history 17 events
-
2026-06-18days on market $174,000 Active 92 DOM
-
2026-06-17days on market $174,000 Active 91 DOM
-
2026-06-16days on market $174,000 Active 90 DOM
-
2026-06-15days on market $174,000 Active 89 DOM
-
2026-06-14days on market $174,000 Active 87 DOM
-
2026-06-13pricedays on market $174,000 Active 86 DOM
-
2026-06-10days on market $184,500 Active 84 DOM
-
2026-06-09days on market $184,500 Active 83 DOM
-
2026-06-08days on market $184,500 Active 82 DOM
-
2026-06-07days on market $184,500 Active 81 DOM
-
2026-06-03days on market $184,500 Active 77 DOM
-
2026-06-02days on market $184,500 Active 76 DOM
-
2026-06-01days on market $184,500 Active 75 DOM
-
2026-05-31days on market $184,500 Active 74 DOM
-
2026-05-30days on market $184,500 Active 73 DOM
-
2026-04-20price $184,500
-
2026-03-18$194,500 Active
ⓘ Source: listings_history table (triggers on properties + properties_extension) + one-shot
backfill from property_details.listing_events for pre-trigger history.
Nearby sold comps map
Loading sold comps map…
Walkable amenities ~0.75 mi
Loading nearby amenities…
Taxation est. · year 1
- Rental income
- $21,792
- − Mortgage interest
- −$9,747
- − Property taxes
- −$2,610
- − Insurance
- −$870
- − Repairs & maintenance
- −$1,743
- − Management
- −$1,743
- − Depreciation
- −$5,062
- Taxable income
- $16
- Est. tax owed @ 24.0%
- −$4
- After-tax cash flow
- $2,782/yr
For passive investors: Depreciation is non-cash, so a rental often shows a tax loss while cash-flowing — sheltering income. Rental losses are passive: they offset passive income freely, and up to $25,000/yr can offset ordinary (W-2) income if you actively participate and your MAGI is under $100k (phasing out to $0 by $150k); unused losses carry forward. On sale, claimed depreciation is recaptured at up to 25%, and gains may owe capital-gains tax (a 1031 exchange can defer both). Figures are a year-1 estimate at your 24.0% rate — not tax advice; consult a CPA.
Schools (NCES district)
- District
- Ferndale School District
- NCES district ID
- 5302850
- Math proficiency
- 43% ▲ 1.00%
- Reading proficiency
- 58% ▲ 4.00%
- Median HH income
- $59,413
- Composite
- 46.06/100
- National rank
- #5494
- State rank
- #138 of 291 in WA
Livability — Ferndale
- Score
- 81/100
- State rank
- #79
- US rank
- #1471
Category grades
Schools grade is shown separately in the Schools card above.
Census & demographics
- Census place
- Ferndale, WA
- County
- Whatcom County · 209,776 people
- City population
- 28,498
- Metro
- Bellingham, WA
- Population (ZIP)
- 28,498
- Household income
- $91,060
- Rent vs Own
- Severe rent burden
- 582.0
Population outlook (Whatcom County) Hauer SSP2
- Today (2025)
- 240,408 people
- By 2030
- 254,667 · +5.9%
- By 2040
- 281,365 · +17.0%
- By 2050
- 307,592 · +27.9%
- By 2075
- 375,576 · +56.2%
- By 2100
- 421,637 · +75.4%
Race, ethnicity, and origin ACS 2023
- Neighborhood character
- Predominantly White (75%)
- Race & ethnicity
- White 75% Hispanic / Latino 11% Two or more races 8% Asian 6% Native American 2%
- Hispanic origin (detail)
- Mexican 7%
- Common ancestry
- Iranian 5% Portuguese 4% Italian 4%
- Foreign-born
- 12% · Canada, China
- Languages at home
- 83% English-only · Spanish 6% Other Indo-European 5% Russian/Polish/Slavic 3%
Political lean MEDSL · Whatcom
- 2024 margin
- Strong D (+24.9) · D 60.8% · R 35.9% · Other 3.3%
- 2008→2024 swing
- +6.9pp toward D · 2008: 18.0pp · 2024: 24.9pp
- All cycles
- 2024: D+24.9 2020: D+23.9 2016: D+17.7 2012: D+12.1 2008: D+18.0
Not yet ingested
- Civics
- —
Market trends
- HPI YoY
- ▼ -427.43%
- Current HPI
- 407.6077
- Rent YoY
- ▲ 4.79%
- Metro
- Bellingham, WA
- State GDP YoY
- ▲ 4.65%
- F500 in state
- 22
Industry mix (Fortune 500 HQ in WA)
| Industry | F500 HQs | Revenue |
|---|---|---|
| Retail | 2 | $269B |
|
||
| Technology / Retail | 1 | $638B |
|
||
| Technology | 1 | $245B |
|
||
| Telecommunications | 1 | $38B |
|
||
| Food / Beverage | 1 | $36B |
|
||
| Automotive / Trucks | 1 | $34B |
|
||
Price history
-5.1% since first listed2 events — show timeline
- 2026-04-20 Price Changed $184,500 NWMLS as Distributed by MLS Grid
- 2026-03-18 Listed $194,500 NWMLS as Distributed by MLS Grid
Property tax history
+9.2%/yrLatest (2026): $181 · +41.5% YoY. Source: county tax records.
Cash-flow waterfall
monthlySold comps — $/sqft
last 12 mo · ≤1 miLoading sold comps…