 Duplex
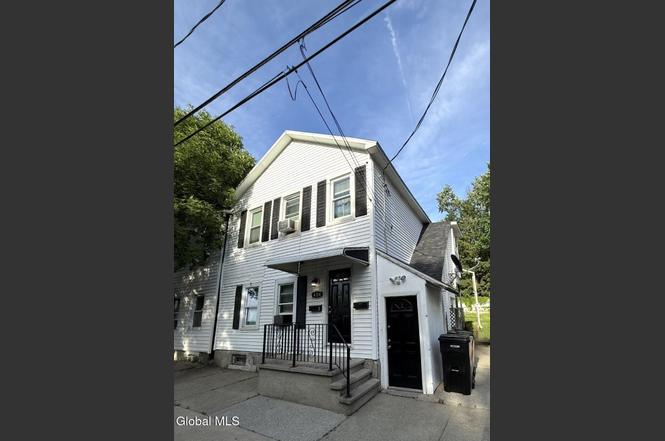
404 8th St · Troy, NY
Flood risk 1/10 · Minimal
- FEMA flood zone
- X
- Chance of flooding over 30 yrs
- 0.0%
- Est. flood insurance / yr
- $473 – $860
Fire risk 3/10 · Minor
- Est. fire insurance / yr
- $691 – $1,283
Heat risk 4/10 · Minor
- Hot days now (above 95°F)
- 7 days/yr
- Hot days in 30 yrs
- 17 days/yr
Wind risk 3/10 · Minor
- Chance of severe wind over 30 yrs
- 6.0%
Air-quality risk 2/10 · Minimal
- Unhealthy air days now
- 0 days/yr
- Unhealthy air days in 30 yrs
- 1 days/yr
Risk factors via First Street. Map © Google.
Why this score? — see what drove the B+ grade
The composite is a weighted blend of 9 inputs, each scored 0–100. Each bar is that input's sub-score; the figure is the points it added to the 100-point composite (weight × sub-score).
- Cash flow +30.0/30.0
- ARV discount +13.8/15.0
- 1% rule +10.0/10.0
- DSCR +10.0/10.0
- Livability +4.0/5.0
- Schools +3.8/10.0
- Rent growth +3.7/5.0
- Condition / age +2.5/5.0
- Appreciation +0.0/10.0
$190,000
🖨 Deal sheet (PDF) 📄 Offer letter ✓ Due diligence
Multi-family units
County records classify this as Multi-Family (2-4 Unit). Listing-text estimate: 2 units. confirmed
Listing remarks MLS
This is a two-family building with recent update of new electric wiring, plumbing and heating system. for the entire house, new plumbing, a newly installed Navieen combi high-efficiency boiler, a tankless water heater, new carpets, and marble floors, and a bath. Garage not included with sale. Shared driveway
Key facts
- Near schools
- Near downtown troy
- Two-family property
Tags
Property features AI
Exterior
- Parking: Off-street parking
- Security: Owned security system; Smoke detectors
- Utilities: Public water; Public sewer
- Home design: Duplex; Total living area approximately 1,936 (unit breakdown not provided)
- Construction: Vinyl siding; Rubber and shingle roofing
- Exterior features: Front porch; Partial fencing; Shed(s); Level, cleared lot
Interior
- Bedrooms: Unit 1: 2 bedrooms (both on the 1st floor); Unit 2: 3 bedrooms (all on the 2nd floor)
- Flooring: Wood; Carpet; Ceramic tile; Laminate
- Bathrooms: Two full bathrooms total; Unit 1: 1 full bathroom (1st floor); Unit 2: 1 full bathroom (2nd floor)
- Heating & cooling: Baseboard heat; Natural gas heating
- Interior features: Wood, carpet, ceramic tile, and laminate flooring; Unfinished basement with interior entry
- Laundry & utility: Laundry area located in a bathroom
Neighborhood map
What this means for you Summary
Snapshot
- This is a 2 × 2-bed/1.0-bath units multifamily listed at $190k.
Deal economics
- At list price, monthly cash flow is $1k ($13k/yr) — positive. Per door: $554/mo.
- The deal already cash-flows at list — no discount required.
- Meets the 1% rule at list price ($3k rent vs $190k).
- Cap rate 13.3% vs local median 5.5% in Troy — top-decile yield for the area; either an underpriced asset or a hidden risk that comps aren't pricing in. Stress-test before assuming the spread holds.
Location & tenants
- Location reads 81/100 on livability (#88 in NY, #1,350 nationally) — a professional / high-income tenant draw. Strengths: amenities A+, commute A+, housing A+; Watch: schools C-, employment C-, crime F.
- Troy City School District (urban): math 44% / reading 46% proficiency, ranked #467 of 590 in NY (top 79%) — families likely to look elsewhere, expect single-tenant / working-renter base with shorter leases; 62% free/reduced lunch — lower-income household profile, screen leases tightly.
- Market conditions: Rents rising fast (+4.9%/yr); 220 active listings in the ZIP; 24 comparable units currently listed for rent nearby; rentals at typical pace (median 21d on market — plan ~3-4 weeks tenant-placement turnaround); solid renter incomes; 405 units permitted in Rensselaer County in 2024 (224 in 5+ unit buildings).
- At $3,065/mo this rent would consume 48% of the median local household income ($76k/yr) (locally 2698% of renters already pay >50% of income on rent) — very limited rent-growth headroom before tenants either downsize or default.
Forward outlook
- Local home prices are declining (-3.0%/yr); year-one equity from $1k of loan paydown is wiped out by about $6k of value loss. Plan a longer hold.
- Rensselaer County population projected to shrink 6% by 2050 — rents likely to lag national; underwrite the cash flow, not the appreciation.
- At projected returns (-3.0% appreciation + 4.9% rent growth), your $53k cash investment doubles in ~5 years — after that, you're playing with house money.
Negotiation context
- Only 5 days on market — expect competitive offers; lowballing is unlikely to land.
- 3 sale attempts since 5y ago with the ask held roughly flat each time — persistent listings suggest the price (not the market) is what's stuck; bring a comps-based counter.
- Current owner paid $140k; 36% above their basis — modest negotiation headroom, anchor on the comps not their cost.
Risks & watch-outs
- Watch-outs: built in 1910 — expect roof / HVAC / electrical / plumbing capex.
Questions for the listing agent
- Can we see the unit-by-unit rent roll, current vacancy, and any below-market leases? What's the average tenancy length?
- What capital expenditures (roof, boiler, parking lot, exteriors) have been made in the last 5 years, and what's planned in the next 2?
- Built in 1910 — when were the roof, HVAC, electrical panel, plumbing, and water heater last replaced?
- Is there a deadline driving the sale (1031 exchange, divorce, estate, relocation)? That informs how much negotiation room exists.
- Crime grade is F in this area — have there been break-ins, vandalism, or insurance claims at this property in the last 3 years? What carrier currently insures it and at what premium?
- What's the average days-on-market for RENTAL listings here right now (not sales)? A rising rental-DOM trend means longer vacancies and softer asking-rent achievability than the comps imply.
- What's the recent tenant-quality profile in this submarket — average credit score on applications, eviction rate, late-payment / NSF rate, and stable-employment percentage? A property-management company in the area should have these aggregated.
- How much new apartment / multifamily construction is in the pipeline within 1–3 miles? Heavy new supply (>2% of stock underway) typically softens rents 12–24 months out; light construction supports rent growth.
Investment metrics
- 1% rule
- 1.61% ✓
- Cap rate
- 13.29%
- Cash-on-cash
- 25.00%
- DSCR
- 2.11
- GRM
- 5.2
CMA / ARV
- ARV (on-the-fly)
- $220,704
- Comps found
- 12
Show comp detail 12 sales within ~0.75 mi
| Address | Dist | Beds/Ba | Sqft | Sold | Price | $/sf | Match |
|---|---|---|---|---|---|---|---|
| 1227 Sausse Ave | 0.20mi | 4/2.0 | 1,944 (+0%) | 7mo | $190,000 | $98 | 84 |
| 55 Oakwood Ave | 0.15mi | 5/2.0 (+1) | 1,980 (+2%) | 7mo | $170,000 | $86 | 79 |
| 1213 Jacob St | 0.53mi | 5/2.0 (+1) | 1,936 (0%) | 1mo | $220,000 | $114 | 69 |
| 6 W Sunnyside Way | 0.41mi | 5/3.0 (+1) | 1,980 (+2%) | 4mo | $242,000 | $122 | 65 |
| 90 9th St | 0.53mi | 4/2.0 | 1,892 (-2%) | 11mo | $225,000 | $119 | 62 |
| 2435 5th Ave | 0.23mi | 3/2.0 (-1) | 1,692 (-13%) | 4mo | $279,900 | $165 | 60 |
| 2205-2207 15th St | 0.56mi | 5/3.5 (+1) | 2,000 (+3%) | 17mo | $351,800 | $176 | 43 |
| 137 Paine St | 0.63mi | 5/2.0 (+1) | 2,090 (+8%) | 11mo | $170,000 | $81 | 43 |
| 23 Glen Ave | 0.68mi | 5/2.0 (+1) | 2,200 (+14%) | 1mo | $95,000 | $43 | 39 |
| 31 Bond St | 0.62mi | 5/2.0 (+1) | 1,676 (-13%) | 8mo | $140,000 | $84 | 37 |
| 25 High St | 0.75mi | 5/2.0 (+1) | 2,116 (+9%) | 12mo | $255,000 | $121 | 35 |
| 3324 6th Ave | 0.71mi | 5/2.0 (+1) | 2,225 (+15%) | 16mo | $199,000 | $89 | 24 |
Match score weights: distance 35% · size 25% · config 20% · recency 20%. Top-matched comps best support the ARV.
Projected returns pro-forma
-3.0% appreciation · 4.88% rent growth · sell at horizon
- IRR
- 20.6%
- Equity multiple
- 1.86×
- Total profit
- $45,753
- Equity at exit
- $28,330
- IRR
- 30.0%
- Equity multiple
- 3.93×
- Total profit
- $156,108
- Equity at exit
- $16,428
Cash invested: $53,200 (down + closing). Projections, not guarantees.
Landlord ↔ Tenant lean methodology
- Overall (STATE)
- 15 Strongly Tenant-Friendly
- State New York
- 15 Strongly Tenant-Friendly · D+10
- County
- — inherits STATE
- City
- — inherits STATE
ZIP-level market 12180
- Home prices YoY
- -33.3%
- Rents YoY
- 4.9%
- Active inventory
- 220
- Price-to-rent
- 10.3×
Monthly cashflow live
- Estimated rent
- $3,065 high interval (Pro) →
- Mortgage (P&I)
- −$996
- Tax est. 1.5%
- −$238 /mo · $2,850/yr
- Insurance
- −$79
- HOA
- −$0
- Vacancy / Maint / Mgmt
- −$644
- Net cashflow
- $1,108
Break-even live
Sensitivity live
| Price | -10% $1,240 | -5% $1,174 | +0% $1,108 | +5% $1,043 | +10% $977 |
|---|---|---|---|---|---|
| Rent | -10% $866 | -5% $987 | +0% $1,108 | +5% $1,229 | +10% $1,350 |
| Rate | -1.0pp $1,204 | -0.5pp $1,157 | base $1,108 | +0.5pp $1,059 | +1.0pp $1,009 |
2-unit breakdown (identical units grouped — click to expand)
| Units | Beds | Baths | Est. rent |
|---|---|---|---|
| 2× units | 2 | 1 | $3,066 |
| #1 | 2 | 1 | $1,533 |
| #2 | 2 | 1 | $1,533 |
| Total (2 units) | $3,065 | ||
UW: 25.0% down · 7.5% · 30yr · 1.5% tax · 5.0% vac · 8.0% maint · 8.0% mgmt
Financing live
Cash to close
- Down payment
- $47,500
- Closing costs
- $5,700
- Reserves months
- —
- Total cash needed
- —
Loan-product check · same deal, 3 products live
Conventional
25% down · 7.5% · 30yr
- Down + closing
- —
- Monthly P&I
- —
- Monthly cashflow
- —
- DSCR
- —
- Eligible?
- —
Personal DTI + credit; lowest rate.
DSCR
20% down · 8.5% · 30yr
- Down + closing
- —
- Monthly P&I
- —
- Monthly cashflow
- —
- DSCR
- —
- Eligible?
- —
No personal income docs; deal must DSCR.
Hard money
10% down · 12.0% · 12mo
- Down + closing
- —
- Monthly P&I
- —
- Monthly cashflow
- —
- DSCR
- —
- Eligible?
- —
Short-term bridge; refi at stabilization.
Rent comps 24 comps
| Address | Beds | Baths | Sqft | Rent | $/sqft | DOM | Units | Dist |
|---|---|---|---|---|---|---|---|---|
| 195 9th St Troy, NY | 3.0 | 2.0 | 1500 | $750 | $0.50 | 20d | 1 | 0.25mi |
| 164 9th St Unit 1 Troy, NY | 4.0 | 2.0 | 1400 | $1,800 | $1.29 | 24d | 1 | 0.34mi |
| 169 Hutton St Unit 1 Troy, NY | 3.0 | 1.0 | 1500 | $595 | $0.40 | 20d | 1 | 0.35mi |
| 136 9th St Unit 2 Troy, NY | 3.0 | 1.0 | 1500 | $600 | $0.40 | 20d | 1 | 0.41mi |
| 136 9th St Unit 1 Troy, NY | 3.0 | 1.0 | 1500 | $595 | $0.40 | 20d | 1 | 0.41mi |
| 136 9th St Unit 3 Troy, NY | 4.0 | 1.0 | 1500 | $595 | $0.40 | 20d | 1 | 0.41mi |
| 2326 15th St Unit 1 Troy, NY | 4.0 | 1.5 | 1500 | $695 | $0.46 | 20d | 1 | 0.44mi |
| 904 Peoples Ave Troy, NY | 4.0 | 1.0 | 1800 | $645 | $0.36 | 20d | 1 | 0.55mi |
| 288 Hoosick St Troy, NY | 3.0 | 1.0 | 1800 | $695 | $0.39 | 20d | 1 | 0.69mi |
| 17 State St Troy, NY | 4.0 | 1.0–1.5 | 1810 | $3,635 | $2.01 | 15d | 7 | 0.98mi |
| 1520 6th Ave Troy, NY | 2.0–4.0 | 2.0–4.0 | 1209 | $1,349 | $1.12 | 24d | 8 | 1.03mi |
| 131 6th Ave Troy, NY | 4.0 | 1.0 | 1400 | $2,325 | $1.66 | 15d | 1 | 1.04mi |
| 97 14th St Unit 2 Troy, NY | 5.0 | 2.0 | 1600 | $625 | $0.39 | 20d | 1 | 1.06mi |
| 97 14th St Troy, NY | 4.0 | 2.0 | 1500 | $650 | $0.43 | 20d | 1 | 1.06mi |
| 88 14th St Unit 2 Troy, NY | 4.0 | 1.0 | 1500 | $650 | $0.43 | 20d | 1 | 1.09mi |
| 79 14th St Unit 1 Troy, NY | 3.0 | 1.0 | 1500 | $650 | $0.43 | 20d | 1 | 1.10mi |
| 157 6th Ave Unit 2 Troy, NY | 3.0 | 1.0 | 1300 | $1,350 | $1.04 | 20d | 1 | 1.10mi |
| 79 14th St Unit 2 Troy, NY | 4.0 | 1.0 | 1500 | $650 | $0.43 | 20d | 1 | 1.11mi |
| 53 13th St Troy, NY | 4.0 | 1.0 | 1500 | $650 | $0.43 | 20d | 1 | 1.11mi |
| 51 14th St Unit 2 Troy, NY | 4.0 | 2.0 | 2000 | $725 | $0.36 | 20d | 1 | 1.17mi |
| 41 Christie St Troy, NY | 5.0 | 2.0 | 1277 | $700 | $0.55 | 15d | 1 | 1.19mi |
| 150 2nd St Troy, NY | 4.0 | 1.5 | 2442 | $3,000 | $1.23 | 22d | 1 | 1.25mi |
| 1708 Highland Ave Unit 3 Troy, NY | 3.0 | 1.0 | 1485 | $595 | $0.40 | 20d | 1 | 1.29mi |
| 1820 Highland Ave Unit 2 Troy, NY | 4.0 | 2.0 | 1680 | $725 | $0.43 | 20d | 1 | 1.33mi |
Listing history 5 events
-
2026-06-21statusdays on market $190,000 Pending 5 DOM
-
2026-06-18days on market $190,000 Active 3 DOM
-
2026-06-17days on market $190,000 Active 2 DOM
-
2026-06-15remarks 527-char remark
-
2026-06-15$190,000 Active 1 DOM
ⓘ Source: listings_history table (triggers on properties + properties_extension) + one-shot
backfill from property_details.listing_events for pre-trigger history.
Climate risk First Street
- Flood 1/10 Low FEMA zone X · 0% chance over 30 yrs
- Wildfire 3/10 Moderate
- Heat 4/10 Moderate 7 d/yr ≥95°F today · 17 d/yr by 30 yrs out
- Wind 3/10 Moderate 6% chance of damaging wind over 30 yrs
- Air quality 2/10 Low 0 unhealthy d/yr today · 1 by 30 yrs out
Nearby sold comps map
Loading sold comps map…
Walkable amenities ~0.75 mi
Loading nearby amenities…
Taxation est. · year 1
- Rental income
- $36,780
- − Mortgage interest
- −$10,643
- − Property taxes
- −$2,850
- − Insurance
- −$950
- − Repairs & maintenance
- −$2,942
- − Management
- −$2,942
- − Depreciation
- −$5,527
- Taxable income
- $10,925
- Est. tax owed @ 24.0%
- −$2,622
- After-tax cash flow
- $10,678/yr
For passive investors: Depreciation is non-cash, so a rental often shows a tax loss while cash-flowing — sheltering income. Rental losses are passive: they offset passive income freely, and up to $25,000/yr can offset ordinary (W-2) income if you actively participate and your MAGI is under $100k (phasing out to $0 by $150k); unused losses carry forward. On sale, claimed depreciation is recaptured at up to 25%, and gains may owe capital-gains tax (a 1031 exchange can defer both). Figures are a year-1 estimate at your 24.0% rate — not tax advice; consult a CPA.
Schools (NCES district)
- District
- Troy City School District
- NCES district ID
- 3628950
- Math proficiency
- 44% ▲ 6.00%
- Reading proficiency
- 46% ▲ 6.00%
- Median HH income
- $42,143
- Composite
- 37.89/100
- National rank
- #4318
- State rank
- #467 of 590 in NY
Livability — Troy
- Score
- 81/100
- State rank
- #88
- US rank
- #1350
Category grades
Schools grade is shown separately in the Schools card above.
Census & demographics
- Census place
- Troy, NY
- County
- Rensselaer County · 75,590 people
- City population
- 53,479
- Metro
- Albany-Schenectady-Troy, NY
- Population (ZIP)
- 53,479
- Household income
- $75,851
- Rent vs Own
- Severe rent burden
- 2698.0
Population outlook (Rensselaer County) Hauer SSP2
- Today (2025)
- 162,400 people
- By 2030
- 161,746 · -0.4%
- By 2040
- 158,095 · -2.7%
- By 2050
- 152,966 · -5.8%
- By 2075
- 140,767 · -13.3%
- By 2100
- 124,727 · -23.2%
Race, ethnicity, and origin ACS 2023
- Neighborhood character
- Predominantly White (70%)
- Race & ethnicity
- White 70% Black 12% Hispanic / Latino 8% Two or more races 8% Asian 5%
- Hispanic origin (detail)
- Mexican 1% Puerto Rican 4%
- Common ancestry
- Romanian 5% Lithuanian 5% Slovak 1%
- Foreign-born
- 10% · Canada, China
- Languages at home
- 88% English-only · Spanish 4% Other Indo-European 2% Arabic 2%
Political lean MEDSL · Rensselaer
- 2024 margin
- Toss-up / Even · D 50.7% · R 49.3%
- 2008→2024 swing
- -8.0pp toward R · 2008: 9.3pp · 2024: 1.4pp
- All cycles
- 2024: D+1.4 2020: D+5.6 2016: R+2.9 2012: D+11.8 2008: D+9.3
Not yet ingested
- Civics
- —
Market trends
- HPI YoY
- ▼ -142.53%
- Current HPI
- 285.0762
- Rent YoY
- ▲ 4.88%
- Metro
- Albany-Schenectady-Troy, NY
- State GDP YoY
- ▲ 2.60%
- F500 in state
- 92
Industry mix (Fortune 500 HQ in NY)
| Industry | F500 HQs | Revenue |
|---|---|---|
| Financial Services | 10 | $950B |
|
||
| Consumer Goods | 9 | $162B |
|
||
| Insurance | 4 | $225B |
|
||
| Telecommunications | 2 | $144B |
|
||
| Pharmaceuticals | 2 | $112B |
|
||
| Media / Entertainment | 2 | $69B |
|
||
Price history
+961.5% since first listed8 events — show timeline
- 2026-06-15 Listed $190,000 Global MLS
- 2023-04-07 Sold (MLS) $140,000 Global MLS
- 2023-03-29 Pending — Global MLS
- 2023-03-02 Pending — Global MLS
- 2023-02-24 Listed $139,000 Global MLS
- 2021-12-14 Pending — Global MLS
- 2021-11-26 Pending — Global MLS
- 2021-11-24 Listed $17,900 Global MLS
Cash-flow waterfall
monthlySold comps — $/sqft
last 12 mo · ≤1 miLoading sold comps…