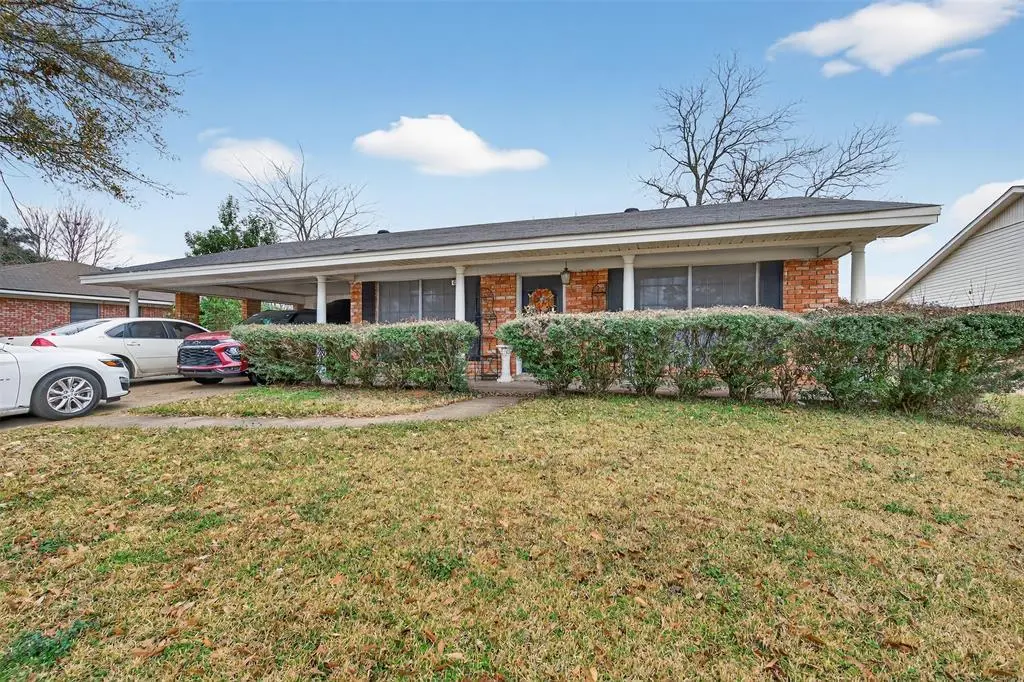
6121 Kathy Ln · Shreveport, LA
Flood risk 1/10 · Minimal
- FEMA flood zone
- AH
- Chance of flooding over 30 yrs
- 0.0%
- Est. flood insurance / yr
- $1,142 – $2,507
Fire risk 1/10 · Minimal
- Est. fire insurance / yr
- $1,269 – $2,357
Heat risk 7/10 · Major
- Hot days now (above 110°F)
- 7 days/yr
- Hot days in 30 yrs
- 22 days/yr
Wind risk 6/10 · Moderate
- Chance of severe wind over 30 yrs
- 68.0%
Air-quality risk 2/10 · Minimal
- Unhealthy air days now
- 1 days/yr
- Unhealthy air days in 30 yrs
- 2 days/yr
Risk factors via First Street. Map © Google.
Why this score? — see what drove the B grade
The composite is a weighted blend of 9 inputs, each scored 0–100. Each bar is that input's sub-score; the figure is the points it added to the 100-point composite (weight × sub-score).
- Cash flow +27.4/30.0
- ARV discount +15.0/15.0
- DSCR +9.6/10.0
- 1% rule +7.4/10.0
- Rent growth +3.5/5.0
- Livability +3.0/5.0
- Condition / age +2.5/5.0
- Schools +2.2/10.0
- Appreciation +0.0/10.0
$139,900
🖨 Deal sheet (PDF) 📄 Offer letter ✓ Due diligence
Listing remarks
4 bedroom, 2 bath with covered patio. In 2023 all of the following was replaced: The floors, the central AC, water heater & the cooktop. The interior was repainted in 2023. This property will not qualify for FHA or VA financing. .. must be Conventional or Cash purchase. Will come with a 1 year Guard Home Warranty with a favorable offer to the seller.
Key facts
- Interior repainted
- Covered patio
- Central ac replaced
Tags
Property features AI
Finance
- Other: Property type: Residential — Single Family Residence; Subdivision: Broadmoor Terrace Sub
- HOA & community: No homeowners association
Exterior
- Parking: Attached carport; 2 covered carport spaces; Driveway
- Utilities: City water; City sewer; Municipal Utility District: No
- Home design: Single family residence; Attached property; Shingle roof
- Construction: Built in 1963; Combination and slab foundation
- Exterior features: Fenced yard; Lot under 0.5 acre
Interior
- Kitchen: Dishwasher; Disposal; Electric cooktop; Electric range
- Bedrooms: 4 bedrooms (primary bedroom on level 1)
- Flooring: Carpet; Vinyl
- Bathrooms: 2 full bathrooms
- Heating & cooling: Central heating (natural gas); Central air (electric)
- Interior features: One-level layout; Other interior features; One living area; One dining area
Neighborhood map
What this means for you Summary
Snapshot
- This is a 4-bed/3.0-bath single-family listed at $140k.
Deal economics
- At list price, monthly cash flow is $258 ($3k/yr) — positive.
- The deal already cash-flows at list — no discount required.
- Meets the 1% rule at list price ($2k rent vs $140k).
- Cap rate 9.8% vs local median 5.6% in Shreveport — top-decile yield for the area; either an underpriced asset or a hidden risk that comps aren't pricing in. Stress-test before assuming the spread holds.
Location & tenants
- Location reads 59/100 on livability (#270 in LA) — a working-class tenant base; expect higher turnover. Strengths: cost of living A+, housing A; Watch: schools D+, crime F, amenities F.
- Caddo Parish (urban): math 21% / reading 32% proficiency, ranked #53 of 98 in LA (top 54%) — low school quality limits family demand, transient renter base, plan for 1-2y turnover; 64% free/reduced lunch — lower-income household profile, screen leases tightly.
- Market conditions: Rents rising (+3.9%/yr); 148 active listings in the ZIP; 11 comparable units currently listed for rent nearby; rentals lingering (median 45d on market — plan ~5-8 weeks vacancy on turnover, expect pricing pressure); 55% of comp listings sitting > 30 days — soft ceiling on asking rent; 221 units permitted in Caddo Parish in 2024 (0 in 5+ unit buildings).
- This rent runs 31% of the median local income ($68k/yr) — at the standard rent-burdened threshold; future hikes will face affordability resistance.
Forward outlook
- Local home prices are declining (-3.0%/yr); year-one equity from $967 of loan paydown is wiped out by about $4k of value loss. Plan a longer hold.
- Caddo County population projected at -15% by 2050 — secular population decline; favor cash flow + early exit over multi-decade hold.
Negotiation context
- Only 8 days on market — expect competitive offers; lowballing is unlikely to land.
- 4 sale attempts since 3y ago with the ask held roughly flat each time — persistent listings suggest the price (not the market) is what's stuck; bring a comps-based counter.
Risks & watch-outs
- Watch-outs: flood insurance adds $152/mo.
- Climate carrying-cost: in FEMA flood zone AH (mandatory federal flood insurance); major wind risk, 68% chance of damaging wind over 30y; extreme-heat days projected 7→22/yr by 2055 (HVAC capex compounding) — expect insurance premiums to compound above CPI over the hold.
Questions for the listing agent
- Built in 1963 — when were the roof, HVAC, electrical panel, plumbing, and water heater last replaced?
- What's the actual annual flood-insurance premium (NFIP or private), and is the property in a SFHA with mandatory coverage?
- Is there a deadline driving the sale (1031 exchange, divorce, estate, relocation)? That informs how much negotiation room exists.
- Schools are D-rated, which usually means shorter tenancies and higher turnover. Who's the typical renter profile here, and what's been the actual vacancy rate?
- Crime grade is F in this area — have there been break-ins, vandalism, or insurance claims at this property in the last 3 years? What carrier currently insures it and at what premium?
- What's the average days-on-market for RENTAL listings here right now (not sales)? A rising rental-DOM trend means longer vacancies and softer asking-rent achievability than the comps imply.
- What's the recent tenant-quality profile in this submarket — average credit score on applications, eviction rate, late-payment / NSF rate, and stable-employment percentage? A property-management company in the area should have these aggregated.
- How much new for-sale + rental construction is in the pipeline within 1–3 miles? Heavy new supply typically softens prices + rents 12–24 months out; constrained supply supports both.
Investment metrics
- 1% rule
- 1.24% ✓
- Cap rate
- 9.81%
- Cash-on-cash
- 12.55%
- DSCR
- 1.56
- GRM
- 6.7
CMA / ARV
- ARV (on-the-fly)
- $204,500
- Comps found
- 12
Show comp detail 12 sales within ~0.75 mi
| Address | Dist | Beds/Ba | Sqft | Sold | Price | $/sf | Match |
|---|---|---|---|---|---|---|---|
| 6121 Kathy Ln | 0.00mi | 4/2.0 | 1,636 (0%) | 1mo | $139,900 | $86 | 96 |
| 6202 Kathy Ln | 0.08mi | 3/2.0 (-1) | 1,607 (-2%) | 9mo | $208,000 | $129 | 77 |
| 351 Fontaine St | 0.28mi | 3/2.0 (-1) | 1,704 (+4%) | 1mo | $225,000 | $132 | 70 |
| 6324 Sand Beach Blvd | 0.22mi | 3/2.0 (-1) | 1,577 (-4%) | 6mo | $199,000 | $126 | 69 |
| 4509 Finley Dr | 0.45mi | 3/2.0 (-1) | 1,597 (-2%) | 4mo | $199,625 | $125 | 63 |
| 4350 Finley Dr | 0.65mi | 3/2.0 (-1) | 1,608 (-2%) | 1mo | $200,000 | $124 | 57 |
| 343 Bellmead St | 0.23mi | 3/1.0 (-1) | 1,438 (-12%) | 1mo | $164,900 | $115 | 56 |
| 5908 Leopold Ln | 0.72mi | 3/2.0 (-1) | 1,649 (+1%) | 5mo | $250,000 | $152 | 52 |
| 4410 Akard Ave | 0.66mi | 3/1.0 (-1) | 1,657 (+1%) | 10mo | $199,900 | $121 | 46 |
| 4506 Orchid St | 0.62mi | 3/2.0 (-1) | 1,490 (-9%) | 6mo | $195,000 | $131 | 42 |
| 4403 Steere Dr | 0.62mi | 3/1.5 (-1) | 1,529 (-6%) | 11mo | $175,000 | $114 | 40 |
| 4419 Norway Dr | 0.70mi | 3/2.0 (-1) | 1,495 (-9%) | 5mo | $187,500 | $125 | 40 |
Match score weights: distance 35% · size 25% · config 20% · recency 20%. Top-matched comps best support the ARV.
Projected returns pro-forma
-3.0% appreciation · 3.93% rent growth · sell at horizon
- IRR
- -3.0%
- Equity multiple
- 0.89×
- Total profit
- $-4,503
- Equity at exit
- $20,860
- IRR
- 7.9%
- Equity multiple
- 1.63×
- Total profit
- $24,559
- Equity at exit
- $12,096
Cash invested: $39,172 (down + closing). Projections, not guarantees.
Landlord ↔ Tenant lean methodology
- Overall (STATE)
- 90 Strongly Landlord-Friendly
- State Louisiana
- 90 Strongly Landlord-Friendly · R+12
- County
- — inherits STATE
- City
- — inherits STATE
ZIP-level market 71105
- Rents YoY
- 3.9%
- Active inventory
- 148
- Price-to-rent
- 6.7×
Monthly cashflow live
- Estimated rent
- $1,741 high interval (Pro) →
- Mortgage (P&I)
- −$734
- Tax from tax record
- −$173 /mo · $2,082/yr
- Insurance
- −$58
- Flood insurance flood zone
- −$152 /mo · $1,824/yr
- HOA
- −$0
- Vacancy / Maint / Mgmt
- −$366
- Net cashflow
- $258
Break-even live
Sensitivity live
| Price | -10% $337 | -5% $297 | +0% $258 | +5% $218 | +10% $178 |
|---|---|---|---|---|---|
| Rent | -10% $120 | -5% $189 | +0% $258 | +5% $326 | +10% $395 |
| Rate | -1.0pp $328 | -0.5pp $293 | base $258 | +0.5pp $221 | +1.0pp $184 |
UW: 25.0% down · 7.5% · 30yr · 1.5% tax · 5.0% vac · 8.0% maint · 8.0% mgmt
Financing live
Cash to close
- Down payment
- $34,975
- Closing costs
- $4,197
- Reserves months
- —
- Total cash needed
- —
Loan-product check · same deal, 3 products live
Conventional
25% down · 7.5% · 30yr
- Down + closing
- —
- Monthly P&I
- —
- Monthly cashflow
- —
- DSCR
- —
- Eligible?
- —
Personal DTI + credit; lowest rate.
DSCR
20% down · 8.5% · 30yr
- Down + closing
- —
- Monthly P&I
- —
- Monthly cashflow
- —
- DSCR
- —
- Eligible?
- —
No personal income docs; deal must DSCR.
Hard money
10% down · 12.0% · 12mo
- Down + closing
- —
- Monthly P&I
- —
- Monthly cashflow
- —
- DSCR
- —
- Eligible?
- —
Short-term bridge; refi at stabilization.
Rent comps 11 comps
| Address | Beds | Baths | Sqft | Rent | $/sqft | DOM | Units | Dist |
|---|---|---|---|---|---|---|---|---|
| 186 Charles Ave Shreveport, LA | 3.0 | 1.0 | 1320 | $1,675 | $1.27 | 22d | 1 | 0.92mi |
| 243 Justin Ave Shreveport, LA | 3.0 | 1.0 | 1236 | $1,400 | $1.13 | 45d | 1 | 0.99mi |
| 154 Southfield Rd Shreveport, LA | 3.0 | 1.0 | 1258 | $1,395 | $1.11 | 45d | 1 | 1.03mi |
| 216 Pennsylvania Ave Shreveport, LA | 3.0 | 1.0 | 1199 | $1,250 | $1.04 | 22d | 1 | 1.15mi |
| 6122 Burgundy Dr Shreveport, LA | 4.0 | 2.0 | 2222 | $2,500 | $1.13 | 45d | 1 | 1.16mi |
| 119 Charles Ave Shreveport, LA | 3.0 | 2.0 | 1518 | $1,800 | $1.19 | 45d | 1 | 1.19mi |
| 204 Leo Ave Shreveport, LA | 4.0 | 2.0 | 1846 | $2,000 | $1.08 | 15d | 1 | 1.28mi |
| 720 Delaware St Shreveport, LA | 3.0 | 2.0 | 1600 | $1,800 | $1.12 | 15d | 1 | 1.28mi |
| 2011 Audubon Pl Shreveport, LA | 3.0 | 2.0 | 1932 | $1,800 | $0.93 | 45d | 1 | 1.43mi |
| 7800 Youree Dr Shreveport, LA | 1.0–3.0 | 1.0–2.0 | 1031 | $1,724 | $1.67 | 15d | 41 | 1.47mi |
| 6002 Henderson Ave Shreveport, LA | 3.0 | 1.0 | 1059 | $1,050 | $0.99 | 45d | 1 | 1.50mi |
Listing history 11 events
-
2026-05-01status Pending
-
2026-04-24status Active
-
2026-04-18status Pending
-
2026-04-16$139,900 Active
-
2026-03-02historical
-
2026-02-12price $174,900
-
2026-02-12$199,900 Active
-
2023-10-20historical $1,395
-
2023-10-02$1,395
-
2022-08-26price $1,395
-
1980-09-29soldstatus
ⓘ Source: listings_history table (triggers on properties + properties_extension) + one-shot
backfill from property_details.listing_events for pre-trigger history.
Tax reassessment forecast LA · Resets to sale price
- Current annual tax
- $2,082 · $173/mo
- Projected year-2 tax
- $2,082 · $173/mo
- Expected delta
- $0/yr ($0/mo · 0.0%)
ⓘ Screening estimate from a state-policy table — verify with the county assessor before closing.
Climate risk First Street
- Flood 1/10 Low FEMA zone AH · 0% chance over 30 yrs
- Wildfire 1/10 Low
- Heat 7/10 Severe 7 d/yr ≥110°F today · 22 d/yr by 30 yrs out
- Wind 6/10 Major 68% chance of damaging wind over 30 yrs
- Air quality 2/10 Low 1 unhealthy d/yr today · 2 by 30 yrs out
Nearby sold comps map
Loading sold comps map…
Walkable amenities ~0.75 mi
Loading nearby amenities…
Taxation est. · year 1
- Rental income
- $20,886
- − Mortgage interest
- −$7,837
- − Property taxes
- −$2,082
- − Insurance
- −$2,524
- − Repairs & maintenance
- −$1,671
- − Management
- −$1,671
- − Depreciation
- −$4,070
- Taxable income
- $1,033
- Est. tax owed @ 24.0%
- −$248
- After-tax cash flow
- $2,843/yr
For passive investors: Depreciation is non-cash, so a rental often shows a tax loss while cash-flowing — sheltering income. Rental losses are passive: they offset passive income freely, and up to $25,000/yr can offset ordinary (W-2) income if you actively participate and your MAGI is under $100k (phasing out to $0 by $150k); unused losses carry forward. On sale, claimed depreciation is recaptured at up to 25%, and gains may owe capital-gains tax (a 1031 exchange can defer both). Figures are a year-1 estimate at your 24.0% rate — not tax advice; consult a CPA.
Schools (NCES district)
- District
- Caddo Parish
- NCES district ID
- 2200300
- Math proficiency
- 21% ▼ -33.00%
- Reading proficiency
- 32% ▼ -30.00%
- Median HH income
- $39,227
- Composite
- 22.23/100
- National rank
- #8148
- State rank
- #53 of 98 in LA
Livability — Shreveport
- Score
- 59/100
- State rank
- #270
- US rank
- #19730
Category grades
Schools grade is shown separately in the Schools card above.
Census & demographics
- Census place
- Shreveport, LA
- County
- Caddo Parish · 178,536 people
- City population
- 164,123
- Metro
- Shreveport-Bossier City, LA
- Population (ZIP)
- 20,179
- Household income
- $67,968
- Rent vs Own
- Severe rent burden
- 1007.0
Population outlook (Caddo County) Hauer SSP2
- Today (2025)
- 243,190 people
- By 2030
- 237,231 · -2.5%
- By 2040
- 222,502 · -8.5%
- By 2050
- 206,516 · -15.1%
- By 2075
- 165,706 · -31.9%
- By 2100
- 122,262 · -49.7%
Race, ethnicity, and origin ACS 2023
- Neighborhood character
- Predominantly White (68%)
- Race & ethnicity
- White 68% Black 20% Two or more races 7% Hispanic / Latino 5% Asian 4%
- Hispanic origin (detail)
- Mexican 2%
- Common ancestry
- Lithuanian 3% Serbian 3% Slovak 2%
- Foreign-born
- 5% · Canada, China
- Languages at home
- 93% English-only · Spanish 2% Other Indo-European 1% Russian/Polish/Slavic 1%
Political lean MEDSL · Caddo
- 2024 margin
- Toss-up / Even · D 51.6% · R 47.0% · Other 1.4%
- 2008→2024 swing
- +1.6pp toward D · 2008: 3.0pp · 2024: 4.6pp
- All cycles
- 2024: D+4.6 2020: D+6.8 2016: D+4.2 2012: D+4.9 2008: D+3.0
Not yet ingested
- Civics
- —
Market trends
- HPI YoY
- ▼ -96.75%
- Current HPI
- 129.572
- Rent YoY
- ▲ 3.93%
- Metro
- Shreveport-Bossier City, LA
- State GDP YoY
- ▲ 3.29%
- F500 in state
- 10
Industry mix (Fortune 500 HQ in LA)
| Industry | F500 HQs | Revenue |
|---|---|---|
| Telecommunications | 2 | $23B |
|
||
| Utilities | 1 | $12B |
|
||
| Wholesale / Distribution | 1 | $5B |
|
||
| Advertising | 1 | $2B |
|
||
Price history
+9928.7% since first listed11 events — show timeline
- 2026-05-01 Pending — NTREIS
- 2026-04-24 Relisted — NTREIS
- 2026-04-18 Pending — NTREIS
- 2026-04-16 Listed $139,900 NTREIS
- 2026-03-02 Listing Removed — NTREIS
- 2026-02-12 Price Changed $174,900 NTREIS
- 2026-02-12 Listed $199,900 NTREIS
- 2023-10-20 Rental Removed $1,395 APPFOLIO
- 2023-10-02 Listed for Rent $1,395 APPFOLIO
- 2022-08-26 Price Changed $1,395 APPFOLIO
- 1980-09-29 Sold (Public Records) — Public Records
Property tax history
-0.1%/yrLatest (2025): $2,082 · +0.4% YoY. Source: county tax records.
Cash-flow waterfall
monthlySold comps — $/sqft
last 12 mo · ≤1 miLoading sold comps…