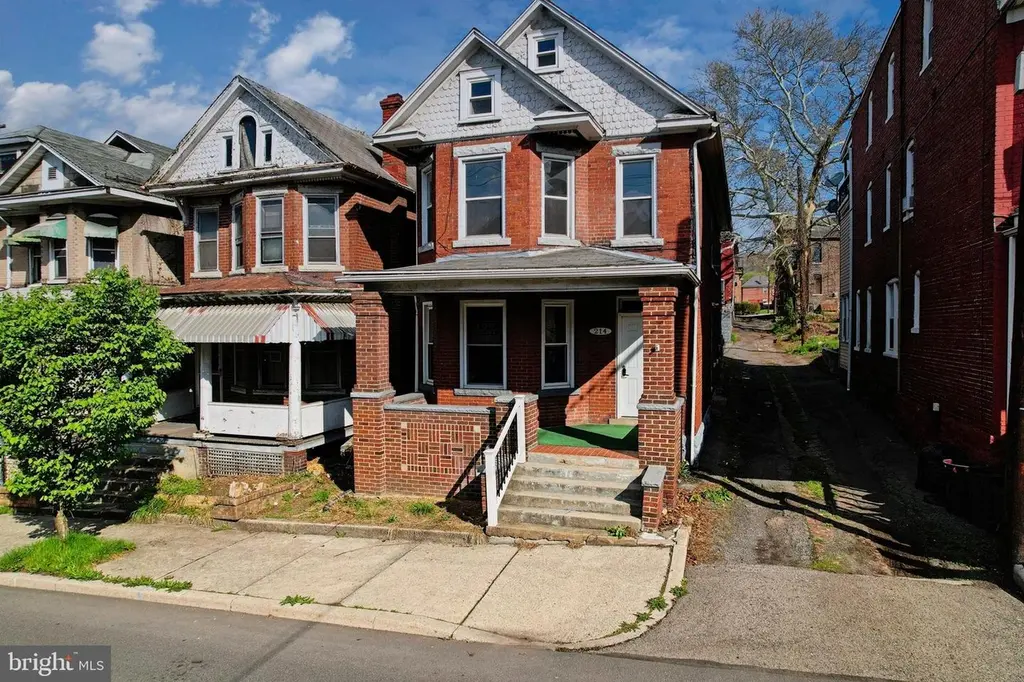
214 S Central Ave · Cumberland, MD
Flood risk 1/10 · Minimal
- FEMA flood zone
- X (unshaded)
- Chance of flooding over 30 yrs
- 0.0%
- Est. flood insurance / yr
- $473 – $860
Fire risk 3/10 · Minor
- Est. fire insurance / yr
- $755 – $1,403
Heat risk 5/10 · Moderate
- Hot days now (above 101°F)
- 7 days/yr
- Hot days in 30 yrs
- 19 days/yr
Wind risk 2/10 · Minimal
- Chance of severe wind over 30 yrs
- —
Air-quality risk 2/10 · Minimal
- Unhealthy air days now
- 0 days/yr
- Unhealthy air days in 30 yrs
- 1 days/yr
Risk factors via First Street. Map © Google.
Why this score? — see what drove the B- grade
The composite is a weighted blend of 9 inputs, each scored 0–100. Each bar is that input's sub-score; the figure is the points it added to the 100-point composite (weight × sub-score).
- Cash flow +30.0/30.0
- DSCR +10.0/10.0
- 1% rule +8.9/10.0
- ARV discount +7.5/15.0
- Rent growth +5.0/5.0
- Livability +3.9/5.0
- Condition / age +2.5/5.0
- Schools +1.9/10.0
- Appreciation +0.0/10.0
$115,000
🖨 Deal sheet (PDF) 📄 Offer letter ✓ Due diligence
Listing remarks MLS
CALLING ALL INVESTORS!!! Unlock the potential of this income-producing triplex in Cumberland, MD! Situated on a corner lot, this property features 3 one-bedroom, one-bath units, with potential for a 4th unit for owner-occupant setup. Each unit includes a stove and refrigerator, and the main-level unit features a newer stove. This property offers natural gas radiator heat, though the radiators do show evidence of needing repair, and ceiling repair work is needed in the main-level kitchen. With the right vision and updates, this could be an excellent opportunity for an investor looking to expand their portfolio or an owner-occupant seeking added rental income. Conveniently located near shopping, restaurants, and medical facilities, this property is also just minutes from Downtown Cumberland’s walking mall, I-68 East and West, the Western Maryland Scenic Railroad, the Great Allegheny Passage, and the C & O Canal towpath. Priced to sell, this is a value-packed investment opportunity with strong upside potential. Call today to schedule your tour!
Key facts
- Newer stove
- Corner lot
- 2,100 sq ft lot
Tags
Neighborhood map
What this means for you Summary
Snapshot
- This is a 9-bed/3.0-bath single-family listed at $115k.
Deal economics
- At list price, monthly cash flow is $560 ($7k/yr) — positive.
- The deal already cash-flows at list — no discount required.
- Meets the 1% rule at list price ($2k rent vs $115k).
- Recommended offer: $108k (6.0% below list) — sets the bar for market timing.
- Cap rate 12.1% vs local median 6.7% in Cumberland — top-decile yield for the area; either an underpriced asset or a hidden risk that comps aren't pricing in. Stress-test before assuming the spread holds.
Location & tenants
- Location reads 78/100 on livability (#64 in MD, #2,385 nationally) — a middle-class / working-renter tenant base. Strengths: amenities A+, commute A+, cost of living A+; Watch: crime F, employment F.
- Allegany County Public Schools (other): math 15% / reading 30% proficiency, ranked #18 of 24 in MD (top 75%) — low school quality limits family demand, transient renter base, plan for 1-2y turnover.
- Zoned schools: West Side Elementary (math 17% / reading 27%, grade F, #297 of 860 statewide, top 38%, 305 students, 69% FRL); Braddock Middle (math 13% / reading 33%, grade F, #122 of 225 statewide, top 54%, 603 students, 60% FRL); Allegany High (math 42% / reading 62%, grade D+, #100 of 222 statewide, top 47%, 684 students, 54% FRL).
- Market conditions: Rents rising fast (+10.9%/yr); 238 active listings in the ZIP; 24 units permitted in Allegany County in 2024 (0 in 5+ unit buildings).
Forward outlook
- Local home prices are declining (-3.0%/yr); year-one equity from $795 of loan paydown is wiped out by about $3k of value loss. Plan a longer hold.
- Allegany County population projected at -14% by 2050 — secular population decline; favor cash flow + early exit over multi-decade hold.
- At projected returns (-3.0% appreciation + 8.0% rent growth), your $32k cash investment doubles in ~5 years — after that, you're playing with house money.
Negotiation context
- It's been on market 79 days — a 6% lower offer ($108k) is reasonable based on typical stale-listing flexibility.
- 12 sale attempts since 16y ago with the ask held roughly flat each time — persistent listings suggest the price (not the market) is what's stuck; bring a comps-based counter.
- Current owner paid $85k; 35% above their basis — modest negotiation headroom, anchor on the comps not their cost.
Risks & watch-outs
- Watch-outs: built in 1915 — expect roof / HVAC / electrical / plumbing capex.
- Climate carrying-cost: extreme-heat days projected 7→19/yr by 2055 (HVAC capex compounding) — expect insurance premiums to compound above CPI over the hold.
Questions for the listing agent
- It's been on market 79 days. Have you received any prior offers? Is the seller open to a 6% concession, seller financing, or rate buy-down credit?
- Built in 1915 — when were the roof, HVAC, electrical panel, plumbing, and water heater last replaced?
- Why hasn't it sold? Are there any deal-killer items the seller is aware of (foundation, flood, title, zoning, code violations)?
- Is there a deadline driving the sale (1031 exchange, divorce, estate, relocation)? That informs how much negotiation room exists.
- Schools are D-rated, which usually means shorter tenancies and higher turnover. Who's the typical renter profile here, and what's been the actual vacancy rate?
- Crime grade is F in this area — have there been break-ins, vandalism, or insurance claims at this property in the last 3 years? What carrier currently insures it and at what premium?
- What's the average days-on-market for RENTAL listings here right now (not sales)? A rising rental-DOM trend means longer vacancies and softer asking-rent achievability than the comps imply.
- What's the recent tenant-quality profile in this submarket — average credit score on applications, eviction rate, late-payment / NSF rate, and stable-employment percentage? A property-management company in the area should have these aggregated.
- How much new for-sale + rental construction is in the pipeline within 1–3 miles? Heavy new supply typically softens prices + rents 12–24 months out; constrained supply supports both.
Investment metrics
- 1% rule
- 1.39% ✓
- Cap rate
- 12.14%
- Cash-on-cash
- 20.87%
- DSCR
- 1.93
- GRM
- 6.0
CMA / ARV
- ARV (median comp)
- $76,078
- List price
- $115,000
- Delta
- 51.16%
- Verdict
- OVERPRICED
- Comps
- 20 within 1.0 mi
Projected returns pro-forma
-3.0% appreciation · 8.0% rent growth · sell at horizon
- IRR
- 18.4%
- Equity multiple
- 1.79×
- Total profit
- $25,418
- Equity at exit
- $17,147
- IRR
- 29.9%
- Equity multiple
- 4.30×
- Total profit
- $106,270
- Equity at exit
- $9,943
Cash invested: $32,200 (down + closing). Projections, not guarantees.
Landlord ↔ Tenant lean methodology
- Overall (STATE)
- 27 Tenant-Leaning
- State Maryland
- 27 Tenant-Leaning · D+14
- County
- — inherits STATE
- City
- — inherits STATE
ZIP-level market 21502
- Home prices YoY
- -17.4%
- Rents YoY
- 10.9%
- Active inventory
- 238
- Price-to-rent
- 6.0×
Monthly cashflow live
- Estimated rent
- $1,595 medium interval (Pro) →
- Mortgage (P&I)
- −$603
- Tax from tax record
- −$49 /mo · $587/yr
- Insurance
- −$48
- HOA
- −$0
- Vacancy / Maint / Mgmt
- −$335
- Net cashflow
- $560
Break-even live
Sensitivity live
| Price | -10% $625 | -5% $592 | +0% $560 | +5% $527 | +10% $495 |
|---|---|---|---|---|---|
| Rent | -10% $434 | -5% $497 | +0% $560 | +5% $623 | +10% $686 |
| Rate | -1.0pp $618 | -0.5pp $589 | base $560 | +0.5pp $530 | +1.0pp $500 |
UW: 25.0% down · 7.5% · 30yr · 1.5% tax · 5.0% vac · 8.0% maint · 8.0% mgmt
Financing live
Cash to close
- Down payment
- $28,750
- Closing costs
- $3,450
- Reserves months
- —
- Total cash needed
- —
Loan-product check · same deal, 3 products live
Conventional
25% down · 7.5% · 30yr
- Down + closing
- —
- Monthly P&I
- —
- Monthly cashflow
- —
- DSCR
- —
- Eligible?
- —
Personal DTI + credit; lowest rate.
DSCR
20% down · 8.5% · 30yr
- Down + closing
- —
- Monthly P&I
- —
- Monthly cashflow
- —
- DSCR
- —
- Eligible?
- —
No personal income docs; deal must DSCR.
Hard money
10% down · 12.0% · 12mo
- Down + closing
- —
- Monthly P&I
- —
- Monthly cashflow
- —
- DSCR
- —
- Eligible?
- —
Short-term bridge; refi at stabilization.
Listing history 50 events
-
2026-06-21days on market $115,000 Active 79 DOM
-
2026-06-19days on market $115,000 Active 77 DOM
-
2026-06-18days on market $115,000 Active 76 DOM
-
2026-06-17days on market $115,000 Active 75 DOM
-
2026-06-16days on market $115,000 Active 74 DOM
-
2026-06-15days on market $115,000 Active 73 DOM
-
2026-06-14days on market $115,000 Active 71 DOM
-
2026-06-12days on market $115,000 Active 70 DOM
-
2026-06-09days on market $115,000 Active 67 DOM
-
2026-06-08days on market $115,000 Active 66 DOM
-
2026-06-07days on market $115,000 Active 65 DOM
-
2026-06-02days on market $115,000 Active 60 DOM
-
2026-06-01days on market $115,000 Active 59 DOM
-
2026-05-31days on market $115,000 Active 58 DOM
-
2026-05-30days on market $115,000 Active 57 DOM
-
2026-04-03$115,000 Active 1068-char remark
Show marketing remark (1068 chars)
CALLING ALL INVESTORS!!! Unlock the potential of this income-producing triplex in Cumberland, MD! Situated on a corner lot, this property features 3 one-bedroom, one-bath units, with potential for a 4th unit for owner-occupant setup. Each unit includes a stove and refrigerator, and the main-level unit features a newer stove. This property offers natural gas radiator heat, though the radiators do show evidence of needing repair, and ceiling repair work is needed in the main-level kitchen. With the right vision and updates, this could be an excellent opportunity for an investor looking to expand their portfolio or an owner-occupant seeking added rental income. Conveniently located near shopping, restaurants, and medical facilities, this property is also just minutes from Downtown Cumberland’s walking mall, I-68 East and West, the Western Maryland Scenic Railroad, the Great Allegheny Passage, and the C & O Canal towpath. Priced to sell, this is a value-packed investment opportunity with strong upside potential. Call today to schedule your tour!
-
2023-08-23soldstatus $85,000
-
2023-07-28soldstatus $85,000 Closed 174-char remark
Show marketing remark (174 chars)
Good investment! Fully occupied 3 units with gross rent of $1,950 per month. Owners pay heat and water. One bedroom and 2 efficiencies included. 24 hour notice for showings.
-
2023-07-17historical Active Under Contract 174-char remark
Show marketing remark (174 chars)
Good investment! Fully occupied 3 units with gross rent of $1,950 per month. Owners pay heat and water. One bedroom and 2 efficiencies included. 24 hour notice for showings.
-
2023-06-12$100,000 Active 174-char remark
Show marketing remark (174 chars)
Good investment! Fully occupied 3 units with gross rent of $1,950 per month. Owners pay heat and water. One bedroom and 2 efficiencies included. 24 hour notice for showings.
-
2023-06-10historical $100,000 174-char remark
Show marketing remark (174 chars)
Good investment! Fully occupied 3 units with gross rent of $1,950 per month. Owners pay heat and water. One bedroom and 2 efficiencies included. 24 hour notice for showings.
-
2015-05-27soldstatus $27,000
-
2015-05-22soldstatus $27,000 Sold
-
2015-05-22soldstatus $27,000
-
2015-04-10status Contract
-
2015-04-06historical
-
2015-03-13price $29,900
-
2015-01-28$34,900 Active
-
2015-01-28$29,900
-
2014-12-05historical
-
2014-12-05historical Expired
-
2014-08-22price
-
2014-04-08Active
-
2014-04-08$39,900
-
2011-11-28soldstatus $32,000 Sold
-
2011-11-28soldstatus $32,000
-
2011-09-06historical
-
2011-09-06historical
-
2011-09-05status Contract
-
2011-09-04status Contract
-
2011-09-04historical
-
2011-02-21Active
-
2011-02-21$41,540
-
2011-02-10$41,540 Active
-
2011-02-10$41,540
-
2011-01-10historical
-
2011-01-10historical Expired
-
2010-11-04price
-
2010-08-24price
-
2010-07-13Active
ⓘ Source: listings_history table (triggers on properties + properties_extension) + one-shot
backfill from property_details.listing_events for pre-trigger history.
Tax reassessment forecast MD · Partial reset (capped growth)
- Current annual tax
- $587 · $49/mo
- Projected year-2 tax
- $920 · $77/mo
- Expected delta
- +$333/yr (+$28/mo · 56.7%)
ⓘ Screening estimate from a state-policy table — verify with the county assessor before closing.
Climate risk First Street
- Flood 1/10 Low FEMA zone X (unshaded) · 0% chance over 30 yrs
- Wildfire 3/10 Moderate
- Heat 5/10 Major 7 d/yr ≥101°F today · 19 d/yr by 30 yrs out
- Wind 2/10 Low
- Air quality 2/10 Low 0 unhealthy d/yr today · 1 by 30 yrs out
Nearby sold comps map
Loading sold comps map…
Walkable amenities ~0.75 mi
Loading nearby amenities…
Taxation est. · year 1
- Rental income
- $19,136
- − Mortgage interest
- −$6,442
- − Property taxes
- −$587
- − Insurance
- −$575
- − Repairs & maintenance
- −$1,531
- − Management
- −$1,531
- − Depreciation
- −$3,345
- Taxable income
- $5,125
- Est. tax owed @ 24.0%
- −$1,230
- After-tax cash flow
- $5,489/yr
For passive investors: Depreciation is non-cash, so a rental often shows a tax loss while cash-flowing — sheltering income. Rental losses are passive: they offset passive income freely, and up to $25,000/yr can offset ordinary (W-2) income if you actively participate and your MAGI is under $100k (phasing out to $0 by $150k); unused losses carry forward. On sale, claimed depreciation is recaptured at up to 25%, and gains may owe capital-gains tax (a 1031 exchange can defer both). Figures are a year-1 estimate at your 24.0% rate — not tax advice; consult a CPA.
Schools (NCES district)
- District
- Allegany County Public Schools
- NCES district ID
- 2400030
- Math proficiency
- 15% ▼ -26.00%
- Reading proficiency
- 30% ▼ -20.00%
- Median HH income
- $39,760
- Composite
- 18.95/100
- National rank
- #8854
- State rank
- #18 of 24 in MD
Livability — Cumberland
- Score
- 78/100
- State rank
- #64
- US rank
- #2385
Category grades
Schools grade is shown separately in the Schools card above.
Census & demographics
- Census place
- Cumberland, MD
- County
- Allegany County · 41,015 people
- City population
- 41,015
- Metro
- Cumberland, MD-WV
- Population (ZIP)
- 41,015
- Household income
- $60,725
- Rent vs Own
- Severe rent burden
- 824.0
Population outlook (Allegany County) Hauer SSP2
- Today (2025)
- 68,778 people
- By 2030
- 66,766 · -2.9%
- By 2040
- 62,784 · -8.7%
- By 2050
- 59,179 · -14.0%
- By 2075
- 50,732 · -26.2%
- By 2100
- 40,837 · -40.6%
Race, ethnicity, and origin ACS 2023
- Neighborhood character
- Predominantly White (83%)
- Race & ethnicity
- White 83% Black 9% Two or more races 5% Hispanic / Latino 2%
- Common ancestry
- Slovak 3% Romanian 2% Italian 1%
- Foreign-born
- 2% · Canada
- Languages at home
- 96% English-only · Spanish 2%
Political lean MEDSL · Allegany
- 2024 margin
- Solid R (+40.3) · D 28.9% · R 69.2% · Other 2.0%
- 2008→2024 swing
- -14.4pp toward R · 2008: -25.9pp · 2024: -40.3pp
- All cycles
- 2024: R+40.3 2020: R+38.3 2016: R+48.0 2012: R+32.9 2008: R+25.9
Not yet ingested
- Civics
- —
Market trends
- HPI YoY
- ▼ -54.33%
- Current HPI
- 258.6676
- Rent YoY
- ▲ 10.88%
- Metro
- Cumberland, MD-WV
- State GDP YoY
- ▲ 2.97%
- F500 in state
- 12
Industry mix (Fortune 500 HQ in MD)
| Industry | F500 HQs | Revenue |
|---|---|---|
| Aerospace / Defense | 1 | $71B |
|
||
| Utilities | 1 | $25B |
|
||
| Hotels | 1 | $24B |
|
||
| Consumer Goods | 1 | $7B |
|
||
| Real Estate | 1 | $6B |
|
||
| Chemicals | 1 | $2B |
|
||
Price history
+113.4% since first listed36 events — show timeline
- 2026-04-03 Listed $115,000 BRIGHT MLS
- 2023-08-23 Sold (Public Records) $85,000 Public Records
- 2023-07-28 Sold (MLS) $85,000 BRIGHT MLS
- 2023-07-17 Contingent — BRIGHT MLS
- 2023-06-12 Listed $100,000 BRIGHT MLS
- 2023-06-10 Coming Soon $100,000 BRIGHT MLS
- 2015-05-27 Sold (Public Records) $27,000 Public Records
- 2015-05-22 Sold (MLS) $27,000 BRIGHT MLS
- 2015-05-22 Sold (MLS) $27,000 MRIS
- 2015-04-10 Pending — MRIS
- 2015-04-06 Listing Removed — BRIGHT MLS
- 2015-03-13 Price Changed $29,900 MRIS
- 2015-01-28 Listed $34,900 MRIS
- 2015-01-28 Listed $29,900 BRIGHT MLS
- 2014-12-05 Delisted — MRIS
- 2014-12-05 Listing Removed — BRIGHT MLS
- 2014-08-22 Price Changed — MRIS
- 2014-04-08 Listed — MRIS
- 2014-04-08 Listed $39,900 BRIGHT MLS
- 2011-11-28 Sold (MLS) $32,000 BRIGHT MLS
- 2011-11-28 Sold (MLS) $32,000 MRIS
- 2011-09-06 Delisted — MRIS
- 2011-09-06 Listing Removed — BRIGHT MLS
- 2011-09-05 Pending — MRIS
- 2011-09-04 Pending — MRIS
- 2011-09-04 Listing Removed — BRIGHT MLS
- 2011-02-21 Listed — MRIS
- 2011-02-21 Listed $41,540 BRIGHT MLS
- 2011-02-10 Listed $41,540 MRIS
- 2011-02-10 Listed $41,540 BRIGHT MLS
- 2011-01-10 Listing Removed — BRIGHT MLS
- 2011-01-10 Delisted — MRIS
- 2010-11-04 Price Changed — MRIS
- 2010-08-24 Price Changed — MRIS
- 2010-07-13 Listed — MRIS
- 2010-07-13 Listed $53,900 BRIGHT MLS
Property tax history
+2.7%/yrLatest (2025): $587 · +14.1% YoY. Source: county tax records.
Cash-flow waterfall
monthlySold comps — $/sqft
last 12 mo · ≤1 miLoading sold comps…