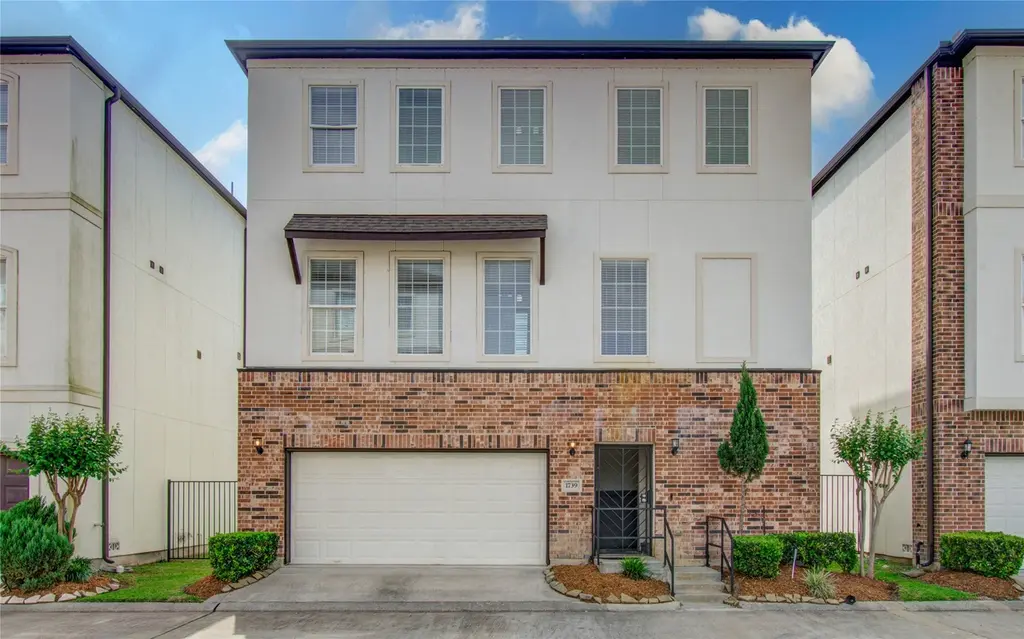
1739 Dominica Dr · Houston, TX
Flood risk 6/10 · Moderate
- FEMA flood zone
- X (shaded)
- Chance of flooding over 30 yrs
- 0.69%
- Est. flood insurance / yr
- $507 – $1,088
Fire risk 1/10 · Minimal
- Est. fire insurance / yr
- $1,222 – $2,270
Heat risk 9/10 · Severe
- Hot days now (above 110°F)
- 7 days/yr
- Hot days in 30 yrs
- 25 days/yr
Wind risk 9/10 · Severe
- Chance of severe wind over 30 yrs
- 99.0%
Air-quality risk 3/10 · Minor
- Unhealthy air days now
- 3 days/yr
- Unhealthy air days in 30 yrs
- 3 days/yr
Risk factors via First Street. Map © Google.
Why this score? — see what drove the D+ grade
The composite is a weighted blend of 9 inputs, each scored 0–100. Each bar is that input's sub-score; the figure is the points it added to the 100-point composite (weight × sub-score).
- ARV discount +15.0/15.0
- Cash flow +7.7/30.0
- 1% rule +5.3/10.0
- Appreciation +5.2/10.0
- Schools +3.9/10.0
- Livability +3.7/5.0
- Rent growth +2.5/5.0
- Condition / age +2.5/5.0
- DSCR +1.8/10.0
$265,500
🖨 Deal sheet (PDF) 📄 Offer letter ✓ Due diligence
Listing remarks
Beautiful 4-bedroom, 3.5-bath home located near the scenic Lake Houston area, offering the perfect blend of nature and convenience. Enjoy nearby boating, fishing, and outdoor activities while still being within approximately 30 minutes of IAH Airport. Major shopping and dining destinations including Costco, H-E-B, and everyday conveniences are all within about 20 minutes. This well-maintained home features a spacious and functional layout, ideal for comfortable everyday living and entertaining. A great opportunity to enjoy peaceful living with easy access to the city and modern conveniences.
Key facts
- 2,840 sq ft lot
- 2 garage spots
- Built 2019
Property features AI
Finance
- HOA & community: Villas at Kings Harbor HOA with a $155 monthly fee
Exterior
- Parking: Attached 2-car garage
- Utilities: Public water; Public sewer
- Home design: Residential property; Built in 2019; Slab foundation; Tile roof
- Construction: Wood siding construction
- Exterior features: Subdivision lot
Interior
- Kitchen: Dishwasher; Disposal; Microwave
- Bedrooms: Primary bedroom on the second level; Three additional bedrooms on the third level
- Bathrooms: 3 full bathrooms; 1 half bathroom
- Heating & cooling: Central heating (electric); Central air conditioning (electric)
- Interior features: Dishwasher; Disposal; Microwave
Neighborhood map
What this means for you Summary
Snapshot
- This is a 4-bed/3.5-bath single-family listed at $266k.
Deal economics
- At list price, monthly cash flow is $-303 ($-4k/yr) — negative.
- To cash-flow at today's rent, offer at most $212k (20.2% below list).
- Meets the 1% rule at list price ($3k rent vs $266k).
- Recommended offer: $212k (20.2% below list) — sets the bar for cash-flow.
- Cap rate 4.9% vs local median 3.2% in Houston — top-decile yield for the area; either an underpriced asset or a hidden risk that comps aren't pricing in. Stress-test before assuming the spread holds.
Location & tenants
- Location reads 74/100 on livability (#184 in TX, #4,771 nationally) — a middle-class / working-renter tenant base. Strengths: amenities A+, cost of living A+, housing A+; Watch: crime F.
- Humble ISD (urban): math 38% / reading 44% proficiency, ranked #262 of 826 in TX (top 32%) — families likely to look elsewhere, expect single-tenant / working-renter base with shorter leases.
- Zoned schools: Deerwood El (math 43% / reading 59%, grade C-, #818 of 4,322 statewide, top 19%, 690 students, 23% FRL); Riverwood Middle (math 77% / reading 63%, grade A, #58 of 1,662 statewide, top 4%, 1,135 students, 12% FRL); Kingwood H S (math 60% / reading 71%, grade B, #193 of 1,632 statewide, top 12%, 2,898 students, 16% FRL) — zoned schools average 17% FRL vs 32% district-wide (15 pts lower); this property's tenant base skews higher-income than the district average.
- Zoned-school proficiency averages 62% at this address vs 41% district-wide (+21 pts) — the actual schools serving this property are materially stronger than the Humble ISD average implies; a family-tenant draw the district grade alone would hide.
- Market conditions: 189 active listings in the ZIP; 8 comparable units currently listed for rent nearby; rentals at typical pace (median 26d on market — plan ~3-4 weeks tenant-placement turnaround); high-income renter base; 29,883 units permitted in Harris County in 2024 (8,621 in 5+ unit buildings).
Forward outlook
- In year one you build about $3k of equity ($2k loan paydown + $1k appreciation (0.5% local appreciation)).
- Harris County population projected at +47% by 2050 — long-run rental-demand tailwind backs the buy-and-hold thesis.
- By year 9, paydown + projected appreciation supports a ~$31k cash-out refi (75% LTV) — recoverable capital for the next deal without selling this one.
Negotiation context
- It's been on market 33 days — a 3% lower offer ($258k) is reasonable based on typical stale-listing flexibility.
- 3 sale attempts since 2y ago with the ask held roughly flat each time — persistent listings suggest the price (not the market) is what's stuck; bring a comps-based counter.
Risks & watch-outs
- Watch-outs: property tax is 3.1% of price.
- Climate carrying-cost: major flood risk; severe wind risk, 99% chance of damaging wind over 30y; extreme-heat days projected 7→25/yr by 2055 (HVAC capex compounding) — expect insurance premiums to compound above CPI over the hold.
Questions for the listing agent
- What do current leases actually rent for vs. the listed asking? Can we see a recent rent roll and the last 12 months of T-12 income?
- It's been on market 33 days. Have you received any prior offers? Is the seller open to a 20% concession, seller financing, or rate buy-down credit?
- Property tax is high relative to price — has the assessment been appealed recently, and will the sale trigger a re-assessment?
- What does the HOA fee cover, when was the last increase, and are there any pending special assessments or reserve-fund shortfalls?
- Is there a deadline driving the sale (1031 exchange, divorce, estate, relocation)? That informs how much negotiation room exists.
- Schools are D-rated, which usually means shorter tenancies and higher turnover. Who's the typical renter profile here, and what's been the actual vacancy rate?
- Crime grade is F in this area — have there been break-ins, vandalism, or insurance claims at this property in the last 3 years? What carrier currently insures it and at what premium?
- The area grade is low — what's the realistic commute time and amenity access for the typical tenant pool here? Any planned neighborhood developments (good or bad) we should know about?
- What's the average days-on-market for RENTAL listings here right now (not sales)? A rising rental-DOM trend means longer vacancies and softer asking-rent achievability than the comps imply.
- What's the recent tenant-quality profile in this submarket — average credit score on applications, eviction rate, late-payment / NSF rate, and stable-employment percentage? A property-management company in the area should have these aggregated.
- How much new for-sale + rental construction is in the pipeline within 1–3 miles? Heavy new supply typically softens prices + rents 12–24 months out; constrained supply supports both.
Investment metrics
- 1% rule
- 1.03% ✓
- Cap rate
- 4.92%
- Cash-on-cash
- -4.90%
- DSCR
- 0.78
- GRM
- 8.1
CMA / ARV
- ARV (median comp)
- $397,668
- List price
- $265,500
- Delta
- -33.24%
- Verdict
- UNDERPRICED
- Comps
- 20 within 1.0 mi
Show comp detail 1 sale within ~0.75 mi
| Address | Dist | Beds/Ba | Sqft | Sold | Price | $/sf | Match |
|---|---|---|---|---|---|---|---|
| 1739 Dominica Dr | 0.00mi | 4/3.5 | 2,392 (0%) | 0mo | $265,500 | $111 | 100 |
Match score weights: distance 35% · size 25% · config 20% · recency 20%. Top-matched comps best support the ARV.
Projected returns pro-forma
0.45% appreciation · 3.0% rent growth · sell at horizon
- IRR
- -5.8%
- Equity multiple
- 0.72×
- Total profit
- $-20,960
- Equity at exit
- $83,153
- IRR
- 0.0%
- Equity multiple
- 1.00×
- Total profit
- $24
- Equity at exit
- $104,928
Cash invested: $74,340 (down + closing). Projections, not guarantees.
Landlord ↔ Tenant lean methodology
- Overall (STATE)
- 87 Strongly Landlord-Friendly
- State Texas
- 87 Strongly Landlord-Friendly · R+5
- County
- — inherits STATE
- City
- — inherits STATE
ZIP-level market 77345
- Home prices YoY
- 0.2%
- Active inventory
- 189
- Price-to-rent
- 8.1×
Monthly cashflow live
- Estimated rent
- $2,748 high interval (Pro) →
- Mortgage (P&I)
- −$1,392
- Tax from tax record
- −$678 /mo · $8,140/yr
- Insurance
- −$111
- HOA
- −$293
- Vacancy / Maint / Mgmt
- −$577
- Net cashflow
- $-303
Break-even live
Sensitivity live
| Price | -10% $-153 | -5% $-228 | +0% $-303 | +5% $-379 | +10% $-454 |
|---|---|---|---|---|---|
| Rent | -10% $-520 | -5% $-412 | +0% $-303 | +5% $-195 | +10% $-86 |
| Rate | -1.0pp $-170 | -0.5pp $-236 | base $-303 | +0.5pp $-372 | +1.0pp $-442 |
UW: 25.0% down · 7.5% · 30yr · 1.5% tax · 5.0% vac · 8.0% maint · 8.0% mgmt
Financing live
Cash to close
- Down payment
- $66,375
- Closing costs
- $7,965
- Reserves months
- —
- Total cash needed
- —
Loan-product check · same deal, 3 products live
Conventional
25% down · 7.5% · 30yr
- Down + closing
- —
- Monthly P&I
- —
- Monthly cashflow
- —
- DSCR
- —
- Eligible?
- —
Personal DTI + credit; lowest rate.
DSCR
20% down · 8.5% · 30yr
- Down + closing
- —
- Monthly P&I
- —
- Monthly cashflow
- —
- DSCR
- —
- Eligible?
- —
No personal income docs; deal must DSCR.
Hard money
10% down · 12.0% · 12mo
- Down + closing
- —
- Monthly P&I
- —
- Monthly cashflow
- —
- DSCR
- —
- Eligible?
- —
Short-term bridge; refi at stabilization.
Rent comps 8 comps
| Address | Beds | Baths | Sqft | Rent | $/sqft | DOM | Units | Dist |
|---|---|---|---|---|---|---|---|---|
| 1721 Dominica Dr Kingwood, TX | 4.0 | 3.0 | 2870 | $2,450 | $0.85 | 45d | 1 | 0.04mi |
| 6731 Auburn Oak Trl Humble, TX | 3.0 | 2.5 | 2433 | $2,345 | $0.96 | 23d | 1 | 1.19mi |
| 19706 Water Point Trl Humble, TX | 4.0 | 2.5 | 2753 | $2,550 | $0.93 | 26d | 1 | 1.22mi |
| 20707 Redbud Trl Humble, TX | 3.0 | 2.5 | 1965 | $2,450 | $1.25 | 23d | 1 | 1.24mi |
| 20823 Water Point Trl Humble, TX | 4.0 | 3.5 | 2550 | $2,525 | $0.99 | 23d | 1 | 1.27mi |
| 20906 Greenfield Trl Humble, TX | 4.0 | 3.0 | 2603 | $2,200 | $0.85 | 45d | 1 | 1.28mi |
| 20914 Lake Park Trl Humble, TX | 5.0 | 2.5 | 2462 | $2,460 | $1.00 | 7d | 1 | 1.29mi |
| 20618 Carmine Oak Ct Humble, TX | 3.0 | 2.0 | 2087 | $2,195 | $1.05 | 45d | 1 | 1.49mi |
HOA detail
- Monthly dues
- $293 · $3,516/yr
Listing history 13 events
-
2026-06-09days on market $265,500 Pending 33 DOM
-
2026-06-08days on market $265,500 Pending 32 DOM
-
2026-06-07days on market $265,500 Pending 31 DOM
-
2026-06-04days on market $265,500 Pending 28 DOM
-
2026-06-03days on market $265,500 Pending 27 DOM
-
2026-06-02statusdays on market $265,500 Pending 26 DOM
-
2026-06-01days on market $265,500 Active 25 DOM
-
2026-05-31days on market $265,500 Active 24 DOM
-
2026-05-07$265,500 Active 598-char remark
-
2025-01-13historical $2,400
-
2025-01-11$2,400
-
2025-01-11historical $2,400
-
2024-12-03$2,400
ⓘ Source: listings_history table (triggers on properties + properties_extension) + one-shot
backfill from property_details.listing_events for pre-trigger history.
Tax reassessment forecast TX · Resets to sale price
- Current annual tax
- $8,140 · $678/mo
- Projected year-2 tax
- $8,140 · $678/mo
- Expected delta
- $0/yr ($0/mo · 0.0%)
ⓘ Screening estimate from a state-policy table — verify with the county assessor before closing.
Climate risk First Street
- Flood 6/10 Major FEMA zone X (shaded) · 69% chance over 30 yrs
- Wildfire 1/10 Low
- Heat 9/10 Extreme 7 d/yr ≥110°F today · 25 d/yr by 30 yrs out
- Wind 9/10 Extreme 99% chance of damaging wind over 30 yrs
- Air quality 3/10 Moderate 3 unhealthy d/yr today · 3 by 30 yrs out
Nearby sold comps map
Loading sold comps map…
Walkable amenities ~0.75 mi
Loading nearby amenities…
Taxation est. · year 1
- Rental income
- $32,975
- − Mortgage interest
- −$14,872
- − Property taxes
- −$8,140
- − Insurance
- −$1,328
- − Repairs & maintenance
- −$2,638
- − Management
- −$2,638
- − HOA
- −$3,516
- − Depreciation
- −$7,724
- Taxable loss
- −$7,880
- Est. tax savings @ 24.0%
- +$1,891
- After-tax cash flow
- $-1,750/yr
For passive investors: Depreciation is non-cash, so a rental often shows a tax loss while cash-flowing — sheltering income. Rental losses are passive: they offset passive income freely, and up to $25,000/yr can offset ordinary (W-2) income if you actively participate and your MAGI is under $100k (phasing out to $0 by $150k); unused losses carry forward. On sale, claimed depreciation is recaptured at up to 25%, and gains may owe capital-gains tax (a 1031 exchange can defer both). Figures are a year-1 estimate at your 24.0% rate — not tax advice; consult a CPA.
Schools (NCES district)
- District
- Humble ISD
- NCES district ID
- 4823910
- Math proficiency
- 38% ▼ -11.00%
- Reading proficiency
- 44% ▼ -7.00%
- Median HH income
- $83,946
- Composite
- 38.55/100
- National rank
- #4171
- State rank
- #262 of 826 in TX
Livability — Houston
- Score
- 74/100
- State rank
- #184
- US rank
- #4771
Category grades
Schools grade is shown separately in the Schools card above.
Census & demographics
- Census place
- Houston, TX
- County
- Harris County · 4,702,590 people
- City population
- 3,226,434
- Metro
- Houston-The Woodlands-Sugar Land, TX
- Population (ZIP)
- 27,917
- Household income
- $150,742
- Rent vs Own
- Severe rent burden
- 307.0
Population outlook (Harris County) Hauer SSP2
- Today (2025)
- 5,571,493 people
- By 2030
- 6,089,821 · +9.3%
- By 2040
- 7,142,806 · +28.2%
- By 2050
- 8,185,864 · +46.9%
- By 2075
- 10,574,329 · +89.8%
- By 2100
- 12,109,958 · +117.4%
Race, ethnicity, and origin ACS 2023
- Neighborhood character
- Predominantly White (76%)
- Race & ethnicity
- White 76% Hispanic / Latino 14% Two or more races 10% Asian 3% Black 3%
- Hispanic origin (detail)
- Mexican 10%
- Common ancestry
- Lithuanian 6% Italian 4% Slovak 3%
- Foreign-born
- 8% · Canada, China, Dominican Republic
- Languages at home
- 89% English-only · Spanish 7% Other Indo-European 1% Other Asian/Pacific 1%
Political lean MEDSL · Harris
- 2024 margin
- Lean D (+5.5) · D 52.0% · R 46.4% · Other 1.6%
- 2008→2024 swing
- +3.9pp toward D · 2008: 1.6pp · 2024: 5.5pp
- All cycles
- 2024: D+5.5 2020: D+13.3 2016: D+12.4 2012: D+0.1 2008: D+1.6
Not yet ingested
- Civics
- —
Market trends
- HPI YoY
- ▲ 0.45%
- Current HPI
- 210.6244
- Rent YoY
- —
- Metro
- Houston-The Woodlands-Sugar Land, TX
- State GDP YoY
- ▲ 3.95%
- F500 in state
- 110
Industry mix (Fortune 500 HQ in TX)
| Industry | F500 HQs | Revenue |
|---|---|---|
| Energy | 16 | $1,198B |
|
||
| Technology | 5 | $198B |
|
||
| Engineering / Construction | 4 | $72B |
|
||
| Energy Services | 3 | $60B |
|
||
| Utilities | 3 | $41B |
|
||
| Healthcare | 2 | $330B |
|
||
Price history
+10962.5% since first listed7 events — show timeline
- 2026-06-10 Pending — HARMLS
- 2026-06-02 Pending — HARMLS
- 2026-05-07 Listed $265,500 HARMLS
- 2025-01-13 Rental Removed $2,400 APPFOLIO
- 2025-01-11 Listed for Rent $2,400 APPFOLIO
- 2025-01-11 Rental Removed $2,400 HARMLS
- 2024-12-03 Listed for Rent $2,400 HARMLS
Property tax history
+14.6%/yrLatest (2025): $8,140 · +1.7% YoY. Source: county tax records.
Cash-flow waterfall
monthlySold comps — $/sqft
last 12 mo · ≤1 miLoading sold comps…