 Multi-family
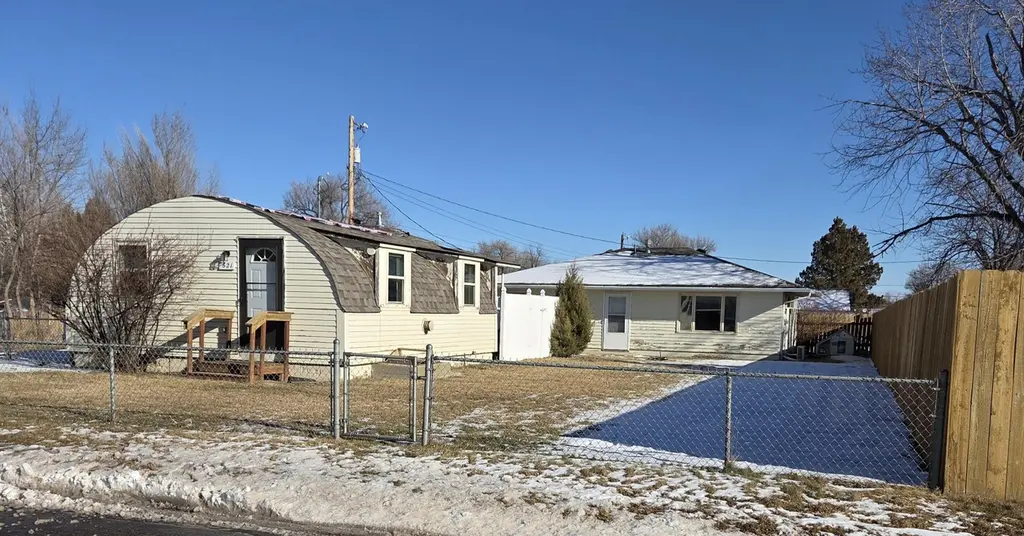
621/623 Kentucky Ave · Sheridan, WY
Flood risk 1/10 · Minimal
- FEMA flood zone
- X (unshaded)
- Chance of flooding over 30 yrs
- 0.0%
- Est. flood insurance / yr
- $507 – $1,088
Fire risk 6/10 · Moderate
- Est. fire insurance / yr
- $564 – $1,046
Heat risk 3/10 · Minor
- Hot days now (above 93°F)
- 7 days/yr
- Hot days in 30 yrs
- 16 days/yr
Wind risk 1/10 · Minimal
- Chance of severe wind over 30 yrs
- —
Air-quality risk 4/10 · Minor
- Unhealthy air days now
- 3 days/yr
- Unhealthy air days in 30 yrs
- 5 days/yr
Risk factors via First Street. Map © Google.
Why this score? — see what drove the D grade
The composite is a weighted blend of 9 inputs, each scored 0–100. Each bar is that input's sub-score; the figure is the points it added to the 100-point composite (weight × sub-score).
- Cash flow +11.4/30.0
- ARV discount +8.0/15.0
- Schools +5.9/10.0
- Livability +4.0/5.0
- 1% rule +3.3/10.0
- DSCR +3.3/10.0
- Rent growth +2.5/5.0
- Condition / age +2.2/5.0
- Appreciation +0.0/10.0
$311,000
🖨 Deal sheet (PDF) 📄 Offer letter ✓ Due diligence
Multi-family units
County records classify this as Multi-Family (2-4 Unit). Listing-text estimate: 1 unit. estimate disagrees with records
Listing remarks MLS
Passive Income potential or Live in 623 and use 621 as rental or maybe In-Laws quarters. Possibilities!!!
Key facts
- 6,098 sq ft lot
- Garage
- Built 1964
Neighborhood map
What this means for you Summary
Snapshot
- This is a 2-bed/1.0-bath multifamily listed at $311k. Condition is rated fair.
Deal economics
- At list price, monthly cash flow is $-109 ($-1k/yr) — negative.
- To cash-flow at today's rent, offer at most $295k (5.1% below list).
- To meet the 1% rule (rent ≥ 1% of price), the offer needs to be $258k (17.0% below list).
- Recommended offer: $258k (17.0% below list) — sets the bar for 1% rule.
- Cap rate 5.9% vs local median 2.4% in Sheridan — top-decile yield for the area; either an underpriced asset or a hidden risk that comps aren't pricing in. Stress-test before assuming the spread holds.
Location & tenants
- Location reads 79/100 on livability (#7 in WY, #2,337 nationally) — a middle-class / working-renter tenant base. Strengths: cost of living A+, health & safety A+, crime A; Watch: amenities C-, employment C-, commute F.
- Sheridan County School District #2 (town): math 68% / reading 72% proficiency, ranked #1 of 41 in WY (top 2%) — strong family-tenant draw, lease renewals of 3-5y typical.
- Zoned schools: Highland Park Elementary (math 77% / reading 72%, grade A, #6 of 151 statewide, top 7%, 295 students, 16% FRL); Sheridan Junior High School (math 60% / reading 73%, grade A-, #9 of 55 statewide, top 15%, 843 students, 28% FRL); Sheridan High School (math 71% / reading 75%, grade B+, #4 of 75 statewide, top 4%, 1,092 students, 24% FRL) — zoned schools at 22% FRL track the district average.
- Market conditions: 514 active listings in the ZIP; 309 units permitted in Sheridan County in 2024 (92 in 5+ unit buildings).
- This rent runs 42% of the median local income ($73k/yr) — at the standard rent-burdened threshold; future hikes will face affordability resistance.
Forward outlook
- Local home prices are declining (-3.0%/yr); year-one equity from $2k of loan paydown is wiped out by about $9k of value loss. Plan a longer hold.
- Sheridan County population projected at +8% by 2050 — modest demand growth; plan on rents tracking national, not racing it.
Negotiation context
- It's been on market 137 days — a 12% lower offer ($274k) is reasonable based on typical stale-listing flexibility.
- 2 sale attempts since 6y ago with the ask held roughly flat each time — persistent listings suggest the price (not the market) is what's stuck; bring a comps-based counter.
Risks & watch-outs
- Climate carrying-cost: major wildfire risk — expect insurance premiums to compound above CPI over the hold.
Questions for the listing agent
- What do current leases actually rent for vs. the listed asking? Can we see a recent rent roll and the last 12 months of T-12 income?
- It's been on market 137 days. Have you received any prior offers? Is the seller open to a 17% concession, seller financing, or rate buy-down credit?
- Have any recent inspections been done? Can we get a copy of the seller's disclosures and any deferred-maintenance estimates?
- Built in 1964 — when were the roof, HVAC, electrical panel, plumbing, and water heater last replaced?
- Why hasn't it sold? Are there any deal-killer items the seller is aware of (foundation, flood, title, zoning, code violations)?
- Is there a deadline driving the sale (1031 exchange, divorce, estate, relocation)? That informs how much negotiation room exists.
- Schools are B-rated — typically a magnet for longer-tenancy family renters. What's the average tenant stay here, and is there a school-zone premium baked into asking?
- The area grade is low — what's the realistic commute time and amenity access for the typical tenant pool here? Any planned neighborhood developments (good or bad) we should know about?
- What's the average days-on-market for RENTAL listings here right now (not sales)? A rising rental-DOM trend means longer vacancies and softer asking-rent achievability than the comps imply.
- What's the recent tenant-quality profile in this submarket — average credit score on applications, eviction rate, late-payment / NSF rate, and stable-employment percentage? A property-management company in the area should have these aggregated.
- How much new apartment / multifamily construction is in the pipeline within 1–3 miles? Heavy new supply (>2% of stock underway) typically softens rents 12–24 months out; light construction supports rent growth.
Investment metrics
- 1% rule
- 0.83% ✗
- Cap rate
- 5.87%
- Cash-on-cash
- -1.51%
- DSCR
- 0.93
- GRM
- 10.0
CMA / ARV
- ARV (median comp)
- $314,403
- List price
- $311,000
- Delta
- -1.08%
- Verdict
- FAIR
- Comps
- 20 within 1.0 mi
Projected returns pro-forma
-3.0% appreciation · 3.0% rent growth · sell at horizon
- IRR
- -18.8%
- Equity multiple
- 0.34×
- Total profit
- $-57,329
- Equity at exit
- $46,371
- IRR
- -11.2%
- Equity multiple
- 0.33×
- Total profit
- $-58,740
- Equity at exit
- $26,890
Cash invested: $87,080 (down + closing). Projections, not guarantees.
Landlord ↔ Tenant lean methodology
- Overall (STATE)
- 90 Strongly Landlord-Friendly
- State Wyoming
- 90 Strongly Landlord-Friendly · R+25
- County
- — inherits STATE
- City
- — inherits STATE
ZIP-level market 82801
- Active inventory
- 514
- Price-to-rent
- 18.9×
Monthly cashflow live
- Estimated rent
- $2,582 medium interval (Pro) →
- Mortgage (P&I)
- −$1,631
- Tax est. 1.5%
- −$389 /mo · $4,665/yr
- Insurance
- −$130
- HOA
- −$0
- Vacancy / Maint / Mgmt
- −$542
- Net cashflow
- $-109
Break-even live
Sensitivity live
| Price | -10% $105 | -5% $-2 | +0% $-109 | +5% $-217 | +10% $-324 |
|---|---|---|---|---|---|
| Rent | -10% $-313 | -5% $-211 | +0% $-109 | +5% $-7 | +10% $95 |
| Rate | -1.0pp $47 | -0.5pp $-30 | base $-109 | +0.5pp $-190 | +1.0pp $-272 |
2-unit breakdown (identical units grouped — click to expand)
| Units | Beds | Baths | Est. rent |
|---|---|---|---|
| 1× unit | 2 | 1 | $1,371 |
| 1× unit | 0 | 1 | $1,212 |
| Total (2 units) | $2,582 | ||
UW: 25.0% down · 7.5% · 30yr · 1.5% tax · 5.0% vac · 8.0% maint · 8.0% mgmt
Financing live
Cash to close
- Down payment
- $77,750
- Closing costs
- $9,330
- Reserves months
- —
- Total cash needed
- —
Loan-product check · same deal, 3 products live
Conventional
25% down · 7.5% · 30yr
- Down + closing
- —
- Monthly P&I
- —
- Monthly cashflow
- —
- DSCR
- —
- Eligible?
- —
Personal DTI + credit; lowest rate.
DSCR
20% down · 8.5% · 30yr
- Down + closing
- —
- Monthly P&I
- —
- Monthly cashflow
- —
- DSCR
- —
- Eligible?
- —
No personal income docs; deal must DSCR.
Hard money
10% down · 12.0% · 12mo
- Down + closing
- —
- Monthly P&I
- —
- Monthly cashflow
- —
- DSCR
- —
- Eligible?
- —
Short-term bridge; refi at stabilization.
Listing history 20 events
-
2026-06-22days on market $311,000 Active 137 DOM
-
2026-06-19days on market $311,000 Active 134 DOM
-
2026-06-18days on market $311,000 Active 133 DOM
-
2026-06-17days on market $311,000 Active 132 DOM
-
2026-06-16days on market $311,000 Active 131 DOM
-
2026-06-15days on market $311,000 Active 130 DOM
-
2026-06-14days on market $311,000 Active 128 DOM
-
2026-06-12days on market $311,000 Active 127 DOM
-
2026-06-09days on market $311,000 Active 124 DOM
-
2026-06-08days on market $311,000 Active 123 DOM
-
2026-06-07days on market $311,000 Active 122 DOM
-
2026-06-05days on market $311,000 Active 120 DOM
-
2026-06-03days on market $311,000 Active 118 DOM
-
2026-06-02days on market $311,000 Active 117 DOM
-
2026-06-01days on market $311,000 Active 116 DOM
-
2026-05-31days on market $311,000 Active 115 DOM
-
2026-05-30days on market $311,000 Active 114 DOM
-
2026-02-05$311,000 Active 105-char remark
Show marketing remark (105 chars)
Passive Income potential or Live in 623 and use 621 as rental or maybe In-Laws quarters. Possibilities!!!
-
2020-02-11soldstatus 467-char remark
Show marketing remark (467 chars)
Two unit rental - a 2 bedroom house to the east and a studio building to the west. Both units are very nice and the studio has been completely remodeled. The studio rents for $650/mo. but is currently vacant. The 2 BR is currently rented at $850/mo for a gross monthly rental of $1,500. Tenants pay gas & electric. Owner pays water. Appliances, including washers and dryers are included. See the ''Documents'' section for a more complete list of included items.
-
2020-01-10$205,000 467-char remark
Show marketing remark (467 chars)
Two unit rental - a 2 bedroom house to the east and a studio building to the west. Both units are very nice and the studio has been completely remodeled. The studio rents for $650/mo. but is currently vacant. The 2 BR is currently rented at $850/mo for a gross monthly rental of $1,500. Tenants pay gas & electric. Owner pays water. Appliances, including washers and dryers are included. See the ''Documents'' section for a more complete list of included items.
ⓘ Source: listings_history table (triggers on properties + properties_extension) + one-shot
backfill from property_details.listing_events for pre-trigger history.
Climate risk First Street
- Flood 1/10 Low FEMA zone X (unshaded) · 0% chance over 30 yrs
- Wildfire 6/10 Major
- Heat 3/10 Moderate 7 d/yr ≥93°F today · 16 d/yr by 30 yrs out
- Wind 1/10 Low
- Air quality 4/10 Moderate 3 unhealthy d/yr today · 5 by 30 yrs out
Nearby sold comps map
Loading sold comps map…
Walkable amenities ~0.75 mi
Loading nearby amenities…
Taxation est. · year 1
- Rental income
- $30,984
- − Mortgage interest
- −$17,421
- − Property taxes
- −$4,665
- − Insurance
- −$1,555
- − Repairs & maintenance
- −$2,479
- − Management
- −$2,479
- − Depreciation
- −$9,047
- Taxable loss
- −$6,662
- Est. tax savings @ 24.0%
- +$1,599
- After-tax cash flow
- $285/yr
For passive investors: Depreciation is non-cash, so a rental often shows a tax loss while cash-flowing — sheltering income. Rental losses are passive: they offset passive income freely, and up to $25,000/yr can offset ordinary (W-2) income if you actively participate and your MAGI is under $100k (phasing out to $0 by $150k); unused losses carry forward. On sale, claimed depreciation is recaptured at up to 25%, and gains may owe capital-gains tax (a 1031 exchange can defer both). Figures are a year-1 estimate at your 24.0% rate — not tax advice; consult a CPA.
Condition & rehab AI · 12 photos
This property requires significant repairs to the roof and exterior siding, but has potential for substantial value increase with updates.
Repairs flagged
- Major roof — Significant damage visible
- Major exterior siding — Peeling paint, siding damage
- Minor interior walls — Some wear
Value-add opportunities
- Both Paint exterior siding — Enhances curb appeal and value
- Both Replace roof — Improves structural integrity and value
- Resale Update kitchen appliances — Modernizes the space and attracts buyers
- Resale Update bathrooms — Modernizes the space and attracts buyers
- Resale Paint interior walls — Enhances the appearance and attracts buyers
Renovation cost estimate screening
| Repair item | Severity | Est. cost |
|---|---|---|
| roof · Significant damage visible | Major | $15,000–50,000 |
| exterior siding · Peeling paint, siding damage | Major | $15,000–50,000 |
| interior walls · Some wear | Minor | $500–3,000 |
| Total estimated repair cost · 3 items | $30,500–103,000 |
Value-add ROI direction
- Both Paint exterior siding — Enhances curb appeal and value ↑
- Both Replace roof — Improves structural integrity and value ↑
- Resale Update kitchen appliances — Modernizes the space and attracts buyers ↑
- Resale Update bathrooms — Modernizes the space and attracts buyers ↑
- Resale Paint interior walls — Enhances the appearance and attracts buyers ↑
ⓘ Cost ranges are severity-bucket heuristics (US national rule-of-thumb). Get contractor quotes + a written scope before underwriting a rehab budget.
Schools (NCES district)
- District
- Sheridan County School District #2
- NCES district ID
- 5605695
- Math proficiency
- 68% ▼ -4.00%
- Reading proficiency
- 72% ▼ -3.00%
- Median HH income
- $50,902
- Composite
- 59.44/100
- National rank
- #923
- State rank
- #1 of 41 in WY
Livability — Sheridan
- Score
- 79/100
- State rank
- #7
- US rank
- #2337
Category grades
Schools grade is shown separately in the Schools card above.
Census & demographics
- Census place
- Sheridan, WY
- County
- Sheridan County · 26,310 people
- City population
- 26,310
- Metro
- Sheridan, WY
- Population (ZIP)
- 26,310
- Household income
- $73,213
- Rent vs Own
- Severe rent burden
- 742.0
Population outlook (Sheridan County) Hauer SSP2
- Today (2025)
- 32,048 people
- By 2030
- 32,834 · +2.5%
- By 2040
- 33,843 · +5.6%
- By 2050
- 34,744 · +8.4%
- By 2075
- 37,231 · +16.2%
- By 2100
- 37,261 · +16.3%
Race, ethnicity, and origin ACS 2023
- Neighborhood character
- Predominantly White (88%)
- Race & ethnicity
- White 88% Hispanic / Latino 5% Two or more races 4% Native American 1% Asian 1%
- Hispanic origin (detail)
- Mexican 4%
- Common ancestry
- Portuguese 5% Slovak 4% Italian 2%
- Foreign-born
- 2% · Canada
- Languages at home
- 97% English-only · Spanish 2%
Political lean MEDSL · Sheridan
- 2024 margin
- Solid R (+50.1) · D 24.2% · R 74.2% · Other 1.6%
- 2008→2024 swing
- -11.9pp toward R · 2008: -38.2pp · 2024: -50.1pp
- All cycles
- 2024: R+50.1 2020: R+47.5 2016: R+51.7 2012: R+46.8 2008: R+38.2
Not yet ingested
- Civics
- —
Market trends
- HPI YoY
- ▼ -194.82%
- Current HPI
- 190.3135
- Rent YoY
- —
- Metro
- Sheridan, WY
- State GDP YoY
- —
- F500 in state
- 0
Price history
+51.7% since first listed3 events — show timeline
- 2026-02-05 Listed $311,000 SBORWY
- 2020-02-11 Sold (MLS) — SBORWY
- 2020-01-10 Listed $205,000 SBORWY
Cash-flow waterfall
monthlySold comps — $/sqft
last 12 mo · ≤1 miLoading sold comps…