 Triplex
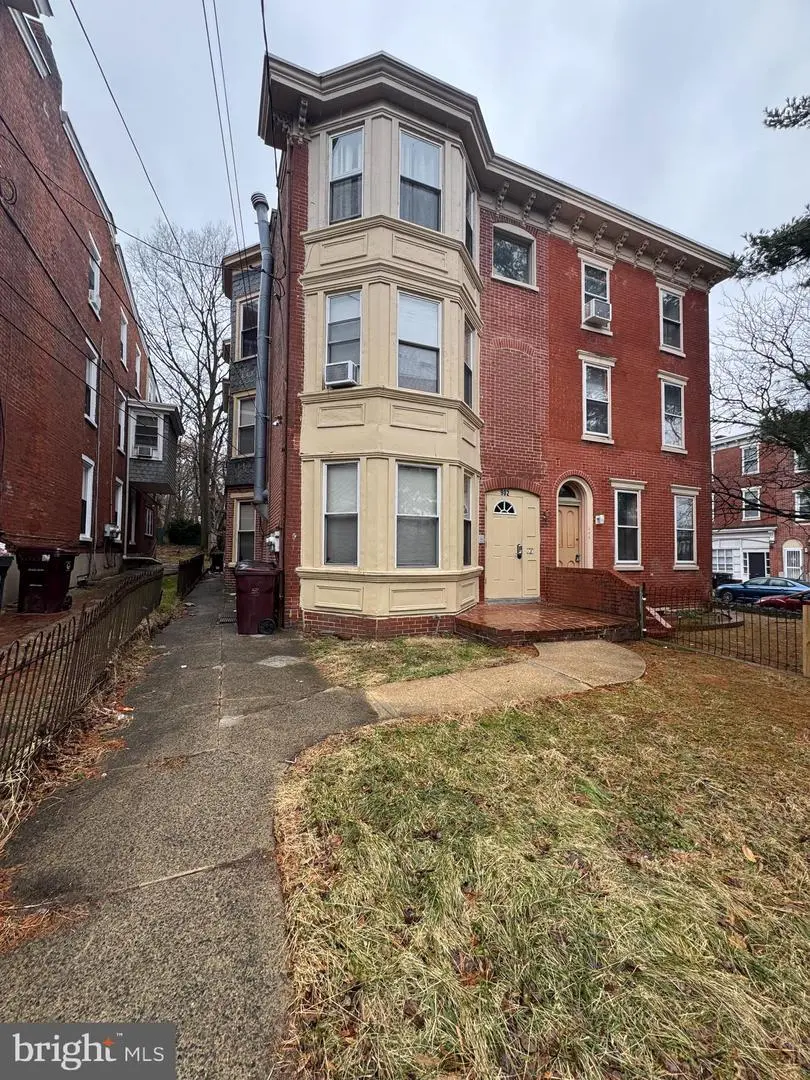
902 N Madison St · Wilmington, DE
Flood risk 1/10 · Minimal
- FEMA flood zone
- X (unshaded)
- Chance of flooding over 30 yrs
- 0.0%
- Est. flood insurance / yr
- $473 – $860
Fire risk 1/10 · Minimal
- Est. fire insurance / yr
- $476 – $884
Heat risk 8/10 · Major
- Hot days now (above 103°F)
- 7 days/yr
- Hot days in 30 yrs
- 16 days/yr
Wind risk 6/10 · Moderate
- Chance of severe wind over 30 yrs
- 27.0%
Air-quality risk 3/10 · Minor
- Unhealthy air days now
- 3 days/yr
- Unhealthy air days in 30 yrs
- 4 days/yr
Risk factors via First Street. Map © Google.
Why this score? — see what drove the B grade
The composite is a weighted blend of 9 inputs, each scored 0–100. Each bar is that input's sub-score; the figure is the points it added to the 100-point composite (weight × sub-score).
- Cash flow +27.9/30.0
- ARV discount +14.9/15.0
- DSCR +9.9/10.0
- 1% rule +7.6/10.0
- Livability +3.2/5.0
- Rent growth +2.9/5.0
- Schools +2.5/10.0
- Condition / age +2.2/5.0
- Appreciation +0.0/10.0
$439,900
🖨 Deal sheet 📄 Offer letter ✓ Due diligence
Multi-family units
County records classify this as Multi-Family (2-4 Unit). Listing-text estimate: 3 units. confirmed
Listing remarks
Excellent investment opportunity in the heart of Wilmington! This well-maintained triplex at 902 N Madison features three spacious units, each offering 2 bedrooms and 2 full bathrooms — a highly desirable layout for today’s rental market. All units are currently occupied with long-term tenants on month-to-month leases, providing immediate rental income along with future flexibility for investors looking to maximize returns. Perfect for investors seeking to expand their portfolio, this property is ideally located just minutes from Trolley Square, Market Street, Wilmington Train Station, major highways, shopping, dining, and public transportation. Its prime location offers strong
Key facts
- Three spacious units
- Long term tenants
- Prime location
Tags
Property features AI
Finance
- Other: Single building with a total of 1 unit per assessor records; Above-grade finished area reported as 4,250 (source: assessor)
- Financial info: Ownership: Fee simple; Property has month-to-month leases; Not rent controlled
Exterior
- Parking: Off-street parking
- Utilities: Public water; Public sewer; Natural gas for heating, cooling fuel, and hot water
- Home design: Semi-detached building
- Construction: Brick construction; Concrete perimeter foundation; Above-grade and below-grade structures
- Exterior features: Lot dimensions approximately 25 x 130; Ground rent paid annually; No tidal water
Interior
- Bedrooms: Three two-bedroom units (all month-to-month and currently leased)
- Heating & cooling: Hot water heating; Central air conditioning (natural gas)
- Interior features: Basement present (other type)
Neighborhood map
What this means for you Summary
Snapshot
- This is a 3 × 2-bed/2-bath units multifamily listed at $440k. Condition is rated fair.
Deal economics
- At list price, monthly cash flow is $1k ($16k/yr) — positive. Per door: $450/mo.
- The deal already cash-flows at list — no discount required.
- Meets the 1% rule at list price ($6k rent vs $440k).
- Recommended offer: $433k (1.5% below list) — sets the bar for market timing.
- Cap rate 10.0% vs local median 5.6% in Wilmington — top-decile yield for the area; either an underpriced asset or a hidden risk that comps aren't pricing in. Stress-test before assuming the spread holds.
Location & tenants
- Location reads 64/100 on livability (#52 in DE) — a middle-class / working-renter tenant base. Strengths: cost of living A+, housing A; Watch: employment D+, schools D, commute D.
- Christina School District (suburban): math 22% / reading 33% proficiency, ranked #18 of 26 in DE (top 69%) — low school quality limits family demand, transient renter base, plan for 1-2y turnover.
- Market conditions: Rents rising (+1.6%/yr); 75 active listings in the ZIP; 1,367 units permitted in New Castle County in 2024 (201 in 5+ unit buildings).
- At $5,557/mo this rent would consume 126% of the median local household income ($53k/yr) (locally 919% of renters already pay >50% of income on rent) — very limited rent-growth headroom before tenants either downsize or default.
Forward outlook
- Local home prices are declining (-3.0%/yr); year-one equity from $3k of loan paydown is wiped out by about $13k of value loss. Plan a longer hold.
- New Castle County population projected at +9% by 2050 — modest demand growth; plan on rents tracking national, not racing it.
Negotiation context
- It's been on market 30 days — a 2% lower offer ($433k) is reasonable based on typical stale-listing flexibility.
- 2 sale attempts with the ask held roughly flat each time — persistent listings suggest the price (not the market) is what's stuck; bring a comps-based counter.
Risks & watch-outs
- Watch-outs: built in 1875 — expect roof / HVAC / electrical / plumbing capex.
- Climate carrying-cost: major wind risk, 27% chance of damaging wind over 30y; extreme-heat days projected 7→16/yr by 2055 (HVAC capex compounding) — expect insurance premiums to compound above CPI over the hold.
Questions for the listing agent
- Can we see the unit-by-unit rent roll, current vacancy, and any below-market leases? What's the average tenancy length?
- What capital expenditures (roof, boiler, parking lot, exteriors) have been made in the last 5 years, and what's planned in the next 2?
- Have any recent inspections been done? Can we get a copy of the seller's disclosures and any deferred-maintenance estimates?
- Built in 1875 — when were the roof, HVAC, electrical panel, plumbing, and water heater last replaced?
- Is there a deadline driving the sale (1031 exchange, divorce, estate, relocation)? That informs how much negotiation room exists.
- Schools are D-rated, which usually means shorter tenancies and higher turnover. Who's the typical renter profile here, and what's been the actual vacancy rate?
- Crime grade is F in this area — have there been break-ins, vandalism, or insurance claims at this property in the last 3 years? What carrier currently insures it and at what premium?
- What's the average days-on-market for RENTAL listings here right now (not sales)? A rising rental-DOM trend means longer vacancies and softer asking-rent achievability than the comps imply.
- What's the recent tenant-quality profile in this submarket — average credit score on applications, eviction rate, late-payment / NSF rate, and stable-employment percentage? A property-management company in the area should have these aggregated.
- How much new apartment / multifamily construction is in the pipeline within 1–3 miles? Heavy new supply (>2% of stock underway) typically softens rents 12–24 months out; light construction supports rent growth.
Investment metrics
- 1% rule
- 1.26% ✓
- Cap rate
- 9.98%
- Cash-on-cash
- 13.15%
- DSCR
- 1.59
- GRM
- 6.6
CMA / ARV
- ARV (on-the-fly)
- $527,000
- Comps found
- 1
Show comp detail 1 sale within ~0.75 mi
| Address | Dist | Beds/Ba | Sqft | Sold | Price | $/sf | Match |
|---|---|---|---|---|---|---|---|
| 600 N Broom St | 0.55mi | 7/5.0 (+1) | 3,625 (-15%) | 12mo | $450,000 | $124 | 20 |
Match score weights: distance 35% · size 25% · config 20% · recency 20%. Top-matched comps best support the ARV.
Projected returns pro-forma
-3.0% appreciation · 1.59% rent growth · sell at horizon
- IRR
- 1.5%
- Equity multiple
- 1.06×
- Total profit
- $7,007
- Equity at exit
- $65,591
- IRR
- 9.7%
- Equity multiple
- 1.70×
- Total profit
- $86,145
- Equity at exit
- $38,035
Cash invested: $123,172 (down + closing). Projections, not guarantees.
Landlord ↔ Tenant lean methodology
- Overall (STATE)
- 70 Landlord-Friendly
- State Delaware
- 70 Landlord-Friendly · D+7
- County
- — inherits STATE
- City
- — inherits STATE
ZIP-level market 19801
- Rents YoY
- 1.6%
- Active inventory
- 75
- Price-to-rent
- 19.8×
Monthly cashflow live
- Estimated rent
- $5,557 high interval (Pro) →
- Mortgage (P&I)
- −$2,307
- Tax est. 1.5%
- −$550 /mo · $6,598/yr
- Insurance
- −$183
- HOA
- −$0
- Vacancy / Maint / Mgmt
- −$1,167
- Net cashflow
- $1,350
Break-even live
3-unit breakdown (identical units grouped — click to expand)
| Units | Beds | Baths | Est. rent |
|---|---|---|---|
| 3× units | 2 | 2 | $5,556 |
| #1 | 2 | 2 | $1,852 |
| #2 | 2 | 2 | $1,852 |
| #3 | 2 | 2 | $1,852 |
| Total (3 units) | $5,557 | ||
UW: 25.0% down · 7.5% · 30yr · 1.5% tax · 5.0% vac · 8.0% maint · 8.0% mgmt
Financing live
Cash to close
- Down payment
- $109,975
- Closing costs
- $13,197
- Reserves months
- —
- Total cash needed
- —
Loan-product check · same deal, 3 products live
Conventional
25% down · 7.5% · 30yr
- Down + closing
- —
- Monthly P&I
- —
- Monthly cashflow
- —
- DSCR
- —
- Eligible?
- —
Personal DTI + credit; lowest rate.
DSCR
20% down · 8.5% · 30yr
- Down + closing
- —
- Monthly P&I
- —
- Monthly cashflow
- —
- DSCR
- —
- Eligible?
- —
No personal income docs; deal must DSCR.
Hard money
10% down · 12.0% · 12mo
- Down + closing
- —
- Monthly P&I
- —
- Monthly cashflow
- —
- DSCR
- —
- Eligible?
- —
Short-term bridge; refi at stabilization.
Listing history 18 events
-
2026-06-18days on market $439,900 Active 30 DOM
-
2026-06-17days on market $439,900 Active 29 DOM
-
2026-06-16days on market $439,900 Active 28 DOM
-
2026-06-15days on market $439,900 Active 27 DOM
-
2026-06-13days on market $439,900 Active 25 DOM
-
2026-06-13days on market $439,900 Active 24 DOM
-
2026-06-09days on market $439,900 Active 21 DOM
-
2026-06-08days on market $439,900 Active 20 DOM
-
2026-06-07days on market $439,900 Active 19 DOM
-
2026-06-04days on market $439,900 Active 16 DOM
-
2026-06-03days on market $439,900 Active 15 DOM
-
2026-06-02days on market $439,900 Active 14 DOM
-
2026-06-01days on market $439,900 Active 13 DOM
-
2026-05-31days on market $439,900 Active 12 DOM
-
2026-05-19$439,900 Active
-
2026-05-01historical
-
2026-02-26$469,000 Active
-
2026-02-23historical
ⓘ Source: listings_history table (triggers on properties + properties_extension) + one-shot
backfill from property_details.listing_events for pre-trigger history.
Climate risk First Street
- Flood 1/10 Low FEMA zone X (unshaded) · 0% chance over 30 yrs
- Wildfire 1/10 Low
- Heat 8/10 Severe 7 d/yr ≥103°F today · 16 d/yr by 30 yrs out
- Wind 6/10 Major 27% chance of damaging wind over 30 yrs
- Air quality 3/10 Moderate 3 unhealthy d/yr today · 4 by 30 yrs out
Nearby sold comps map
Loading sold comps map…
Walkable amenities ~0.75 mi
Loading nearby amenities…
Taxation est. · year 1
- Rental income
- $66,684
- − Mortgage interest
- −$24,641
- − Property taxes
- −$6,598
- − Insurance
- −$2,200
- − Repairs & maintenance
- −$5,335
- − Management
- −$5,335
- − Depreciation
- −$12,797
- Taxable income
- $9,778
- Est. tax owed @ 24.0%
- −$2,347
- After-tax cash flow
- $13,853/yr
For passive investors: Depreciation is non-cash, so a rental often shows a tax loss while cash-flowing — sheltering income. Rental losses are passive: they offset passive income freely, and up to $25,000/yr can offset ordinary (W-2) income if you actively participate and your MAGI is under $100k (phasing out to $0 by $150k); unused losses carry forward. On sale, claimed depreciation is recaptured at up to 25%, and gains may owe capital-gains tax (a 1031 exchange can defer both). Figures are a year-1 estimate at your 24.0% rate — not tax advice; consult a CPA.
Condition & rehab AI · 12 photos
This triplex requires moderate rehabilitation to improve its condition and increase its value. Immediate repairs and maintenance are needed to address exterior and interior issues, while updates to the exterior and landscaping would significantly enhance its curb appeal and property value.
Repairs flagged
- Major exterior siding — Significant wear and tear
- Major roof — No visible damage, but not inspected
- Major exterior paint — Peeling and chipping
- Major flooring — Worn and damaged
- Major interior paint — Significant wear and tear
Value-add opportunities
- Both exterior paint job — Enhances curb appeal and property value
- Both landscaping — Improves curb appeal and property value
- Rental HVAC maintenance — Ensures comfort and reduces maintenance costs
Renovation cost estimate screening
| Repair item | Severity | Est. cost |
|---|---|---|
| exterior siding · Significant wear and tear | Major | $15,000–50,000 |
| roof · No visible damage, but not inspected | Major | $15,000–50,000 |
| exterior paint · Peeling and chipping | Major | $15,000–50,000 |
| flooring · Worn and damaged | Major | $15,000–50,000 |
| interior paint · Significant wear and tear | Major | $15,000–50,000 |
| Total estimated repair cost · 5 items | $75,000–250,000 |
Value-add ROI direction
- Both exterior paint job — Enhances curb appeal and property value ↑
- Both landscaping — Improves curb appeal and property value ↑
- Rental HVAC maintenance — Ensures comfort and reduces maintenance costs ↑
ⓘ Cost ranges are severity-bucket heuristics (US national rule-of-thumb). Get contractor quotes + a written scope before underwriting a rehab budget.
Schools (NCES district)
- District
- Christina School District
- NCES district ID
- 1000200
- Math proficiency
- 22% ▼ -12.00%
- Reading proficiency
- 33% ▼ -5.00%
- Median HH income
- $58,838
- Composite
- 24.93/100
- National rank
- #7567
- State rank
- #18 of 26 in DE
Livability — Wilmington
- Score
- 64/100
- State rank
- #52
- US rank
- #14251
Category grades
Schools grade is shown separately in the Schools card above.
Census & demographics
- Census place
- Wilmington, DE
- County
- New Castle County · 483,412 people
- City population
- 173,480
- Metro
- Philadelphia-Camden-Wilmington, PA-NJ-DE-MD
- Population (ZIP)
- 16,327
- Household income
- $52,810
- Rent vs Own
- Severe rent burden
- 919.0
Population outlook (New Castle County) Hauer SSP2
- Today (2025)
- 594,686 people
- By 2030
- 609,164 · +2.4%
- By 2040
- 632,154 · +6.3%
- By 2050
- 649,068 · +9.1%
- By 2075
- 687,771 · +15.7%
- By 2100
- 694,961 · +16.9%
Race, ethnicity, and origin ACS 2023
- Neighborhood character
- Predominantly Black (67%)
- Race & ethnicity
- Black 67% White 15% Hispanic / Latino 9% Two or more races 7% Asian 4%
- Hispanic origin (detail)
- Mexican 3% Puerto Rican 4%
- Common ancestry
- Romanian 1% Slovak 1% Italian 1%
- Foreign-born
- 9% · Canada, China, Vietnam
- Languages at home
- 87% English-only · Spanish 7% Other Indo-European 2% Chinese 1%
Political lean MEDSL · New Castle
- 2024 margin
- Solid D (+32.6) · D 65.5% · R 32.9% · Other 1.6%
- 2008→2024 swing
- -8.1pp toward R · 2008: 40.6pp · 2024: 32.6pp
- All cycles
- 2024: D+32.6 2020: D+37.1 2016: D+29.6 2012: D+34.1 2008: D+40.6
Not yet ingested
- Civics
- —
Market trends
- HPI YoY
- ▼ -112.65%
- Current HPI
- 151.1288
- Rent YoY
- ▲ 1.59%
- Metro
- Philadelphia-Camden-Wilmington, PA-NJ-DE-MD
- State GDP YoY
- —
- F500 in state
- 0
Price history
-6.2% since first listed4 events — show timeline
- 2026-05-19 Listed $439,900 BRIGHT MLS
- 2026-05-01 Listing Removed — BRIGHT MLS
- 2026-02-26 Listed $469,000 BRIGHT MLS
- 2026-02-23 Coming Soon — BRIGHT MLS
Cash-flow waterfall
monthlySold comps — $/sqft
last 12 mo · ≤1 miLoading sold comps…