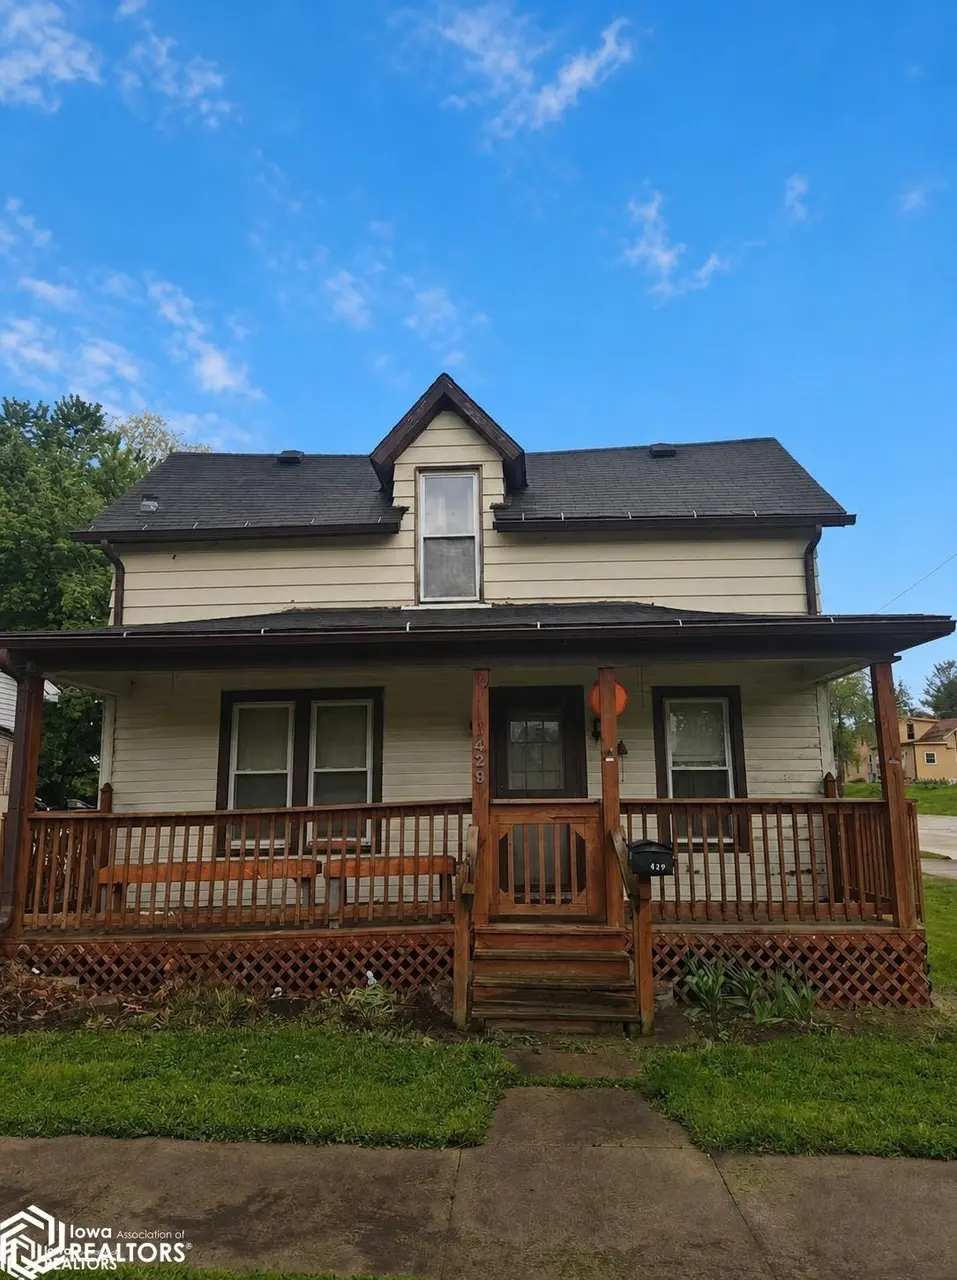
1428 Orleans Ave · Keokuk, IA
Flood risk 8/10 · Major
- FEMA flood zone
- X (unshaded)
- Chance of flooding over 30 yrs
- 0.99%
- Est. flood insurance / yr
- $473 – $860
Fire risk 1/10 · Minimal
- Est. fire insurance / yr
- $902 – $1,676
Heat risk 3/10 · Minor
- Hot days now (above 106°F)
- 7 days/yr
- Hot days in 30 yrs
- 16 days/yr
Wind risk 2/10 · Minimal
- Chance of severe wind over 30 yrs
- —
Air-quality risk 2/10 · Minimal
- Unhealthy air days now
- 0 days/yr
- Unhealthy air days in 30 yrs
- 1 days/yr
Risk factors via First Street. Map © Google.
Why this score? — see what drove the B+ grade
The composite is a weighted blend of 9 inputs, each scored 0–100. Each bar is that input's sub-score; the figure is the points it added to the 100-point composite (weight × sub-score).
- Cash flow +30.0/30.0
- ARV discount +15.0/15.0
- 1% rule +10.0/10.0
- DSCR +10.0/10.0
- Schools +4.2/10.0
- Livability +3.9/5.0
- Rent growth +2.5/5.0
- Condition / age +2.5/5.0
- Appreciation +0.0/10.0
$61,900
🖨 Deal sheet 📄 Offer letter ✓ Due diligence
Listing remarks
Price Reduction! Motivated Seller! Great starter home at a great price that is cheaper than renting. This 2 bedroom 2 bath home sits on a corner lot right across from beautiful Rand Park. It has a fenced in back yard too. The garage has 2 stalls and its own electrical with plenty of outlets that is heated and cooled. There is a $2000.00 flooring allowance possible to choose your own flooring for the bedrooms. Call your favorite realtor today for your private showing.
Key facts
- 7,000 sq ft lot
- 2 garage spots
- Built 1888
Property features AI
Finance
- Other: Listing broker: Fraise Auction & Real Estate; Listing agent: Dan Roach — 319-371-6031
Exterior
- Parking: 2-car garage with concrete parking surface
- Utilities: Public sewer
- Home design: One and one-half story single-family residence; Residential property with metal siding
- Construction: Metal siding exterior
- Exterior features: Lot approximately 0.16 acre (about 50 x 140); Corner lot location
Interior
- Bathrooms: 1 full bathroom; 1 three-quarter bathroom
- Heating & cooling: Forced air heating; Window unit cooling
- Interior features: Basement present
Neighborhood map
What this means for you Summary
Snapshot
- This is a 2-bed/2.0-bath single-family listed at $62k.
Deal economics
- At list price, monthly cash flow is $235 ($3k/yr) — positive.
- The deal already cash-flows at list — no discount required.
- Meets the 1% rule at list price ($972 rent vs $62k).
- Recommended offer: $60k (3.0% below list) — sets the bar for market timing.
- Cap rate 11.9% vs local median 8.2% in Keokuk — top-decile yield for the area; either an underpriced asset or a hidden risk that comps aren't pricing in. Stress-test before assuming the spread holds.
Location & tenants
- Location reads 77/100 on livability (#166 in IA, #3,002 nationally) — a middle-class / working-renter tenant base. Strengths: cost of living A+, housing A+, health & safety A+; Watch: amenities C-, commute F, employment F.
- Keokuk Community School District (town): math 48% / reading 54% proficiency, ranked #282 of 289 in IA (top 98%) — acceptable for families but not a draw, mixed tenant base, ~2y average lease.
- Market conditions: 71 active listings in the ZIP; 15 units permitted in Lee County in 2024 (0 in 5+ unit buildings).
Forward outlook
- Local home prices are declining (-3.0%/yr); year-one equity from $428 of loan paydown is wiped out by about $2k of value loss. Plan a longer hold.
- Lee County population projected at -15% by 2050 — secular population decline; favor cash flow + early exit over multi-decade hold.
- At projected returns (-3.0% appreciation + 3.0% rent growth), your $17k cash investment doubles in ~8 years — after that, you're playing with house money.
Negotiation context
- It's been on market 49 days — a 3% lower offer ($60k) is reasonable based on typical stale-listing flexibility.
- 2 sale attempts; this cycle's ask has dropped $66.84M (100%) from the opening price — seller is motivated, your offer sets the floor, not the list.
Risks & watch-outs
- Watch-outs: flood insurance adds $56/mo; built in 1888 — expect roof / HVAC / electrical / plumbing capex.
- Climate carrying-cost: severe flood risk — expect insurance premiums to compound above CPI over the hold.
Questions for the listing agent
- It's been on market 49 days. Have you received any prior offers? Is the seller open to a 3% concession, seller financing, or rate buy-down credit?
- Built in 1888 — when were the roof, HVAC, electrical panel, plumbing, and water heater last replaced?
- What's the actual annual flood-insurance premium (NFIP or private), and is the property in a SFHA with mandatory coverage?
- Is there a deadline driving the sale (1031 exchange, divorce, estate, relocation)? That informs how much negotiation room exists.
- What's the average days-on-market for RENTAL listings here right now (not sales)? A rising rental-DOM trend means longer vacancies and softer asking-rent achievability than the comps imply.
- What's the recent tenant-quality profile in this submarket — average credit score on applications, eviction rate, late-payment / NSF rate, and stable-employment percentage? A property-management company in the area should have these aggregated.
- How much new for-sale + rental construction is in the pipeline within 1–3 miles? Heavy new supply typically softens prices + rents 12–24 months out; constrained supply supports both.
Investment metrics
- 1% rule
- 1.57% ✓
- Cap rate
- 11.93%
- Cash-on-cash
- 20.13%
- DSCR
- 1.90
- GRM
- 5.3
CMA / ARV
- ARV (median comp)
- $89,091
- List price
- $61,900
- Delta
- -30.52%
- Verdict
- UNDERPRICED
- Comps
- 20 within 1.0 mi
Show comp detail 12 sales within ~0.75 mi
| Address | Dist | Beds/Ba | Sqft | Sold | Price | $/sf | Match |
|---|---|---|---|---|---|---|---|
| 911 N 13th St | 0.23mi | 3/1.5 (+1) | 1,331 (+4%) | 5mo | $84,500 | $63 | 71 |
| 1000 Franklin St | 0.33mi | 2/1.5 | 1,338 (+4%) | 8mo | $12,500 | $9 | 68 |
| 1528 Franklin St | 0.10mi | 3/1.5 (+1) | 1,140 (-11%) | 4mo | $131,000 | $115 | 67 |
| 1025 Leighton St | 0.30mi | 2/1.0 | 1,124 (-12%) | 6mo | $105,500 | $94 | 56 |
| 11 Suncrest St | 0.55mi | 3/1.0 (+1) | 1,312 (+2%) | 6mo | $71,400 | $54 | 56 |
| 116 S 9th St | 0.71mi | 2/2.5 | 1,332 (+4%) | 3mo | $20,000 | $15 | 56 |
| 508 N 9th St | 0.40mi | 2/2.0 | 1,112 (-13%) | 4mo | $88,000 | $79 | 56 |
| 1922 Exchange St | 0.72mi | 3/2.5 (+1) | 1,331 (+4%) | 2mo | $97,000 | $73 | 51 |
| 617 Concert St | 0.66mi | 1/1.0 (-1) | 1,248 (-2%) | 13mo | $35,000 | $28 | 45 |
| 1721 Johnson St | 0.57mi | 3/1.0 (+1) | 1,142 (-11%) | 5mo | $30,000 | $26 | 42 |
| 2114 Logan Dr | 0.63mi | 3/2.0 (+1) | 1,092 (-15%) | 9mo | $139,000 | $127 | 34 |
| 1310 Bank St | 0.71mi | 2/1.0 | 1,448 (+13%) | 13mo | $57,500 | $40 | 30 |
Match score weights: distance 35% · size 25% · config 20% · recency 20%. Top-matched comps best support the ARV.
Projected returns pro-forma
-3.0% appreciation · 3.0% rent growth · sell at horizon
- IRR
- 7.4%
- Equity multiple
- 1.29×
- Total profit
- $5,026
- Equity at exit
- $9,229
- IRR
- 16.8%
- Equity multiple
- 2.38×
- Total profit
- $23,982
- Equity at exit
- $5,352
Cash invested: $17,332 (down + closing). Projections, not guarantees.
Landlord ↔ Tenant lean methodology
- Overall (STATE)
- 83 Strongly Landlord-Friendly
- State Iowa
- 83 Strongly Landlord-Friendly · R+6
- County
- — inherits STATE
- City
- — inherits STATE
ZIP-level market 52632
- Home prices YoY
- -25.5%
- Active inventory
- 71
- Price-to-rent
- 5.3×
Monthly cashflow live
- Estimated rent
- $972 medium interval (Pro) →
- Mortgage (P&I)
- −$325
- Tax from tax record
- −$126 /mo · $1,517/yr
- Insurance
- −$26
- Flood insurance flood zone
- −$56 /mo · $666/yr
- HOA
- −$0
- Vacancy / Maint / Mgmt
- −$204
- Net cashflow
- $235
Break-even live
UW: 25.0% down · 7.5% · 30yr · 1.5% tax · 5.0% vac · 8.0% maint · 8.0% mgmt
Financing live
Cash to close
- Down payment
- $15,475
- Closing costs
- $1,857
- Reserves months
- —
- Total cash needed
- —
Loan-product check · same deal, 3 products live
Conventional
25% down · 7.5% · 30yr
- Down + closing
- —
- Monthly P&I
- —
- Monthly cashflow
- —
- DSCR
- —
- Eligible?
- —
Personal DTI + credit; lowest rate.
DSCR
20% down · 8.5% · 30yr
- Down + closing
- —
- Monthly P&I
- —
- Monthly cashflow
- —
- DSCR
- —
- Eligible?
- —
No personal income docs; deal must DSCR.
Hard money
10% down · 12.0% · 12mo
- Down + closing
- —
- Monthly P&I
- —
- Monthly cashflow
- —
- DSCR
- —
- Eligible?
- —
Short-term bridge; refi at stabilization.
Listing history 21 events
-
2026-06-18remarks 471-char remark
-
2026-06-18price $61,900 Active 49 DOM
-
2026-06-18days on market $66,900 Active 49 DOM
-
2026-06-17days on market $66,900 Active 48 DOM
-
2026-06-16days on market $66,900 Active 47 DOM
-
2026-06-15days on market $66,900 Active 46 DOM
-
2026-06-13days on market $66,900 Active 44 DOM
-
2026-06-12days on market $66,900 Active 43 DOM
-
2026-06-09days on market $66,900 Active 40 DOM
-
2026-06-08days on market $66,900 Active 39 DOM
-
2026-06-07days on market $66,900 Active 38 DOM
-
2026-06-07days on market $66,900 Active 37 DOM
-
2026-06-04days on market $66,900 Active 34 DOM
-
2026-06-02days on market $66,900 Active 33 DOM
-
2026-06-01days on market $66,900 Active 32 DOM
-
2026-05-31days on market $66,900 Active 31 DOM
-
2026-05-31days on market $66,900 Active 30 DOM
-
2026-05-01price $66,900 436-char remark
-
2026-04-30$66,900,000 Active 436-char remark
-
2025-02-17price $61,900
-
2025-01-28$74,900 Active
ⓘ Source: listings_history table (triggers on properties + properties_extension) + one-shot
backfill from property_details.listing_events for pre-trigger history.
Tax reassessment forecast IA · Partial reset (capped growth)
- Current annual tax
- $1,517 · $126/mo
- Projected year-2 tax
- $1,517 · $126/mo
- Expected delta
- $0/yr ($0/mo · 0.0%)
ⓘ Screening estimate from a state-policy table — verify with the county assessor before closing.
Climate risk First Street
- Flood 8/10 Severe FEMA zone X (unshaded) · 99% chance over 30 yrs
- Wildfire 1/10 Low
- Heat 3/10 Moderate 7 d/yr ≥106°F today · 16 d/yr by 30 yrs out
- Wind 2/10 Low
- Air quality 2/10 Low 0 unhealthy d/yr today · 1 by 30 yrs out
Nearby sold comps map
Loading sold comps map…
Walkable amenities ~0.75 mi
Loading nearby amenities…
Taxation est. · year 1
- Rental income
- $11,658
- − Mortgage interest
- −$3,467
- − Property taxes
- −$1,517
- − Insurance
- −$976
- − Repairs & maintenance
- −$933
- − Management
- −$933
- − Depreciation
- −$1,801
- Taxable income
- $2,032
- Est. tax owed @ 24.0%
- −$488
- After-tax cash flow
- $2,334/yr
For passive investors: Depreciation is non-cash, so a rental often shows a tax loss while cash-flowing — sheltering income. Rental losses are passive: they offset passive income freely, and up to $25,000/yr can offset ordinary (W-2) income if you actively participate and your MAGI is under $100k (phasing out to $0 by $150k); unused losses carry forward. On sale, claimed depreciation is recaptured at up to 25%, and gains may owe capital-gains tax (a 1031 exchange can defer both). Figures are a year-1 estimate at your 24.0% rate — not tax advice; consult a CPA.
Schools (NCES district)
- District
- Keokuk Community School District
- NCES district ID
- 1915630
- Math proficiency
- 48% ▼ -9.00%
- Reading proficiency
- 54% ▼ -2.00%
- Median HH income
- $36,973
- Composite
- 42.35/100
- National rank
- #3249
- State rank
- #282 of 289 in IA
Livability — Keokuk
- Score
- 77/100
- State rank
- #166
- US rank
- #3002
Category grades
Schools grade is shown separately in the Schools card above.
Census & demographics
- Census place
- Keokuk, IA
- Population (ZIP)
- 11,904
Population outlook (Lee County) Hauer SSP2
- Today (2025)
- 33,813 people
- By 2030
- 32,835 · -2.9%
- By 2040
- 30,690 · -9.2%
- By 2050
- 28,777 · -14.9%
- By 2075
- 25,568 · -24.4%
- By 2100
- 21,983 · -35.0%
Race, ethnicity, and origin ACS 2023
- Neighborhood character
- Predominantly White (91%)
- Race & ethnicity
- White 91% Two or more races 6% Hispanic / Latino 3% Black 3%
- Common ancestry
- Portuguese 3% Italian 2% Lithuanian 2%
- Foreign-born
- 1%
- Languages at home
- 99% English-only · Spanish 1%
Political lean MEDSL · Lee
- 2024 margin
- Strong R (+27.8) · D 35.0% · R 62.9% · Other 2.1%
- 2008→2024 swing
- -43.8pp toward R · 2008: 16.0pp · 2024: -27.8pp
- All cycles
- 2024: R+27.8 2020: R+19.3 2016: R+16.1 2012: D+16.0 2008: D+16.0
Not yet ingested
- Civics
- —
Market trends
- HPI YoY
- ▼ -41.80%
- Current HPI
- 122.2866
- Rent YoY
- —
- Metro
- —
- State GDP YoY
- ▲ 2.48%
- F500 in state
- 4
Industry mix (Fortune 500 HQ in IA)
| Industry | F500 HQs | Revenue |
|---|---|---|
| Financial Services | 1 | $16B |
|
||
| Retail / Convenience | 1 | $15B |
|
||
Price history
-17.4% since first listed5 events — show timeline
- 2026-06-18 Price Changed $61,900 IAR
- 2026-05-01 Price Changed $66,900 IAR
- 2026-04-30 Listed $66,900,000 IAR
- 2025-02-17 Price Changed $61,900 IAR
- 2025-01-28 Listed $74,900 IAR
Property tax history
+5.7%/yrLatest (2025): $1,517 · +78.9% YoY. Source: county tax records.
Cash-flow waterfall
monthlySold comps — $/sqft
last 12 mo · ≤1 miLoading sold comps…