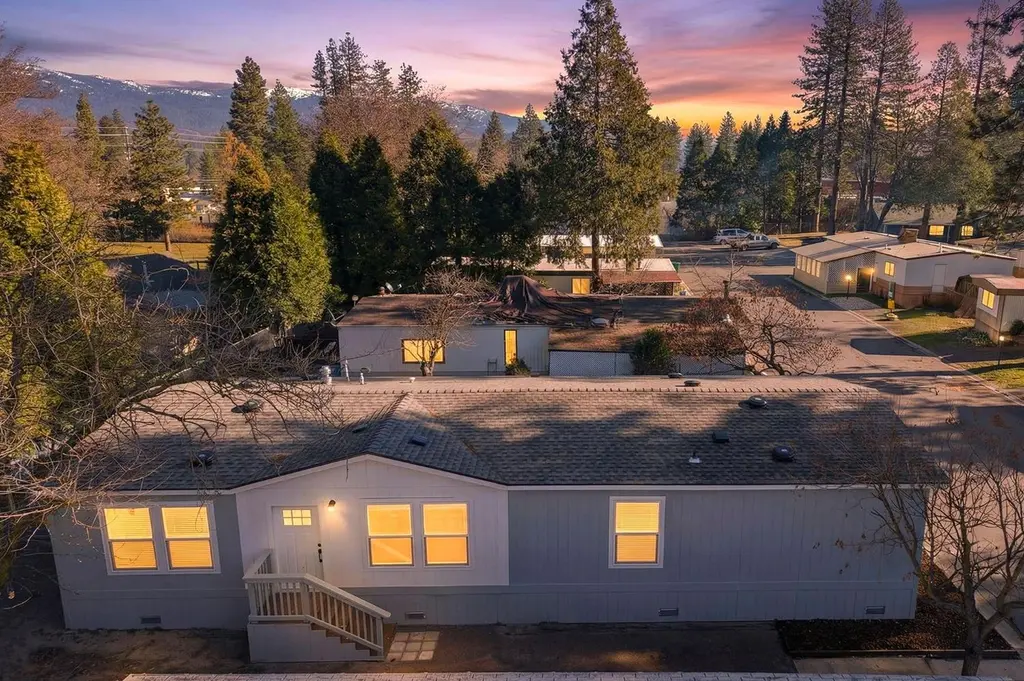
1750 Lee Rd #37 · East Quincy, CA
Flood risk 3/10 · Minor
- FEMA flood zone
- X (unshaded)
- Chance of flooding over 30 yrs
- 0.2%
- Est. flood insurance / yr
- $473 – $860
Fire risk 7/10 · Major
- Est. fire insurance / yr
- $659 – $1,223
Heat risk 5/10 · Moderate
- Hot days now (above 89°F)
- 7 days/yr
- Hot days in 30 yrs
- 18 days/yr
Wind risk 1/10 · Minimal
- Chance of severe wind over 30 yrs
- —
Air-quality risk 10/10 · Severe
- Unhealthy air days now
- 39 days/yr
- Unhealthy air days in 30 yrs
- 42 days/yr
Risk factors via First Street. Map © Google.
Why this score? — see what drove the B grade
The composite is a weighted blend of 9 inputs, each scored 0–100. Each bar is that input's sub-score; the figure is the points it added to the 100-point composite (weight × sub-score).
- Cash flow +30.0/30.0
- ARV discount +11.6/15.0
- DSCR +10.0/10.0
- 1% rule +9.1/10.0
- Livability +3.2/5.0
- Schools +2.8/10.0
- Rent growth +2.5/5.0
- Condition / age +2.5/5.0
- Appreciation +0.0/10.0
$129,950
🖨 Deal sheet (PDF) 📄 Offer letter ✓ Due diligence
Listing remarks
Welcome home to this brand new 2025 Clayton Tempo Series double-wide manufactured home located in the well-maintained Shady Pines Manufactured Home Community, featuring affordable space rent of $595. Turn your dream of homeownership into reality with this beautiful 3-bedroom, 2-bathroom home offering a spacious open-concept floor plan designed for comfortable everyday living. The inviting kitchen showcases stainless steel appliances, ample cabinetry, and flows seamlessly into the main living area, perfect for both relaxing and entertaining. Enjoy the convenience of indoor laundry with washer and dryer hookups, along with numerous windows that fill the home with abundant natural light throug
Key facts
- Inviting kitchen
- Modern finishes
- Indoor laundry
Tags
Neighborhood map
What this means for you Summary
Snapshot
- This is a 3-bed/2.0-bath manufactured listed at $130k.
Deal economics
- At list price, monthly cash flow is $553 ($7k/yr) — positive.
- The deal already cash-flows at list — no discount required.
- Meets the 1% rule at list price ($2k rent vs $130k).
- Recommended offer: $114k (12.0% below list) — sets the bar for market timing.
Location & tenants
- Location reads 63/100 on livability (#466 in CA) — a middle-class / working-renter tenant base. Strengths: housing A+, crime B+, employment B+; Watch: amenities F, commute F, cost of living F.
- Plumas Unified (rural): math 21% / reading 44% proficiency, ranked #306 of 517 in CA (top 59%) — families likely to look elsewhere, expect single-tenant / working-renter base with shorter leases.
- Zoned schools: C. Roy Carmichael Elementary (346 students, 72% FRL); Quincy Junior/Senior High (math 22% / reading 47%, grade F, #618 of 1,170 statewide, top 56%, 340 students, 48% FRL) — zoned schools average 60% FRL vs 41% district-wide (20 pts higher); higher-poverty schools than district average — tighter screening recommended.
- Market conditions: 75 active listings in the ZIP; 39 units permitted in Plumas County in 2024 (0 in 5+ unit buildings).
Forward outlook
- Local home prices are declining (-3.0%/yr); year-one equity from $898 of loan paydown is wiped out by about $4k of value loss. Plan a longer hold.
- Plumas County population projected at -42% by 2050 — secular population decline; favor cash flow + early exit over multi-decade hold.
- At projected returns (-3.0% appreciation + 3.0% rent growth), your $36k cash investment doubles in ~7 years — after that, you're playing with house money.
Negotiation context
- It's been on market 148 days — a 12% lower offer ($114k) is reasonable based on typical stale-listing flexibility.
Risks & watch-outs
- Climate carrying-cost: major wildfire risk; extreme-heat days projected 7→18/yr by 2055 (HVAC capex compounding) — expect insurance premiums to compound above CPI over the hold.
Questions for the listing agent
- It's been on market 148 days. Have you received any prior offers? Is the seller open to a 12% concession, seller financing, or rate buy-down credit?
- Why hasn't it sold? Are there any deal-killer items the seller is aware of (foundation, flood, title, zoning, code violations)?
- Is there a deadline driving the sale (1031 exchange, divorce, estate, relocation)? That informs how much negotiation room exists.
- Schools are D-rated, which usually means shorter tenancies and higher turnover. Who's the typical renter profile here, and what's been the actual vacancy rate?
- What's the average days-on-market for RENTAL listings here right now (not sales)? A rising rental-DOM trend means longer vacancies and softer asking-rent achievability than the comps imply.
- What's the recent tenant-quality profile in this submarket — average credit score on applications, eviction rate, late-payment / NSF rate, and stable-employment percentage? A property-management company in the area should have these aggregated.
- How much new for-sale + rental construction is in the pipeline within 1–3 miles? Heavy new supply typically softens prices + rents 12–24 months out; constrained supply supports both.
Investment metrics
- 1% rule
- 1.41% ✓
- Cap rate
- 11.40%
- Cash-on-cash
- 18.25%
- DSCR
- 1.81
- GRM
- 5.9
CMA / ARV
- ARV (median comp)
- $143,055
- List price
- $129,950
- Delta
- -9.16%
- Verdict
- FAIR
- Comps
- 3 within 1.0 mi
Show comp detail 6 sales within ~0.75 mi
| Address | Dist | Beds/Ba | Sqft | Sold | Price | $/sf | Match |
|---|---|---|---|---|---|---|---|
| 1750 Lee Rd | 0.00mi | 3/2.0 | 1,392 (-3%) | 20mo | $125,000 | $90 | 78 |
| 25 Redberg Ave | 0.14mi | 2/2.0 (-1) | 1,296 (-10%) | 2mo | $58,665 | $45 | 70 |
| 1750 Lee Rd #61 | 0.00mi | 3/2.0 | 1,320 (-8%) | 21mo | $152,000 | $115 | 68 |
| 2121 Cedar Street St | 0.59mi | 3/2.0 | 1,456 (+1%) | 12mo | $270,000 | $185 | 61 |
| 2114 Mansell Street St | 0.74mi | 2/2.0 (-1) | 1,440 (0%) | 23mo | $236,000 | $164 | 42 |
| 2211 center St | 0.74mi | 2/2.0 (-1) | 1,296 (-10%) | 6mo | $145,000 | $112 | 39 |
Match score weights: distance 35% · size 25% · config 20% · recency 20%. Top-matched comps best support the ARV.
Projected returns pro-forma
-3.0% appreciation · 3.0% rent growth · sell at horizon
- IRR
- 9.9%
- Equity multiple
- 1.39×
- Total profit
- $14,223
- Equity at exit
- $19,376
- IRR
- 19.0%
- Equity multiple
- 2.59×
- Total profit
- $57,891
- Equity at exit
- $11,236
Cash invested: $36,386 (down + closing). Projections, not guarantees.
Landlord ↔ Tenant lean methodology
- Overall (STATE)
- 18 Strongly Tenant-Friendly
- State California
- 18 Strongly Tenant-Friendly · D+13
- County
- — inherits STATE
- City
- — inherits STATE
ZIP-level market 95971
- Active inventory
- 75
- Price-to-rent
- 5.9×
Monthly cashflow live
- Estimated rent
- $1,837 medium interval (Pro) →
- Mortgage (P&I)
- −$681
- Tax est. 1.5%
- −$162 /mo · $1,949/yr
- Insurance
- −$54
- HOA
- −$0
- Lot rent leased land?
- −$0
- Vacancy / Maint / Mgmt
- −$386
- Net cashflow
- $553
Break-even live
Sensitivity live
| Price | -10% $643 | -5% $598 | +0% $553 | +5% $509 | +10% $464 |
|---|---|---|---|---|---|
| Rent | -10% $408 | -5% $481 | +0% $553 | +5% $626 | +10% $699 |
| Rate | -1.0pp $619 | -0.5pp $587 | base $553 | +0.5pp $520 | +1.0pp $486 |
UW: 25.0% down · 7.5% · 30yr · 1.5% tax · 5.0% vac · 8.0% maint · 8.0% mgmt
Financing live
Cash to close
- Down payment
- $32,488
- Closing costs
- $3,898
- Reserves months
- —
- Total cash needed
- —
Loan-product check · same deal, 3 products live
Conventional
25% down · 7.5% · 30yr
- Down + closing
- —
- Monthly P&I
- —
- Monthly cashflow
- —
- DSCR
- —
- Eligible?
- —
Personal DTI + credit; lowest rate.
DSCR
20% down · 8.5% · 30yr
- Down + closing
- —
- Monthly P&I
- —
- Monthly cashflow
- —
- DSCR
- —
- Eligible?
- —
No personal income docs; deal must DSCR.
Hard money
10% down · 12.0% · 12mo
- Down + closing
- —
- Monthly P&I
- —
- Monthly cashflow
- —
- DSCR
- —
- Eligible?
- —
Short-term bridge; refi at stabilization.
Listing history 17 events
-
2026-06-19status $129,950 Pending 148 DOM
-
2026-06-18days on market $129,950 Active 148 DOM
-
2026-06-17days on market $129,950 Active 147 DOM
-
2026-06-16days on market $129,950 Active 146 DOM
-
2026-06-15days on market $129,950 Active 145 DOM
-
2026-06-14days on market $129,950 Active 143 DOM
-
2026-06-13days on market $129,950 Active 142 DOM
-
2026-06-10days on market $129,950 Active 140 DOM
-
2026-06-09days on market $129,950 Active 139 DOM
-
2026-06-08days on market $129,950 Active 138 DOM
-
2026-06-07days on market $129,950 Active 137 DOM
-
2026-06-05days on market $129,950 Active 134 DOM
-
2026-06-03days on market $129,950 Active 133 DOM
-
2026-06-02days on market $129,950 Active 132 DOM
-
2026-06-01days on market $129,950 Active 131 DOM
-
2026-05-31days on market $129,950 Active 130 DOM
-
2026-05-30days on market $129,950 Active 129 DOM
ⓘ Source: listings_history table (triggers on properties + properties_extension) + one-shot
backfill from property_details.listing_events for pre-trigger history.
Climate risk First Street
- Flood 3/10 Moderate FEMA zone X (unshaded) · 20% chance over 30 yrs
- Wildfire 7/10 Severe
- Heat 5/10 Major 7 d/yr ≥89°F today · 18 d/yr by 30 yrs out
- Wind 1/10 Low
- Air quality 10/10 Extreme 39 unhealthy d/yr today · 42 by 30 yrs out
Nearby sold comps map
Loading sold comps map…
Walkable amenities ~0.75 mi
Loading nearby amenities…
Taxation est. · year 1
- Rental income
- $22,049
- − Mortgage interest
- −$7,279
- − Property taxes
- −$1,949
- − Insurance
- −$650
- − Repairs & maintenance
- −$1,764
- − Management
- −$1,764
- − Depreciation
- −$3,780
- Taxable income
- $4,863
- Est. tax owed @ 24.0%
- −$1,167
- After-tax cash flow
- $5,475/yr
For passive investors: Depreciation is non-cash, so a rental often shows a tax loss while cash-flowing — sheltering income. Rental losses are passive: they offset passive income freely, and up to $25,000/yr can offset ordinary (W-2) income if you actively participate and your MAGI is under $100k (phasing out to $0 by $150k); unused losses carry forward. On sale, claimed depreciation is recaptured at up to 25%, and gains may owe capital-gains tax (a 1031 exchange can defer both). Figures are a year-1 estimate at your 24.0% rate — not tax advice; consult a CPA.
Schools (NCES district)
- District
- Plumas Unified
- NCES district ID
- 0631170
- Math proficiency
- 21% ▼ -11.00%
- Reading proficiency
- 44% ▬ 0.00%
- Median HH income
- $46,935
- Composite
- 27.89/100
- National rank
- #6870
- State rank
- #306 of 517 in CA
Livability — East Quincy
- Score
- 63/100
- State rank
- #466
- US rank
- #15882
Category grades
Schools grade is shown separately in the Schools card above.
Census & demographics
- Census place
- East Quincy, CA
- City population
- 6,288
- Population (ZIP)
- 6,288
Population outlook (Plumas County) Hauer SSP2
- Today (2025)
- 15,564 people
- By 2030
- 14,014 · -10.0%
- By 2040
- 11,197 · -28.1%
- By 2050
- 9,069 · -41.7%
- By 2075
- 5,573 · -64.2%
- By 2100
- 3,392 · -78.2%
Race, ethnicity, and origin ACS 2023
- Neighborhood character
- Predominantly White (77%)
- Race & ethnicity
- White 77% Two or more races 12% Hispanic / Latino 8% Black 2% Native American 2%
- Hispanic origin (detail)
- Mexican 3%
- Common ancestry
- Russian 4% Italian 3% Scottish 2%
- Foreign-born
- 3% · Canada, China
- Languages at home
- 96% English-only · Spanish 3% French/Haitian/Cajun 1%
Political lean MEDSL · Plumas
- 2024 margin
- R (+16.9) · D 39.9% · R 56.9% · Other 3.2%
- 2008→2024 swing
- -5.0pp toward R · 2008: -12.0pp · 2024: -16.9pp
- All cycles
- 2024: R+16.9 2020: R+16.7 2016: R+21.0 2012: R+17.2 2008: R+12.0
Not yet ingested
- Civics
- —
Market trends
- HPI YoY
- ▼ -149.71%
- Current HPI
- 139.3612
- Rent YoY
- —
- Metro
- —
- State GDP YoY
- ▲ 3.21%
- F500 in state
- 116
Industry mix (Fortune 500 HQ in CA)
| Industry | F500 HQs | Revenue |
|---|---|---|
| Technology | 27 | $1,492B |
|
||
| Financial Services | 3 | $174B |
|
||
| Retail | 3 | $44B |
|
||
| Insurance | 3 | $26B |
|
||
| Media / Entertainment | 2 | $115B |
|
||
| Pharmaceuticals / Biotech | 2 | $62B |
|
||
Property tax history
+0.4%/yrLatest (2023): $122 · -2.5% YoY. Source: county tax records.
Cash-flow waterfall
monthlySold comps — $/sqft
last 12 mo · ≤1 miLoading sold comps…