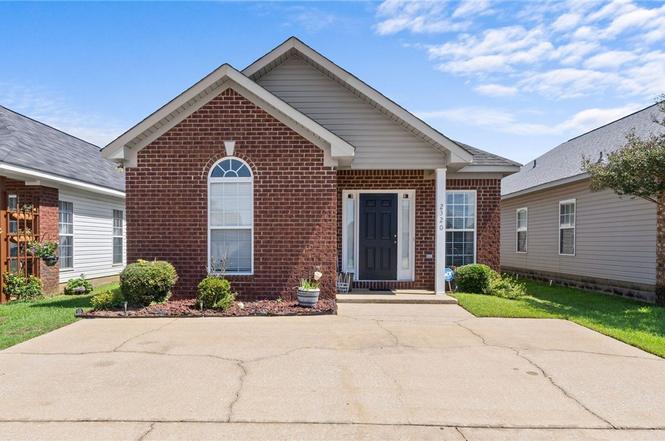
2320 Starlight Dr · Tuscaloosa, AL
Flood risk 1/10 · Minimal
- FEMA flood zone
- X (unshaded)
- Chance of flooding over 30 yrs
- 0.0%
- Est. flood insurance / yr
- $507 – $1,088
Fire risk 4/10 · Minor
- Est. fire insurance / yr
- $916 – $1,700
Heat risk 8/10 · Major
- Hot days now (above 108°F)
- 7 days/yr
- Hot days in 30 yrs
- 21 days/yr
Wind risk 6/10 · Moderate
- Chance of severe wind over 30 yrs
- 58.0%
Air-quality risk 1/10 · Minimal
- Unhealthy air days now
- 0 days/yr
- Unhealthy air days in 30 yrs
- 0 days/yr
Risk factors via First Street. Map © Google.
Why this score? — see what drove the D+ grade
The composite is a weighted blend of 9 inputs, each scored 0–100. Each bar is that input's sub-score; the figure is the points it added to the 100-point composite (weight × sub-score).
- ARV discount +15.0/15.0
- Cash flow +13.2/30.0
- DSCR +4.0/10.0
- Rent growth +3.9/5.0
- Livability +3.9/5.0
- 1% rule +3.8/10.0
- Schools +2.9/10.0
- Condition / age +2.5/5.0
- Appreciation +0.0/10.0
$185,000
🖨 Deal sheet (PDF) 📄 Offer letter ✓ Due diligence
Listing remarks
Well-maintained and move-in ready, this charming garden home offers the perfect blend of comfort, convenience, and community living. Filled with natural light, the thoughtfully designed floor plan features inviting living spaces, an open-concept layout, and three spacious bedrooms with two full baths. Step outside to a fenced backyard that provides the perfect setting to relax, entertain guests, or simply enjoy the outdoors. Recent updates include a newer roof (2020) and water heater (2023), adding value and peace of mind for years to come. Ideally located within walking distance of the neighborhood pool and just minutes from shopping, dining, and schools, this home offers an exceptional op
Key facts
- Newer roof
- Water heater
- Neighborhood pool
Tags
Property features AI
Finance
- Other: Subdivision: Village At Magnolia
- Financial info: No additional financial details provided
- HOA & community: Homeowners association with annual fee (approximately $204/year); Community amenities include a pool
Exterior
- Parking: Concrete driveway; no garage
- Security: Prewired for security
- Utilities: Sewer connected
- Home design: Single-family residential home; One story
- Construction: Brick and vinyl siding exterior; Shingle/composition roof; Slab foundation; Built area not specified
- Exterior features: Wood fencing; Level lot; Paved road access; Community outdoor pool
Interior
- Kitchen: Dishwasher; Electric oven; Electric range; Microwave; Garbage disposal; Refrigerator
- Bedrooms: Bedrooms not specified
- Flooring: Flooring details not specified
- Bathrooms: 2 full bathrooms
- Heating & cooling: Central heating; Ceiling fan cooling
- Interior features: Ceiling fans throughout; Blinds on windows; Prewired security
- Laundry & utility: Washer and dryer included; Laundry closet; Gas water heater
Neighborhood map
What this means for you Summary
Snapshot
- This is a 3-bed/2.0-bath single-family listed at $185k.
Deal economics
- At list price, monthly cash flow is $-4 ($-45/yr) — negative.
- To cash-flow at today's rent, offer at most $184k (0.3% below list).
- To meet the 1% rule (rent ≥ 1% of price), the offer needs to be $164k (11.6% below list).
- Recommended offer: $164k (11.6% below list) — sets the bar for 1% rule.
- Cap rate 6.3% vs local median 3.4% in Tuscaloosa — top-decile yield for the area; either an underpriced asset or a hidden risk that comps aren't pricing in. Stress-test before assuming the spread holds.
Location & tenants
- Location reads 77/100 on livability (#9 in AL, #2,909 nationally) — a middle-class / working-renter tenant base. Strengths: amenities A+, health & safety A+, cost of living A; Watch: crime F, employment D-.
- Tuscaloosa County (suburban): math 21% / reading 45% proficiency, ranked #47 of 129 in AL (top 36%) — families likely to look elsewhere, expect single-tenant / working-renter base with shorter leases.
- Zoned schools: Englewood Elementary School (math 19% / reading 48%, grade F, #318 of 627 statewide, top 51%, 512 students, 74% FRL); Hillcrest High School (math 18% / reading 26%, grade F, #142 of 305 statewide, top 51%, 1,356 students, 65% FRL) — zoned schools average 69% FRL vs 45% district-wide (24 pts higher); higher-poverty schools than district average — tighter screening recommended.
- Market conditions: Rents rising fast (+5.4%/yr); 462 active listings in the ZIP; 7 comparable units currently listed for rent nearby; rentals lingering (median 46d on market — plan ~5-8 weeks vacancy on turnover, expect pricing pressure); 71% of comp listings sitting > 30 days — soft ceiling on asking rent; 622 units permitted in Tuscaloosa County in 2024 (69 in 5+ unit buildings).
- This rent runs 31% of the median local income ($62k/yr) — at the standard rent-burdened threshold; future hikes will face affordability resistance.
Forward outlook
- Local home prices are declining (-3.0%/yr); year-one equity from $1k of loan paydown is wiped out by about $6k of value loss. Plan a longer hold.
- Tuscaloosa County population projected at +26% by 2050 — long-run rental-demand tailwind backs the buy-and-hold thesis.
Negotiation context
- Only 6 days on market — expect competitive offers; lowballing is unlikely to land.
- Current owner paid $128k; 45% above their basis — modest negotiation headroom, anchor on the comps not their cost.
Risks & watch-outs
- Climate carrying-cost: major wind risk, 58% chance of damaging wind over 30y; extreme-heat days projected 7→21/yr by 2055 (HVAC capex compounding) — expect insurance premiums to compound above CPI over the hold.
Questions for the listing agent
- What do current leases actually rent for vs. the listed asking? Can we see a recent rent roll and the last 12 months of T-12 income?
- What does the HOA fee cover, when was the last increase, and are there any pending special assessments or reserve-fund shortfalls?
- Is there a deadline driving the sale (1031 exchange, divorce, estate, relocation)? That informs how much negotiation room exists.
- Crime grade is F in this area — have there been break-ins, vandalism, or insurance claims at this property in the last 3 years? What carrier currently insures it and at what premium?
- The area grade is low — what's the realistic commute time and amenity access for the typical tenant pool here? Any planned neighborhood developments (good or bad) we should know about?
- What's the average days-on-market for RENTAL listings here right now (not sales)? A rising rental-DOM trend means longer vacancies and softer asking-rent achievability than the comps imply.
- What's the recent tenant-quality profile in this submarket — average credit score on applications, eviction rate, late-payment / NSF rate, and stable-employment percentage? A property-management company in the area should have these aggregated.
- How much new for-sale + rental construction is in the pipeline within 1–3 miles? Heavy new supply typically softens prices + rents 12–24 months out; constrained supply supports both.
Investment metrics
- 1% rule
- 0.88% ✗
- Cap rate
- 6.27%
- Cash-on-cash
- -0.09%
- DSCR
- 1.00
- GRM
- 9.4
CMA / ARV
- ARV (on-the-fly)
- $228,762
- Comps found
- 12
Show comp detail 12 sales within ~0.75 mi
| Address | Dist | Beds/Ba | Sqft | Sold | Price | $/sf | Match |
|---|---|---|---|---|---|---|---|
| 2303 Starlight Dr | 0.03mi | 3/2.0 | 1,278 (0%) | 4mo | $175,000 | $137 | 95 |
| 9706 Moonlight Dr | 0.10mi | 3/2.0 | 1,278 (0%) | 2mo | $197,000 | $154 | 94 |
| 2140 Starlight Dr | 0.07mi | 2/2.0 (-1) | 1,231 (-4%) | 2mo | $186,900 | $152 | 84 |
| 2431 Starlight Dr | 0.06mi | 2/2.0 (-1) | 1,222 (-4%) | 4mo | $205,000 | $168 | 81 |
| 2124 Stardust Dr | 0.12mi | 3/2.0 | 1,460 (+14%) | 1mo | $220,000 | $151 | 70 |
| 2253 Stone Ave | 0.52mi | 3/2.0 | 1,234 (-3%) | 4mo | $229,974 | $186 | 67 |
| 2320 Stone Ave | 0.48mi | 3/2.0 | 1,355 (+6%) | 2mo | $258,040 | $190 | 66 |
| 2304 Stone Ave | 0.48mi | 3/2.0 | 1,355 (+6%) | 4mo | $254,880 | $188 | 64 |
| 10431 Patton Ln | 0.56mi | 3/2.0 | 1,337 (+5%) | 4mo | $239,900 | $179 | 63 |
| 9931 Lenox Cir | 0.35mi | 3/2.0 | 1,420 (+11%) | 3mo | $238,800 | $168 | 63 |
| 10415 Patton Ln | 0.52mi | 3/2.0 | 1,355 (+6%) | 4mo | $244,918 | $181 | 62 |
| 2309 Stone Ave | 0.58mi | 3/2.0 | 1,143 (-11%) | 5mo | $235,620 | $206 | 52 |
Match score weights: distance 35% · size 25% · config 20% · recency 20%. Top-matched comps best support the ARV.
Projected returns pro-forma
-3.0% appreciation · 5.42% rent growth · sell at horizon
- IRR
- -13.7%
- Equity multiple
- 0.50×
- Total profit
- $-26,102
- Equity at exit
- $27,584
- IRR
- -1.4%
- Equity multiple
- 0.90×
- Total profit
- $-5,308
- Equity at exit
- $15,995
Cash invested: $51,800 (down + closing). Projections, not guarantees.
Landlord ↔ Tenant lean methodology
- Overall (STATE)
- 90 Strongly Landlord-Friendly
- State Alabama
- 90 Strongly Landlord-Friendly · R+15
- County
- — inherits STATE
- City
- — inherits STATE
ZIP-level market 35405
- Home prices YoY
- -26.9%
- Rents YoY
- 5.4%
- Active inventory
- 462
- Price-to-rent
- 9.4×
Monthly cashflow live
- Estimated rent
- $1,635 high interval (Pro) →
- Mortgage (P&I)
- −$970
- Tax est. 1.5%
- −$231 /mo · $2,775/yr
- Insurance
- −$77
- HOA
- −$17
- Vacancy / Maint / Mgmt
- −$343
- Net cashflow
- $-4
Break-even live
Sensitivity live
| Price | -10% $124 | -5% $60 | +0% $-4 | +5% $-68 | +10% $-132 |
|---|---|---|---|---|---|
| Rent | -10% $-133 | -5% $-68 | +0% $-4 | +5% $61 | +10% $125 |
| Rate | -1.0pp $89 | -0.5pp $43 | base $-4 | +0.5pp $-52 | +1.0pp $-100 |
UW: 25.0% down · 7.5% · 30yr · 1.5% tax · 5.0% vac · 8.0% maint · 8.0% mgmt
Financing live
Cash to close
- Down payment
- $46,250
- Closing costs
- $5,550
- Reserves months
- —
- Total cash needed
- —
Loan-product check · same deal, 3 products live
Conventional
25% down · 7.5% · 30yr
- Down + closing
- —
- Monthly P&I
- —
- Monthly cashflow
- —
- DSCR
- —
- Eligible?
- —
Personal DTI + credit; lowest rate.
DSCR
20% down · 8.5% · 30yr
- Down + closing
- —
- Monthly P&I
- —
- Monthly cashflow
- —
- DSCR
- —
- Eligible?
- —
No personal income docs; deal must DSCR.
Hard money
10% down · 12.0% · 12mo
- Down + closing
- —
- Monthly P&I
- —
- Monthly cashflow
- —
- DSCR
- —
- Eligible?
- —
Short-term bridge; refi at stabilization.
Rent comps 7 comps
| Address | Beds | Baths | Sqft | Rent | $/sqft | DOM | Units | Dist |
|---|---|---|---|---|---|---|---|---|
| 9717 Full Moon Cir Tuscaloosa, AL | 3.0 | 2.0 | 1278 | $1,550 | $1.21 | 15d | 1 | 0.08mi |
| 1451 Maxwell Cir Tuscaloosa, AL | 4.0 | 2.0 | 1498 | $1,745 | $1.16 | 23d | 1 | 0.69mi |
| 9295 Havenridge Loop Tuscaloosa, AL | 4.0 | 2.0 | 1583 | $1,745 | $1.10 | 45d | 1 | 1.15mi |
| 9594 Havenridge Loop Tuscaloosa, AL | 3.0 | 2.0 | 1679 | $1,795 | $1.07 | 45d | 1 | 1.30mi |
| 9576 Havenridge Loop Tuscaloosa, AL | 3.0 | 2.0 | 1493 | $1,795 | $1.20 | 45d | 1 | 1.33mi |
| 9230 Parkway Gardens Loop Tuscaloosa, AL | 4.0 | 2.0 | 1774 | $1,995 | $1.12 | 45d | 1 | 1.41mi |
| 9212 Parkway Gardens Loop Tuscaloosa, AL | 4.0 | 2.0 | 1774 | $1,796 | $1.01 | 45d | 1 | 1.43mi |
HOA detail
- Monthly dues
- $17 · $204/yr
- Likely covers
- waterpool
Listing history 7 events
-
2026-06-17status $185,000 Pending 6 DOM
-
2026-06-17days on market $185,000 Active 6 DOM
-
2026-06-16days on market $185,000 Active 5 DOM
-
2026-06-15days on market $185,000 Active 4 DOM
-
2026-06-14days on market $185,000 Active 2 DOM
-
2026-06-13remarks 699-char remark
-
2026-06-13$185,000 Active 1 DOM
ⓘ Source: listings_history table (triggers on properties + properties_extension) + one-shot
backfill from property_details.listing_events for pre-trigger history.
Climate risk First Street
- Flood 1/10 Low FEMA zone X (unshaded) · 0% chance over 30 yrs
- Wildfire 4/10 Moderate
- Heat 8/10 Severe 7 d/yr ≥108°F today · 21 d/yr by 30 yrs out
- Wind 6/10 Major 58% chance of damaging wind over 30 yrs
- Air quality 1/10 Low 0 unhealthy d/yr today · 0 by 30 yrs out
Nearby sold comps map
Loading sold comps map…
Walkable amenities ~0.75 mi
Loading nearby amenities…
Taxation est. · year 1
- Rental income
- $19,622
- − Mortgage interest
- −$10,363
- − Property taxes
- −$2,775
- − Insurance
- −$925
- − Repairs & maintenance
- −$1,570
- − Management
- −$1,570
- − HOA
- −$204
- − Depreciation
- −$5,382
- Taxable loss
- −$3,166
- Est. tax savings @ 24.0%
- +$760
- After-tax cash flow
- $715/yr
For passive investors: Depreciation is non-cash, so a rental often shows a tax loss while cash-flowing — sheltering income. Rental losses are passive: they offset passive income freely, and up to $25,000/yr can offset ordinary (W-2) income if you actively participate and your MAGI is under $100k (phasing out to $0 by $150k); unused losses carry forward. On sale, claimed depreciation is recaptured at up to 25%, and gains may owe capital-gains tax (a 1031 exchange can defer both). Figures are a year-1 estimate at your 24.0% rate — not tax advice; consult a CPA.
Schools (NCES district)
- District
- Tuscaloosa County
- NCES district ID
- 0103390
- Math proficiency
- 21% ▼ -24.00%
- Reading proficiency
- 45% ▲ 2.00%
- Median HH income
- $53,000
- Composite
- 28.88/100
- National rank
- #6641
- State rank
- #47 of 129 in AL
Livability — Tuscaloosa
- Score
- 77/100
- State rank
- #9
- US rank
- #2909
Category grades
Schools grade is shown separately in the Schools card above.
Census & demographics
- County
- Tuscaloosa County · 206,491 people
- City population
- 134,228
- Metro
- Tuscaloosa, AL
- Population (ZIP)
- 49,420
- Household income
- $62,301
- Rent vs Own
- Severe rent burden
- 1963.0
Population outlook (Tuscaloosa County) Hauer SSP2
- Today (2025)
- 228,293 people
- By 2030
- 240,551 · +5.4%
- By 2040
- 263,856 · +15.6%
- By 2050
- 286,491 · +25.5%
- By 2075
- 335,783 · +47.1%
- By 2100
- 370,520 · +62.3%
Race, ethnicity, and origin ACS 2023
- Neighborhood character
- Diverse neighborhood (Simpson 0.56)
- Race & ethnicity
- Black 56% White 35% Hispanic / Latino 5% Two or more races 3% Asian 2%
- Hispanic origin (detail)
- Mexican 2%
- Common ancestry
- Italian 1% Lithuanian 1% Slovak 1%
- Foreign-born
- 5% · Canada, China
- Languages at home
- 94% English-only · Spanish 4% Other Indo-European 1% Chinese 1%
Political lean MEDSL · Tuscaloosa
- 2024 margin
- Strong R (+20.4) · D 39.4% · R 59.8%
- 2008→2024 swing
- -4.4pp toward R · 2008: -16.0pp · 2024: -20.4pp
- All cycles
- 2024: R+20.4 2020: R+14.8 2016: R+19.5 2012: R+17.4 2008: R+16.0
Not yet ingested
- Civics
- —
Market trends
- HPI YoY
- ▼ -71.25%
- Current HPI
- 193.1929
- Rent YoY
- ▲ 5.42%
- Metro
- Tuscaloosa, AL
- State GDP YoY
- ▲ 2.94%
- F500 in state
- 4
Industry mix (Fortune 500 HQ in AL)
| Industry | F500 HQs | Revenue |
|---|---|---|
| Financial Services | 1 | $8B |
|
||
| Healthcare | 1 | $5B |
|
||
Price history
+44.6% since first listed2 events — show timeline
- 2026-06-11 Listed $185,000 WAMLS
- 2007-05-21 Sold (Public Records) $127,900 Public Records
Property tax history
+2.1%/yrLatest (2025): $311 · +11.1% YoY. Source: county tax records.
Cash-flow waterfall
monthlySold comps — $/sqft
last 12 mo · ≤1 miLoading sold comps…