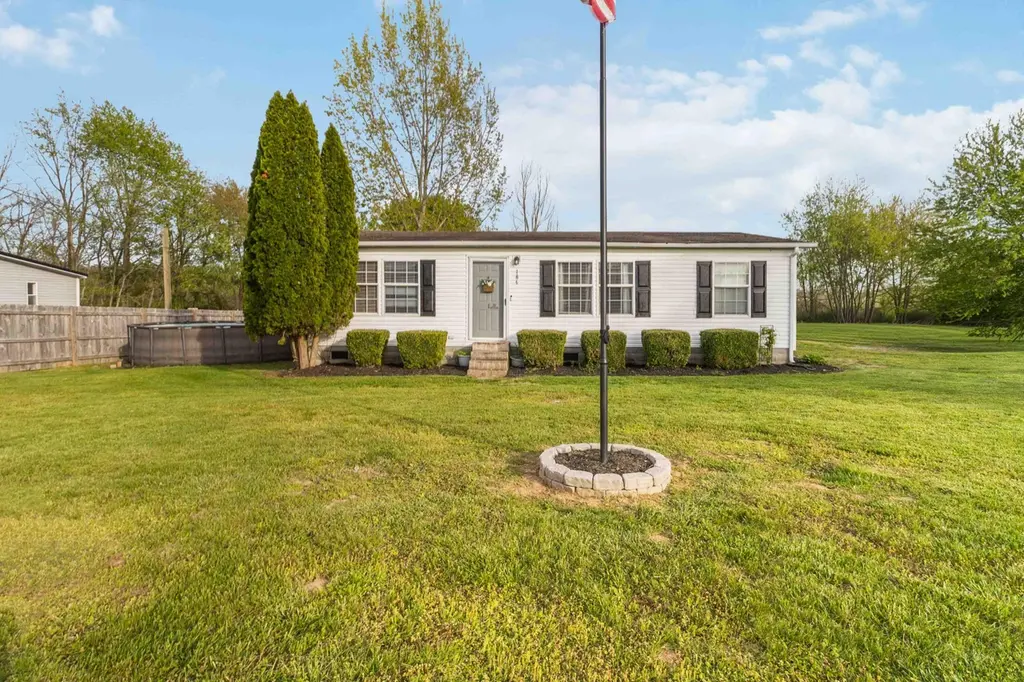
186 George Lane Rd · High Bridge, KY
Flood risk 1/10 · Minimal
- FEMA flood zone
- X (unshaded)
- Chance of flooding over 30 yrs
- 0.0%
- Est. flood insurance / yr
- $507 – $1,088
Fire risk 4/10 · Minor
- Est. fire insurance / yr
- $839 – $1,559
Heat risk 4/10 · Minor
- Hot days now (above 103°F)
- 7 days/yr
- Hot days in 30 yrs
- 20 days/yr
Wind risk 3/10 · Minor
- Chance of severe wind over 30 yrs
- 5.0%
Air-quality risk 1/10 · Minimal
- Unhealthy air days now
- 0 days/yr
- Unhealthy air days in 30 yrs
- 0 days/yr
Risk factors via First Street. Map © Google.
Why this score? — see what drove the C- grade
The composite is a weighted blend of 9 inputs, each scored 0–100. Each bar is that input's sub-score; the figure is the points it added to the 100-point composite (weight × sub-score).
- Cash flow +20.7/30.0
- ARV discount +7.5/15.0
- DSCR +6.6/10.0
- 1% rule +4.3/10.0
- Schools +3.0/10.0
- Rent growth +2.5/5.0
- Condition / age +2.5/5.0
- Livability +2.1/5.0
- Appreciation +1.0/10.0
$198,900
🖨 Deal sheet 📄 Offer letter ✓ Due diligence
Listing remarks MLS
Don't miss the opportunity to own 1.5 acres of property in beautiful Garrard County!! This beautiful well maintained home features 1 year old a/c unit and 2 year old roof.
Key facts
- Fenced yard
- 1.5 beautiful acres
- 1.5 acre lot
Tags
Neighborhood map
What this means for you Summary
Snapshot
- This is a 3-bed/2.0-bath other listed at $199k.
Deal economics
- At list price, monthly cash flow is $270 ($3k/yr) — positive.
- The deal already cash-flows at list — no discount required.
- To meet the 1% rule (rent ≥ 1% of price), the offer needs to be $185k (6.7% below list).
- Recommended offer: $185k (6.7% below list) — sets the bar for 1% rule.
Location & tenants
- Location reads 42/100 on livability (#527 in KY) — a working-class tenant base; expect higher turnover. Strengths: cost of living A+, crime A; Watch: amenities F, commute F, employment F.
- Garrard County (rural): math 28% / reading 42% proficiency, ranked #63 of 165 in KY (top 38%) — families likely to look elsewhere, expect single-tenant / working-renter base with shorter leases.
- Zoned schools: Camp Dick Robinson Elementary School (math 47% / reading 47%, grade D-, #119 of 676 statewide, top 19%, 464 students, 61% FRL); Garrard County High School (math 27% / reading 37%, grade F, #97 of 254 statewide, top 46%, 801 students, 59% FRL).
- Market conditions: 168 active listings in the ZIP.
Forward outlook
- Local home prices are declining (-3.0%/yr); year-one equity from $1k of loan paydown is wiped out by about $6k of value loss. Plan a longer hold.
Negotiation context
- Only 4 days on market — expect competitive offers; lowballing is unlikely to land.
- 3 sale attempts since 9y ago with the ask held roughly flat each time — persistent listings suggest the price (not the market) is what's stuck; bring a comps-based counter.
- Current owner paid $74k; list at $199k implies a 167% gain — meaningful room to come down on a strong offer.
Questions for the listing agent
- Is there a deadline driving the sale (1031 exchange, divorce, estate, relocation)? That informs how much negotiation room exists.
- Schools are F-rated, which usually means shorter tenancies and higher turnover. Who's the typical renter profile here, and what's been the actual vacancy rate?
- What's the average days-on-market for RENTAL listings here right now (not sales)? A rising rental-DOM trend means longer vacancies and softer asking-rent achievability than the comps imply.
- What's the recent tenant-quality profile in this submarket — average credit score on applications, eviction rate, late-payment / NSF rate, and stable-employment percentage? A property-management company in the area should have these aggregated.
- How much new for-sale + rental construction is in the pipeline within 1–3 miles? Heavy new supply typically softens prices + rents 12–24 months out; constrained supply supports both.
Investment metrics
- 1% rule
- 0.93% ✗
- Cap rate
- 7.92%
- Cash-on-cash
- 5.83%
- DSCR
- 1.26
- GRM
- 8.9
CMA / ARV
No comps found within radius.
Projected returns pro-forma
-3.0% appreciation · 3.0% rent growth · sell at horizon
- IRR
- -7.3%
- Equity multiple
- 0.73×
- Total profit
- $-15,090
- Equity at exit
- $29,657
- IRR
- 2.2%
- Equity multiple
- 1.16×
- Total profit
- $8,702
- Equity at exit
- $17,197
Cash invested: $55,692 (down + closing). Projections, not guarantees.
Landlord ↔ Tenant lean methodology
- Overall (STATE)
- 83 Strongly Landlord-Friendly
- State Kentucky
- 83 Strongly Landlord-Friendly · R+16
- County
- — inherits STATE
- City
- — inherits STATE
ZIP-level market 40444
- Home prices YoY
- -2.6%
- Active inventory
- 168
- Price-to-rent
- 8.9×
Monthly cashflow live
- Estimated rent
- $1,855 medium interval (Pro) →
- Mortgage (P&I)
- −$1,043
- Tax from tax record
- −$69 /mo · $829/yr
- Insurance
- −$83
- HOA
- −$0
- Vacancy / Maint / Mgmt
- −$390
- Net cashflow
- $270
Break-even live
UW: 25.0% down · 7.5% · 30yr · 1.5% tax · 5.0% vac · 8.0% maint · 8.0% mgmt
Financing live
Cash to close
- Down payment
- $49,725
- Closing costs
- $5,967
- Reserves months
- —
- Total cash needed
- —
Loan-product check · same deal, 3 products live
Conventional
25% down · 7.5% · 30yr
- Down + closing
- —
- Monthly P&I
- —
- Monthly cashflow
- —
- DSCR
- —
- Eligible?
- —
Personal DTI + credit; lowest rate.
DSCR
20% down · 8.5% · 30yr
- Down + closing
- —
- Monthly P&I
- —
- Monthly cashflow
- —
- DSCR
- —
- Eligible?
- —
No personal income docs; deal must DSCR.
Hard money
10% down · 12.0% · 12mo
- Down + closing
- —
- Monthly P&I
- —
- Monthly cashflow
- —
- DSCR
- —
- Eligible?
- —
Short-term bridge; refi at stabilization.
Listing history 9 events
-
2026-04-21status Pending
-
2026-04-17$198,900 Active
-
2017-12-06soldstatus $74,500
-
2017-11-30soldstatus $74,500 Sold 171-char remark
Show marketing remark (72 chars)
Don't miss the opportunity to own 1.5 acres in beautiful Garrard County!
-
2017-11-30soldstatus 72-char remark
Show marketing remark (72 chars)
Don't miss the opportunity to own 1.5 acres in beautiful Garrard County!
-
2017-10-15status Pending 171-char remark
Show marketing remark (171 chars)
Don't miss the opportunity to own 1.5 acres of property in beautiful Garrard County!! This beautiful well maintained home features 1 year old a/c unit and 2 year old roof.
-
2017-10-04price $72,900 171-char remark
Show marketing remark (171 chars)
Don't miss the opportunity to own 1.5 acres of property in beautiful Garrard County!! This beautiful well maintained home features 1 year old a/c unit and 2 year old roof.
-
2017-09-22$79,900 Active 171-char remark
Show marketing remark (72 chars)
Don't miss the opportunity to own 1.5 acres in beautiful Garrard County!
-
2017-09-22$79,900 72-char remark
Show marketing remark (72 chars)
Don't miss the opportunity to own 1.5 acres in beautiful Garrard County!
ⓘ Source: listings_history table (triggers on properties + properties_extension) + one-shot
backfill from property_details.listing_events for pre-trigger history.
Tax reassessment forecast KY · Resets to sale price
- Current annual tax
- $829 · $69/mo
- Projected year-2 tax
- $1,711 · $143/mo
- Expected delta
- +$882/yr (+$73/mo · 106.4%)
ⓘ Screening estimate from a state-policy table — verify with the county assessor before closing.
Climate risk First Street
- Flood 1/10 Low FEMA zone X (unshaded) · 0% chance over 30 yrs
- Wildfire 4/10 Moderate
- Heat 4/10 Moderate 7 d/yr ≥103°F today · 20 d/yr by 30 yrs out
- Wind 3/10 Moderate 5% chance of damaging wind over 30 yrs
- Air quality 1/10 Low 0 unhealthy d/yr today · 0 by 30 yrs out
Nearby sold comps map
Loading sold comps map…
Walkable amenities ~0.75 mi
Loading nearby amenities…
Taxation est. · year 1
- Rental income
- $22,259
- − Mortgage interest
- −$11,141
- − Property taxes
- −$829
- − Insurance
- −$994
- − Repairs & maintenance
- −$1,781
- − Management
- −$1,781
- − Depreciation
- −$5,786
- Taxable loss
- −$53
- Est. tax savings @ 24.0%
- +$13
- After-tax cash flow
- $3,258/yr
For passive investors: Depreciation is non-cash, so a rental often shows a tax loss while cash-flowing — sheltering income. Rental losses are passive: they offset passive income freely, and up to $25,000/yr can offset ordinary (W-2) income if you actively participate and your MAGI is under $100k (phasing out to $0 by $150k); unused losses carry forward. On sale, claimed depreciation is recaptured at up to 25%, and gains may owe capital-gains tax (a 1031 exchange can defer both). Figures are a year-1 estimate at your 24.0% rate — not tax advice; consult a CPA.
Schools (NCES district)
- District
- Garrard County
- NCES district ID
- 2102160
- Math proficiency
- 28% ▼ -12.00%
- Reading proficiency
- 42% ▼ -11.00%
- Median HH income
- $43,411
- Composite
- 29.67/100
- National rank
- #6462
- State rank
- #63 of 165 in KY
Livability — High Bridge
- Score
- 42/100
- State rank
- #527
- US rank
- #26998
Category grades
Schools grade is shown separately in the Schools card above.
Census & demographics
- Population (ZIP)
- 14,207
Population outlook (Garrard County) Hauer SSP2
- Today (2025)
- 17,852 people
- By 2030
- 18,018 · +0.9%
- By 2040
- 18,076 · +1.3%
- By 2050
- 17,592 · -1.5%
- By 2075
- 16,128 · -9.7%
- By 2100
- 13,489 · -24.4%
Race, ethnicity, and origin ACS 2023
- Neighborhood character
- Predominantly White (91%)
- Race & ethnicity
- White 91% Two or more races 4% Hispanic / Latino 3% Black 3%
- Common ancestry
- Italian 1% Subsaharan African 1% Slovak 1%
- Foreign-born
- 3% · Canada, Dominican Republic
- Languages at home
- 97% English-only · Spanish 1% Russian/Polish/Slavic 1%
Political lean MEDSL · Garrard
- 2024 margin
- Solid R (+60.2) · D 19.3% · R 79.5% · Other 1.3%
- 2008→2024 swing
- -17.1pp toward R · 2008: -43.1pp · 2024: -60.2pp
- All cycles
- 2024: R+60.2 2020: R+56.6 2016: R+58.5 2012: R+51.6 2008: R+43.1
Not yet ingested
- Civics
- —
Market trends
- HPI YoY
- ▼ -8.08%
- Current HPI
- 297.6233
- Rent YoY
- —
- Metro
- —
- State GDP YoY
- ▲ 1.81%
- F500 in state
- 4
Industry mix (Fortune 500 HQ in KY)
| Industry | F500 HQs | Revenue |
|---|---|---|
| Healthcare | 1 | $118B |
|
||
| Food / Beverage | 1 | $7B |
|
||
Price history
+148.9% since first listed9 events — show timeline
- 2026-04-21 Pending — ImagineMLS
- 2026-04-17 Listed $198,900 ImagineMLS
- 2017-12-06 Sold (Public Records) $74,500 Public Records
- 2017-11-30 Sold (MLS) — CKAR
- 2017-11-30 Sold (MLS) $74,500 ImagineMLS
- 2017-10-15 Pending — ImagineMLS
- 2017-10-04 Price Changed $72,900 ImagineMLS
- 2017-09-22 Listed $79,900 ImagineMLS
- 2017-09-22 Listed $79,900 CKAR
Property tax history
+1.6%/yrLatest (2025): $829 · -0.5% YoY. Source: county tax records.
Cash-flow waterfall
monthlySold comps — $/sqft
last 12 mo · ≤1 miLoading sold comps…