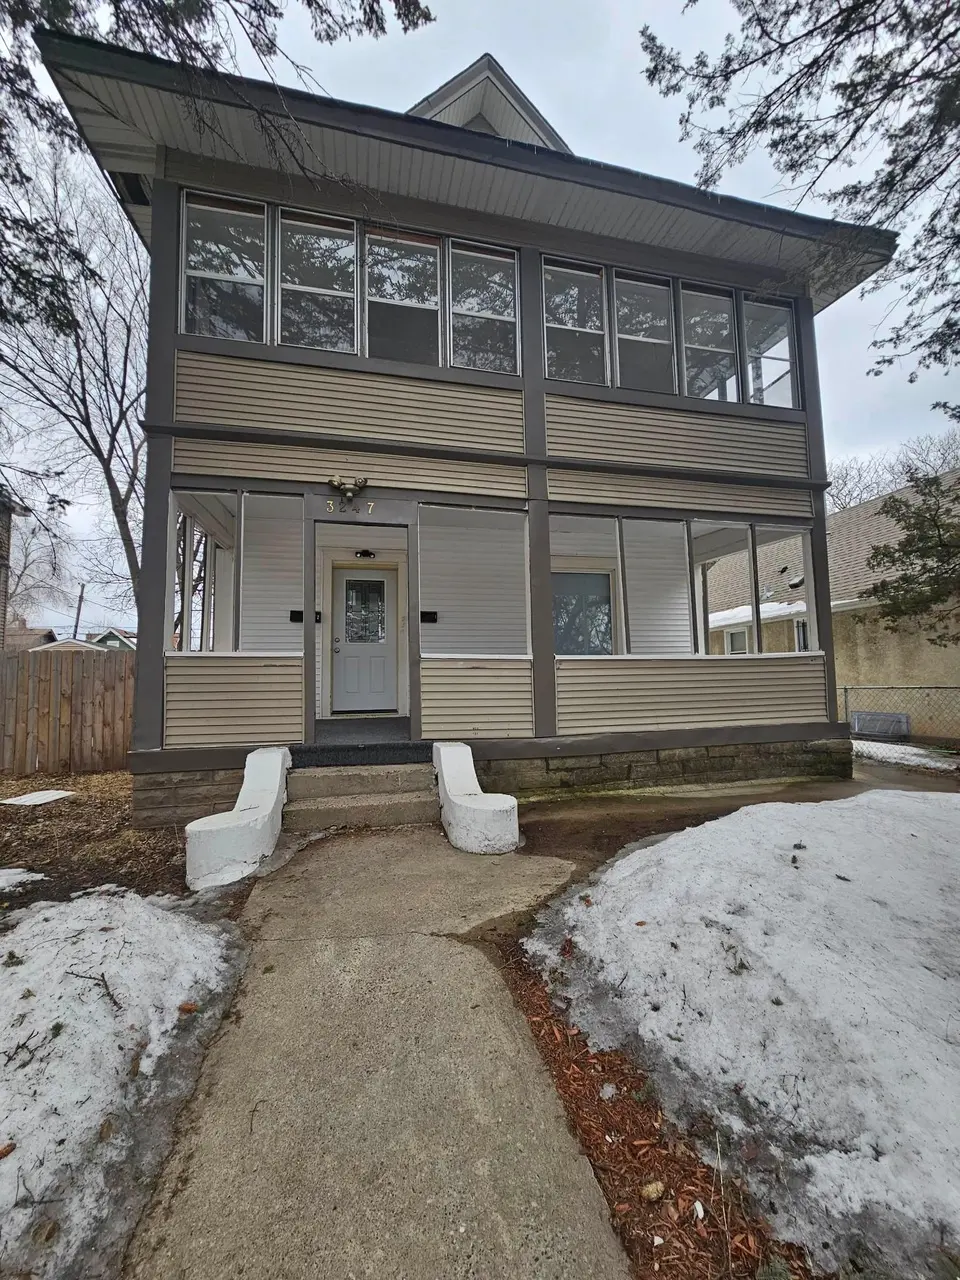
3247 Aldrich Ave N · Minneapolis, MN
Flood risk 1/10 · Minimal
- FEMA flood zone
- X (unshaded)
- Chance of flooding over 30 yrs
- 0.0%
- Est. flood insurance / yr
- $473 – $860
Fire risk 1/10 · Minimal
- Est. fire insurance / yr
- $888 – $1,650
Heat risk 2/10 · Minimal
- Hot days now (above 99°F)
- 7 days/yr
- Hot days in 30 yrs
- 14 days/yr
Wind risk 2/10 · Minimal
- Chance of severe wind over 30 yrs
- —
Air-quality risk 2/10 · Minimal
- Unhealthy air days now
- 1 days/yr
- Unhealthy air days in 30 yrs
- 1 days/yr
Risk factors via First Street. Map © Google.
Why this score? — see what drove the D+ grade
The composite is a weighted blend of 9 inputs, each scored 0–100. Each bar is that input's sub-score; the figure is the points it added to the 100-point composite (weight × sub-score).
- Cash flow +15.2/30.0
- ARV discount +7.5/15.0
- DSCR +4.7/10.0
- Rent growth +4.1/5.0
- 1% rule +4.0/10.0
- Livability +3.9/5.0
- Schools +3.5/10.0
- Condition / age +2.5/5.0
- Appreciation +0.0/10.0
$280,000
🖨 Deal sheet (PDF) 📄 Offer letter ✓ Due diligence
Listing remarks MLS
Newest updates include refinished and new flooring throughout, counter tops, freshly painted, front door, tub, vanity, tub surround and sinks. Since purchasing the home in 2011 seller has made the following repairs and updates: 2 boilers, plumbing, roof, 6 ft privacy fencing, water heaters. On and off street parking. $42,000 annual rent. Main level unit 3 bed was rented for $1500. Upstairs 4 bed was rented for $2000.
Key facts
- Insulation
- Finished attic
- Sump pump
Tags
Property features AI
Finance
- Other: Owner not occupied; Fractional ownership: no
- Financial info: FHA mortgage type; Rental license: standard (licensed for rental); Property used as residential income with 2 units; Gross income: $42,000; Net operating income: $37,200; Water & sewer expense: $1,000; Trash expense: $500; Insurance expense: $2,300; Maintenance expense: $1,000
- HOA & community: Porch listed as an association amenity
Exterior
- Parking: 2 parking spaces per unit (total described per unit)
- Utilities: City water (connected); City sewer (connected); Natural gas
- Home design: Duplex (up and down); Two levels; Entry level living area present
- Construction: Block foundation
- Exterior features: Vinyl exterior; 46 x 127 lot dimensions; City street frontage on paved streets
Interior
- Kitchen: Range; Refrigerator; Kitchen window
- Bedrooms: 7 total bedrooms
- Flooring: Hardwood floors
- Bathrooms: 2 total bathrooms (full bathrooms indicated)
- Heating & cooling: Baseboard heating; No central cooling
- Interior features: Hardwood floors; Natural woodwork; Walk-in closet; Porch; Patio
- Laundry & utility: Basement utility space (full basement)
Neighborhood map
What this means for you Summary
Snapshot
- This is a 4-bed/2.0-bath other listed at $280k.
Deal economics
- At list price, monthly cash flow is $96 ($1k/yr) — positive.
- The deal already cash-flows at list — no discount required.
- To meet the 1% rule (rent ≥ 1% of price), the offer needs to be $251k (10.5% below list).
- Recommended offer: $251k (10.5% below list) — sets the bar for 1% rule.
- Cap rate 6.7% vs local median 3.1% in Minneapolis — top-decile yield for the area; either an underpriced asset or a hidden risk that comps aren't pricing in. Stress-test before assuming the spread holds.
Location & tenants
- Location reads 78/100 on livability (#110 in MN, #2,525 nationally) — a middle-class / working-renter tenant base. Strengths: amenities A+, commute A+, housing A+; Watch: cost of living C-, crime F.
- Minneapolis Public School District (urban): math 35% / reading 46% proficiency, ranked #217 of 301 in MN (top 72%) — families likely to look elsewhere, expect single-tenant / working-renter base with shorter leases.
- Zoned schools: Nellie Stone Johnson Elementary (math 2% / reading 17%, grade F, #829 of 857 statewide, top 98%, 201 students, 96% FRL); Franklin Middle (math 2% / reading 8%, grade F, #255 of 258 statewide, top 100%, 287 students, 89% FRL); Henry High (reading 70%, 858 students, 80% FRL) — zoned schools average 88% FRL vs 58% district-wide (30 pts higher); higher-poverty schools than district average — tighter screening recommended.
- Zoned-school proficiency averages 7% at this address vs 40% district-wide (-33 pts) — the specific schools serving this property underperform the Minneapolis Public School District average; the district grade overstates school quality for this exact location.
- Market conditions: Rents rising fast (+6.3%/yr); 167 active listings in the ZIP; 26 comparable units currently listed for rent nearby; rentals at typical pace (median 27d on market — plan ~3-4 weeks tenant-placement turnaround); 4,651 units permitted in Hennepin County in 2024 (2,443 in 5+ unit buildings).
- This rent runs 44% of the median local income ($69k/yr) — at the standard rent-burdened threshold; future hikes will face affordability resistance.
Forward outlook
- Local home prices are declining (-3.0%/yr); year-one equity from $2k of loan paydown is wiped out by about $8k of value loss. Plan a longer hold.
- Hennepin County population projected at +30% by 2050 — long-run rental-demand tailwind backs the buy-and-hold thesis.
Negotiation context
- It's been on market 63 days — a 6% lower offer ($263k) is reasonable based on typical stale-listing flexibility.
- 8 sale attempts since 34y ago; this cycle's ask has dropped $40k (12%) from the opening price — seller is motivated, your offer sets the floor, not the list.
Risks & watch-outs
- Watch-outs: built in 1915 — expect roof / HVAC / electrical / plumbing capex.
Questions for the listing agent
- It's been on market 63 days. Have you received any prior offers? Is the seller open to a 10% concession, seller financing, or rate buy-down credit?
- Built in 1915 — when were the roof, HVAC, electrical panel, plumbing, and water heater last replaced?
- Why hasn't it sold? Are there any deal-killer items the seller is aware of (foundation, flood, title, zoning, code violations)?
- Is there a deadline driving the sale (1031 exchange, divorce, estate, relocation)? That informs how much negotiation room exists.
- Crime grade is F in this area — have there been break-ins, vandalism, or insurance claims at this property in the last 3 years? What carrier currently insures it and at what premium?
- The area grade is low — what's the realistic commute time and amenity access for the typical tenant pool here? Any planned neighborhood developments (good or bad) we should know about?
- What's the average days-on-market for RENTAL listings here right now (not sales)? A rising rental-DOM trend means longer vacancies and softer asking-rent achievability than the comps imply.
- What's the recent tenant-quality profile in this submarket — average credit score on applications, eviction rate, late-payment / NSF rate, and stable-employment percentage? A property-management company in the area should have these aggregated.
- How much new for-sale + rental construction is in the pipeline within 1–3 miles? Heavy new supply typically softens prices + rents 12–24 months out; constrained supply supports both.
Investment metrics
- 1% rule
- 0.90% ✗
- Cap rate
- 6.70%
- Cash-on-cash
- 1.47%
- DSCR
- 1.07
- GRM
- 9.3
CMA / ARV
No comps found within radius.
Projected returns pro-forma
-3.0% appreciation · 6.35% rent growth · sell at horizon
- IRR
- -10.4%
- Equity multiple
- 0.61×
- Total profit
- $-30,531
- Equity at exit
- $41,749
- IRR
- 3.0%
- Equity multiple
- 1.25×
- Total profit
- $19,683
- Equity at exit
- $24,209
Cash invested: $78,400 (down + closing). Projections, not guarantees.
Landlord ↔ Tenant lean methodology
- Overall (CITY)
- 34 Tenant-Leaning
- State Minnesota
- 46 Balanced · D+2
- County
- — inherits STATE
- City Minneapolis
- 34 Tenant-Leaning · D+50
ZIP-level market 55412
- Home prices YoY
- -26.9%
- Rents YoY
- 6.3%
- Active inventory
- 167
- Price-to-rent
- 9.3×
Monthly cashflow live
- Estimated rent
- $2,506 high interval (Pro) →
- Mortgage (P&I)
- −$1,468
- Tax from tax record
- −$299 /mo · $3,587/yr
- Insurance
- −$117
- HOA
- −$0
- Vacancy / Maint / Mgmt
- −$526
- Net cashflow
- $96
Break-even live
Sensitivity live
| Price | -10% $254 | -5% $175 | +0% $96 | +5% $17 | +10% $-63 |
|---|---|---|---|---|---|
| Rent | -10% $-102 | -5% $-3 | +0% $96 | +5% $195 | +10% $294 |
| Rate | -1.0pp $237 | -0.5pp $167 | base $96 | +0.5pp $23 | +1.0pp $-51 |
UW: 25.0% down · 7.5% · 30yr · 1.5% tax · 5.0% vac · 8.0% maint · 8.0% mgmt
Financing live
Cash to close
- Down payment
- $70,000
- Closing costs
- $8,400
- Reserves months
- —
- Total cash needed
- —
Loan-product check · same deal, 3 products live
Conventional
25% down · 7.5% · 30yr
- Down + closing
- —
- Monthly P&I
- —
- Monthly cashflow
- —
- DSCR
- —
- Eligible?
- —
Personal DTI + credit; lowest rate.
DSCR
20% down · 8.5% · 30yr
- Down + closing
- —
- Monthly P&I
- —
- Monthly cashflow
- —
- DSCR
- —
- Eligible?
- —
No personal income docs; deal must DSCR.
Hard money
10% down · 12.0% · 12mo
- Down + closing
- —
- Monthly P&I
- —
- Monthly cashflow
- —
- DSCR
- —
- Eligible?
- —
Short-term bridge; refi at stabilization.
Rent comps 26 comps
| Address | Beds | Baths | Sqft | Rent | $/sqft | DOM | Units | Dist |
|---|---|---|---|---|---|---|---|---|
| 3247 N 6th St Minneapolis, MN | 5.0 | 1.5 | 1405 | $2,350 | $1.67 | 46d | 1 | 0.16mi |
| 3247 N 6th St Minneapolis, MN | 5.0 | 1.5 | 1405 | $2,350 | $1.67 | 26d | 1 | 0.16mi |
| 3247 N 6th St Minneapolis, MN | 5.0 | 1.5 | 1405 | $2,350 | $1.67 | 24d | 1 | 0.16mi |
| 3342 Fremont Ave N Unit 2 Minneapolis, MN | 4.0 | 2.0 | 2000 | $2,200 | $1.10 | 26d | 1 | 0.28mi |
| 3522 Bryant Ave N Minneapolis, MN | 5.0 | 2.0 | 1449 | $2,995 | $2.07 | 46d | 1 | 0.30mi |
| 3238 Humboldt Ave N Minneapolis, MN | 5.0 | 1.0 | 1389 | $2,100 | $1.51 | 46d | 1 | 0.39mi |
| 3105 N Girard Ave Unit 2 Minneapolis, MN | 4.0 | 1.0 | 1250 | $2,300 | $1.84 | 26d | 1 | 0.39mi |
| 2923 Girard Ave N Minneapolis, MN | 5.0 | 2.0 | 1760 | $2,795 | $1.59 | 24d | 1 | 0.47mi |
| 2819 Girard Ave N Minneapolis, MN | 5.0 | 2.0 | 1718 | $2,300 | $1.34 | 46d | 1 | 0.53mi |
| 2643 Lyndale Ave N Minneapolis, MN | 4.0 | 2.0 | 2198 | $750 | $0.34 | 19d | 1 | 0.54mi |
| 3315 James Ave N Minneapolis, MN | 4.0 | 1.0 | 1400 | $2,100 | $1.50 | 6d | 1 | 0.54mi |
| 2646 Dupont Ave N Unit 2 Minneapolis, MN | 4.0 | 1.0 | 1514 | $2,245 | $1.48 | 46d | 1 | 0.54mi |
| 3114 Morgan Ave N Minneapolis, MN | 4.0 | 2.0 | 1362 | $2,000 | $1.47 | 16d | 1 | 0.71mi |
| 1113 N 25th Ave Minneapolis, MN | 5.0 | 2.0 | 2295 | $2,695 | $1.17 | 20d | 1 | 0.75mi |
| 3935 Fremont Ave N Minneapolis, MN | 4.0 | 1.0 | 1900 | $2,595 | $1.37 | 46d | 1 | 0.87mi |
| 1510 N 22nd Ave #1 Minneapolis, MN | 3.0 | 1.0 | 1500 | $1,875 | $1.25 | 24d | 1 | 1.02mi |
| 1510 N 22nd Ave #1 Minneapolis, MN | 3.0 | 1.0 | 1500 | $1,875 | $1.25 | 6d | 1 | 1.02mi |
| 2324 Logan Ave N Minneapolis, MN | 4.0 | 1.5 | 1400 | $2,300 | $1.64 | 46d | 1 | 1.09mi |
| 1625 Marshall St NE Minneapolis, MN | 5.0 | 3.0 | 1900 | $3,495 | $1.84 | 24d | 1 | 1.17mi |
| 1414 Golden Valley Rd Unit 2 Minneapolis, MN | 5.0 | 2.0 | 2000 | $2,595 | $1.30 | 46d | 1 | 1.19mi |
| 207 24th Ave NE Minneapolis, MN | 3.0 | 3.0 | 1575 | $2,995 | $1.90 | 46d | 1 | 1.20mi |
| 2035 W River Rd Minneapolis, MN | 1.0–4.0 | 2.0 | 1034 | $2,503 | $2.42 | 1d | 12 | 1.21mi |
| 1312 18th Ave N Minneapolis, MN | 3.0 | 1.0 | 1520 | $1,899 | $1.25 | 10d | 1 | 1.26mi |
| 1428 Marshall St NE Minneapolis, MN | 3.0 | 2.5 | 1800 | $3,300 | $1.83 | 1d | 1 | 1.27mi |
| 1705 2nd St NE Minneapolis, MN | 4.0 | 3.0 | 1600 | $2,795 | $1.75 | 4d | 1 | 1.35mi |
| 4433 N Aldrich Ave Unit 1 Minneapolis, MN | 4.0 | 1.0 | 2300 | $1,895 | $0.82 | 46d | 1 | 1.49mi |
Listing history 38 events
-
2026-06-21days on market $280,000 Active 63 DOM
-
2026-06-18days on market $280,000 Active 60 DOM
-
2026-06-17days on market $280,000 Active 59 DOM
-
2026-06-16days on market $280,000 Active 58 DOM
-
2026-06-15days on market $280,000 Active 57 DOM
-
2026-06-13days on market $280,000 Active 55 DOM
-
2026-06-09days on market $280,000 Active 51 DOM
-
2026-06-08days on market $280,000 Active 50 DOM
-
2026-06-07days on market $280,000 Active 49 DOM
-
2026-06-04days on market $280,000 Active 46 DOM
-
2026-06-03days on market $280,000 Active 45 DOM
-
2026-06-02days on market $280,000 Active 44 DOM
-
2026-06-01days on market $280,000 Active 43 DOM
-
2026-05-31days on market $280,000 Active 42 DOM
-
2026-05-15price $280,000 300-char remark
-
2026-04-19$320,000 Active 300-char remark
-
2022-12-29soldstatus $310,000
-
2022-12-15soldstatus $310,000 Sold 420-char remark
Show marketing remark (420 chars)
Newest updates include refinished and new flooring throughout, counter tops, freshly painted, front door, tub, vanity, tub surround and sinks. Since purchasing the home in 2011 seller has made the following repairs and updates: 2 boilers, plumbing, roof, 6 ft privacy fencing, water heaters. On and off street parking. $42,000 annual rent. Main level unit 3 bed was rented for $1500. Upstairs 4 bed was rented for $2000.
-
2022-11-18status Pending 420-char remark
Show marketing remark (420 chars)
Newest updates include refinished and new flooring throughout, counter tops, freshly painted, front door, tub, vanity, tub surround and sinks. Since purchasing the home in 2011 seller has made the following repairs and updates: 2 boilers, plumbing, roof, 6 ft privacy fencing, water heaters. On and off street parking. $42,000 annual rent. Main level unit 3 bed was rented for $1500. Upstairs 4 bed was rented for $2000.
-
2022-11-10price $319,000 420-char remark
Show marketing remark (420 chars)
Newest updates include refinished and new flooring throughout, counter tops, freshly painted, front door, tub, vanity, tub surround and sinks. Since purchasing the home in 2011 seller has made the following repairs and updates: 2 boilers, plumbing, roof, 6 ft privacy fencing, water heaters. On and off street parking. $42,000 annual rent. Main level unit 3 bed was rented for $1500. Upstairs 4 bed was rented for $2000.
-
2022-11-09price $329,000 420-char remark
Show marketing remark (420 chars)
Newest updates include refinished and new flooring throughout, counter tops, freshly painted, front door, tub, vanity, tub surround and sinks. Since purchasing the home in 2011 seller has made the following repairs and updates: 2 boilers, plumbing, roof, 6 ft privacy fencing, water heaters. On and off street parking. $42,000 annual rent. Main level unit 3 bed was rented for $1500. Upstairs 4 bed was rented for $2000.
-
2022-10-07$339,000 Active 420-char remark
Show marketing remark (420 chars)
Newest updates include refinished and new flooring throughout, counter tops, freshly painted, front door, tub, vanity, tub surround and sinks. Since purchasing the home in 2011 seller has made the following repairs and updates: 2 boilers, plumbing, roof, 6 ft privacy fencing, water heaters. On and off street parking. $42,000 annual rent. Main level unit 3 bed was rented for $1500. Upstairs 4 bed was rented for $2000.
-
2022-09-26historical $339,000 420-char remark
Show marketing remark (420 chars)
Newest updates include refinished and new flooring throughout, counter tops, freshly painted, front door, tub, vanity, tub surround and sinks. Since purchasing the home in 2011 seller has made the following repairs and updates: 2 boilers, plumbing, roof, 6 ft privacy fencing, water heaters. On and off street parking. $42,000 annual rent. Main level unit 3 bed was rented for $1500. Upstairs 4 bed was rented for $2000.
-
2011-07-26soldstatus $19,900
Show marketing remark (205 chars)
Up and down duplex with a lot of potential! Home features 3 bedrooms, and 1 bath in each unit, hardwood floors, natural woodwork and built-ins, front porch, and more! Needs work and TLC. Missing copper.
-
2011-07-13historical
Show marketing remark (205 chars)
Up and down duplex with a lot of potential! Home features 3 bedrooms, and 1 bath in each unit, hardwood floors, natural woodwork and built-ins, front porch, and more! Needs work and TLC. Missing copper.
-
2011-07-07$19,900
Show marketing remark (205 chars)
Up and down duplex with a lot of potential! Home features 3 bedrooms, and 1 bath in each unit, hardwood floors, natural woodwork and built-ins, front porch, and more! Needs work and TLC. Missing copper.
-
2011-06-07historical
-
2011-01-14$29,900
-
2010-11-20historical
-
2010-11-12$35,000
-
2010-10-30historical
-
2010-07-07$36,500
-
2005-03-31historical
-
2005-03-01$209,900
-
2003-03-05soldstatus $170,000
-
1997-05-28soldstatus $65,000
-
1992-09-15historical
-
1992-05-05$45,900
ⓘ Source: listings_history table (triggers on properties + properties_extension) + one-shot
backfill from property_details.listing_events for pre-trigger history.
Tax reassessment forecast MN · Partial reset (capped growth)
- Current annual tax
- $3,587 · $299/mo
- Projected year-2 tax
- $3,587 · $299/mo
- Expected delta
- $0/yr ($0/mo · 0.0%)
ⓘ Screening estimate from a state-policy table — verify with the county assessor before closing.
Climate risk First Street
- Flood 1/10 Low FEMA zone X (unshaded) · 0% chance over 30 yrs
- Wildfire 1/10 Low
- Heat 2/10 Low 7 d/yr ≥99°F today · 14 d/yr by 30 yrs out
- Wind 2/10 Low
- Air quality 2/10 Low 1 unhealthy d/yr today · 1 by 30 yrs out
Nearby sold comps map
Loading sold comps map…
Walkable amenities ~0.75 mi
Loading nearby amenities…
Taxation est. · year 1
- Rental income
- $30,073
- − Mortgage interest
- −$15,684
- − Property taxes
- −$3,587
- − Insurance
- −$1,400
- − Repairs & maintenance
- −$2,406
- − Management
- −$2,406
- − Depreciation
- −$8,145
- Taxable loss
- −$3,556
- Est. tax savings @ 24.0%
- +$853
- After-tax cash flow
- $2,004/yr
For passive investors: Depreciation is non-cash, so a rental often shows a tax loss while cash-flowing — sheltering income. Rental losses are passive: they offset passive income freely, and up to $25,000/yr can offset ordinary (W-2) income if you actively participate and your MAGI is under $100k (phasing out to $0 by $150k); unused losses carry forward. On sale, claimed depreciation is recaptured at up to 25%, and gains may owe capital-gains tax (a 1031 exchange can defer both). Figures are a year-1 estimate at your 24.0% rate — not tax advice; consult a CPA.
Schools (NCES district)
- District
- Minneapolis Public School District
- NCES district ID
- 2721240
- Math proficiency
- 35% ▼ -7.00%
- Reading proficiency
- 46% ▼ -1.00%
- Median HH income
- $50,521
- Composite
- 34.92/100
- National rank
- #5067
- State rank
- #217 of 301 in MN
Livability — Minneapolis
- Score
- 78/100
- State rank
- #110
- US rank
- #2525
Category grades
Schools grade is shown separately in the Schools card above.
Census & demographics
- Census place
- Minneapolis, MN
- County
- Hennepin County · 1,150,272 people
- City population
- 417,555
- Metro
- Minneapolis-St. Paul-Bloomington, MN-WI
- Population (ZIP)
- 24,460
- Household income
- $68,682
- Rent vs Own
- Severe rent burden
- 913.0
Population outlook (Hennepin County) Hauer SSP2
- Today (2025)
- 1,405,227 people
- By 2030
- 1,492,650 · +6.2%
- By 2040
- 1,660,157 · +18.1%
- By 2050
- 1,823,498 · +29.8%
- By 2075
- 2,221,283 · +58.1%
- By 2100
- 2,509,976 · +78.6%
Race, ethnicity, and origin ACS 2023
- Neighborhood character
- Highly diverse neighborhood (Simpson 0.73)
- Race & ethnicity
- White 36% Black 33% Hispanic / Latino 14% Two or more races 12% Asian 8% Native American 1%
- Hispanic origin (detail)
- Mexican 8%
- Common ancestry
- Portuguese 6% Lithuanian 2% Romanian 1%
- Foreign-born
- 12% · Canada
- Languages at home
- 82% English-only · Spanish 9% Other Asian/Pacific 7% Tagalog/Filipino 1%
Political lean MEDSL · Hennepin
- 2024 margin
- Solid D (+42.6) · D 70.2% · R 27.5% · Other 2.3%
- 2008→2024 swing
- +14.0pp toward D · 2008: 28.6pp · 2024: 42.6pp
- All cycles
- 2024: D+42.6 2020: D+43.2 2016: D+35.3 2012: D+27.1 2008: D+28.6
Not yet ingested
- Civics
- —
Market trends
- HPI YoY
- ▼ -109.98%
- Current HPI
- 298.1414
- Rent YoY
- ▲ 6.35%
- Metro
- Minneapolis-St. Paul-Bloomington, MN-WI
- State GDP YoY
- ▲ 2.41%
- F500 in state
- 34
Industry mix (Fortune 500 HQ in MN)
| Industry | F500 HQs | Revenue |
|---|---|---|
| Healthcare | 2 | $407B |
|
||
| Retail | 2 | $150B |
|
||
| Consumer Goods | 2 | $32B |
|
||
| Industrial Machinery | 2 | $6B |
|
||
| Agriculture | 1 | $40B |
|
||
| Healthcare / Medical Devices | 1 | $32B |
|
||
Price history
+510.0% since first listed24 events — show timeline
- 2026-05-15 Price Changed $280,000 NORTHSTARMLS as Distributed by MLS Grid
- 2026-04-19 Listed $320,000 NORTHSTARMLS as Distributed by MLS Grid
- 2022-12-29 Sold (Public Records) $310,000 Public Records
- 2022-12-15 Sold (MLS) $310,000 NORTHSTARMLS as Distributed by MLS Grid
- 2022-11-18 Pending — NORTHSTARMLS as Distributed by MLS Grid
- 2022-11-10 Price Changed $319,000 NORTHSTARMLS as Distributed by MLS Grid
- 2022-11-09 Price Changed $329,000 NORTHSTARMLS as Distributed by MLS Grid
- 2022-10-07 Listed $339,000 NORTHSTARMLS as Distributed by MLS Grid
- 2022-09-26 Coming Soon $339,000 NORTHSTARMLS as Distributed by MLS Grid
- 2011-07-26 Sold (MLS) $19,900 NORTHSTARMLS as Distributed by MLS Grid
- 2011-07-13 Listing Removed — NORTHSTARMLS as Distributed by MLS Grid
- 2011-07-07 Listed $19,900 NORTHSTARMLS as Distributed by MLS Grid
- 2011-06-07 Listing Removed — NORTHSTARMLS as Distributed by MLS Grid
- 2011-01-14 Listed $29,900 NORTHSTARMLS as Distributed by MLS Grid
- 2010-11-20 Listing Removed — NORTHSTARMLS as Distributed by MLS Grid
- 2010-11-12 Listed $35,000 NORTHSTARMLS as Distributed by MLS Grid
- 2010-10-30 Listing Removed — NORTHSTARMLS as Distributed by MLS Grid
- 2010-07-07 Listed $36,500 NORTHSTARMLS as Distributed by MLS Grid
- 2005-03-31 Listing Removed — NORTHSTARMLS as Distributed by MLS Grid
- 2005-03-01 Listed $209,900 NORTHSTARMLS as Distributed by MLS Grid
- 2003-03-05 Sold (Public Records) $170,000 Public Records
- 1997-05-28 Sold (Public Records) $65,000 Public Records
- 1992-09-15 Listing Removed — NORTHSTARMLS as Distributed by MLS Grid
- 1992-05-05 Listed $45,900 NORTHSTARMLS as Distributed by MLS Grid
Property tax history
+4.3%/yrLatest (2025): $3,587 · +26.5% YoY. Source: county tax records.
Cash-flow waterfall
monthlySold comps — $/sqft
last 12 mo · ≤1 miLoading sold comps…