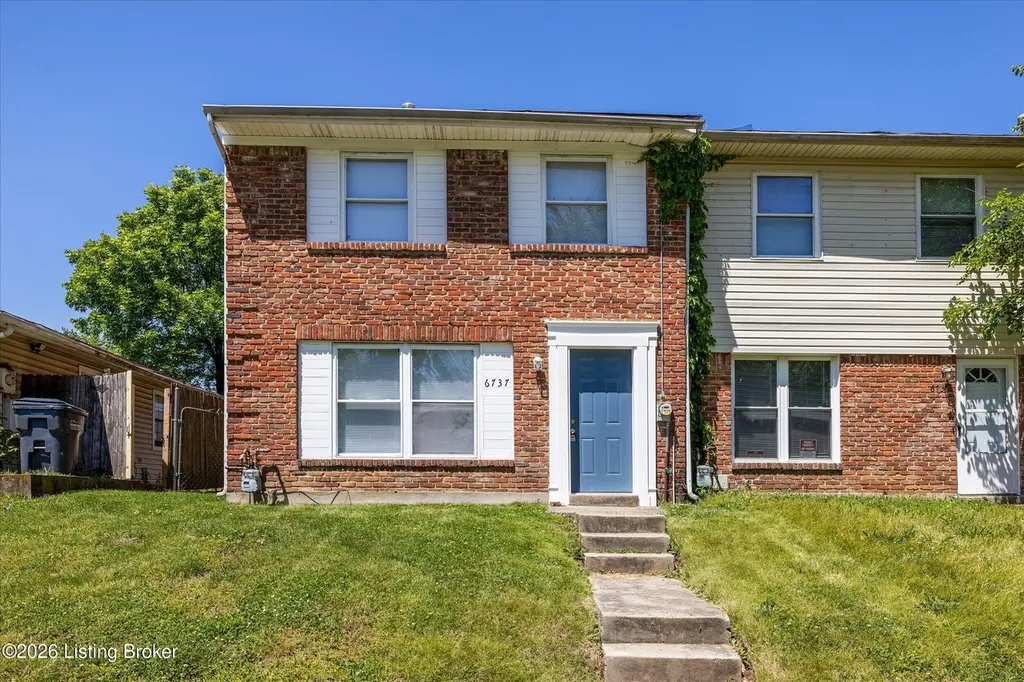
6737 Vandre Ave · Louisville/Jefferson County metro government (balance), KY
Flood risk 1/10 · Minimal
- FEMA flood zone
- X (unshaded)
- Chance of flooding over 30 yrs
- 0.0%
- Est. flood insurance / yr
- $507 – $1,088
Fire risk 1/10 · Minimal
- Est. fire insurance / yr
- $839 – $1,559
Heat risk 5/10 · Moderate
- Hot days now (above 104°F)
- 7 days/yr
- Hot days in 30 yrs
- 19 days/yr
Wind risk 2/10 · Minimal
- Chance of severe wind over 30 yrs
- 2.0%
Air-quality risk 3/10 · Minor
- Unhealthy air days now
- 2 days/yr
- Unhealthy air days in 30 yrs
- 3 days/yr
Risk factors via First Street. Map © Google.
Why this score? — see what drove the C grade
The composite is a weighted blend of 9 inputs, each scored 0–100. Each bar is that input's sub-score; the figure is the points it added to the 100-point composite (weight × sub-score).
- Cash flow +23.1/30.0
- ARV discount +13.8/15.0
- DSCR +7.4/10.0
- 1% rule +5.3/10.0
- Rent growth +2.5/5.0
- Livability +2.5/5.0
- Condition / age +2.5/5.0
- Schools +2.3/10.0
- Appreciation +0.0/10.0
$176,000
🖨 Deal sheet 📄 Offer letter ✓ Due diligence
Listing remarks
New HVAC and New water heater as of 2026. Discover the perfect blend of comfort and convenience in this beautifully updated fee-simple townhome. Located in a prime Louisville neighborhood with no HOA fees, this property offers the freedom and flexibility you've been looking for. Property Highlights: Open Concept Living: The spacious Living/Dining Room combo provides a seamless flow, perfect for modern daily living and hosting friends and family. Functional Kitchen: Equipped with abundant wood cabinetry, ample counter space, a dedicated pantry, and a gas stove for the home chef. Convenient Layout: The main level features a large powder room and laundry combo for maximum efficiency. Restful
Key facts
- Functional kitchen
- Open concept living
- Dedicated pantry
Tags
Property features AI
Finance
- Other: Property located in the Pleasant Valley subdivision; Lot dimensions approximately 25 x 112
- HOA & community: No association fee
Exterior
- Parking: Driveway parking
- Utilities: Electricity connected; Natural gas service
- Home design: Traditional residential property; 2 stories; Living area reported as 1,240 above-grade
- Construction: Built in 1973; Vinyl siding and brick exterior; Shingle roof; Poured concrete foundation
- Exterior features: Chain link fencing; Sidewalk; Cleared lot
Interior
- Kitchen: Kitchen on the first floor; Dining area adjacent to the kitchen
- Bedrooms: 3 bedrooms total; Primary bedroom on the second floor; All bedrooms located on the second floor
- Bathrooms: One full bathroom on the second floor; One half bathroom on the first floor
- Heating & cooling: Forced air heating (natural gas); Central air conditioning; One HVAC unit
- Interior features: 6 total rooms; 5 closets; No basement; Side-by-side dining area and kitchen on the first floor; Living room on the first floor
- Laundry & utility: Laundry room on the first floor; First-floor laundry
Neighborhood map
What this means for you Summary
Snapshot
- This is a 3-bed/1.5-bath townhouse listed at $176k.
Deal economics
- At list price, monthly cash flow is $315 ($4k/yr) — positive.
- The deal already cash-flows at list — no discount required.
- Meets the 1% rule at list price ($2k rent vs $176k).
- Recommended offer: $171k (3.0% below list) — sets the bar for market timing.
- Cap rate 8.4% vs local median 4.0% in Louisville/Jefferson County metro government (balance) — top-decile yield for the area; either an underpriced asset or a hidden risk that comps aren't pricing in. Stress-test before assuming the spread holds.
Location & tenants
- Location reads: area grade C — affects rentability + tenant quality, not the cash-flow math above.
- Jefferson County (urban): math 19% / reading 35% proficiency, ranked #121 of 165 in KY (top 73%) — low school quality limits family demand, transient renter base, plan for 1-2y turnover.
- Market conditions: 95 active listings in the ZIP; 7 comparable units currently listed for rent nearby; rentals leasing fast (median 3d on market — plan ~1-2 weeks tenant-placement turnaround); solid renter incomes; 2,836 units permitted in Jefferson County in 2024 (1,558 in 5+ unit buildings).
Forward outlook
- Local home prices are declining (-3.0%/yr); year-one equity from $1k of loan paydown is wiped out by about $5k of value loss. Plan a longer hold.
- Jefferson County population projected at +13% by 2050 — modest demand growth; plan on rents tracking national, not racing it.
Negotiation context
- It's been on market 32 days — a 3% lower offer ($171k) is reasonable based on typical stale-listing flexibility.
- 2 sale attempts with the ask held roughly flat each time — persistent listings suggest the price (not the market) is what's stuck; bring a comps-based counter.
- Current owner paid $64k; list at $176k implies a 175% gain — meaningful room to come down on a strong offer.
Risks & watch-outs
- Climate carrying-cost: extreme-heat days projected 7→19/yr by 2055 (HVAC capex compounding) — expect insurance premiums to compound above CPI over the hold.
Questions for the listing agent
- It's been on market 32 days. Have you received any prior offers? Is the seller open to a 3% concession, seller financing, or rate buy-down credit?
- Built in 1973 — when were the roof, HVAC, electrical panel, plumbing, and water heater last replaced?
- Is there a deadline driving the sale (1031 exchange, divorce, estate, relocation)? That informs how much negotiation room exists.
- What's the average days-on-market for RENTAL listings here right now (not sales)? A rising rental-DOM trend means longer vacancies and softer asking-rent achievability than the comps imply.
- What's the recent tenant-quality profile in this submarket — average credit score on applications, eviction rate, late-payment / NSF rate, and stable-employment percentage? A property-management company in the area should have these aggregated.
- How much new for-sale + rental construction is in the pipeline within 1–3 miles? Heavy new supply typically softens prices + rents 12–24 months out; constrained supply supports both.
Investment metrics
- 1% rule
- 1.03% ✓
- Cap rate
- 8.44%
- Cash-on-cash
- 7.68%
- DSCR
- 1.34
- GRM
- 8.1
CMA / ARV
- ARV (on-the-fly)
- $204,600
- Comps found
- 12
Show comp detail 12 sales within ~0.75 mi
| Address | Dist | Beds/Ba | Sqft | Sold | Price | $/sf | Match |
|---|---|---|---|---|---|---|---|
| 6604 Vandre Ave | 0.18mi | 3/1.5 | 1,244 (+0%) | 1mo | $150,000 | $121 | 90 |
| 6739 Vandre Ave | 0.00mi | 3/1.5 | 1,100 (-11%) | 3mo | $163,000 | $148 | 78 |
| 6903 Winnie Way | 0.44mi | 2/2.0 (-1) | 1,249 (+1%) | 4mo | $255,000 | $204 | 68 |
| 6910 Janes Farm Dr | 0.32mi | 2/2.0 (-1) | 1,159 (-6%) | 2mo | $239,900 | $207 | 65 |
| 8603 Mill Spring Pl | 0.38mi | 2/2.0 (-1) | 1,206 (-3%) | 12mo | $239,950 | $199 | 61 |
| 7308 Fox Hollow Way | 0.58mi | 2/2.0 (-1) | 1,204 (-3%) | 3mo | $188,000 | $156 | 59 |
| 7339 Fox Hollow Way | 0.62mi | 2/2.0 (-1) | 1,280 (+3%) | 3mo | $188,000 | $147 | 56 |
| 7333 Fox Hollow Way | 0.62mi | 2/2.0 (-1) | 1,286 (+4%) | 5mo | $212,500 | $165 | 54 |
| 7209 Briscoe Vista Way | 0.49mi | 2/2.0 (-1) | 1,139 (-8%) | 7mo | $199,900 | $176 | 51 |
| 8228 Delta Cir | 0.56mi | 2/2.0 (-1) | 1,171 (-6%) | 10mo | $240,000 | $205 | 50 |
| 7221 Correll Place Dr | 0.69mi | 2/2.0 (-1) | 1,225 (-1%) | 12mo | $200,000 | $163 | 48 |
| 7239 Correll Pl | 0.71mi | 2/2.0 (-1) | 1,371 (+11%) | 6mo | $167,500 | $122 | 37 |
Match score weights: distance 35% · size 25% · config 20% · recency 20%. Top-matched comps best support the ARV.
Projected returns pro-forma
-3.0% appreciation · 3.0% rent growth · sell at horizon
- IRR
- -4.6%
- Equity multiple
- 0.83×
- Total profit
- $-8,477
- Equity at exit
- $26,242
- IRR
- 5.1%
- Equity multiple
- 1.37×
- Total profit
- $18,335
- Equity at exit
- $15,217
Cash invested: $49,280 (down + closing). Projections, not guarantees.
Landlord ↔ Tenant lean methodology
- Overall (STATE)
- 83 Strongly Landlord-Friendly
- State Kentucky
- 83 Strongly Landlord-Friendly · R+16
- County
- — inherits STATE
- City
- — inherits STATE
ZIP-level market 40228
- Active inventory
- 95
- Price-to-rent
- 8.1×
Monthly cashflow live
- Estimated rent
- $1,814 high interval (Pro) →
- Mortgage (P&I)
- −$923
- Tax from tax record
- −$122 /mo · $1,461/yr
- Insurance
- −$73
- HOA
- −$0
- Vacancy / Maint / Mgmt
- −$381
- Net cashflow
- $315
Break-even live
UW: 25.0% down · 7.5% · 30yr · 1.5% tax · 5.0% vac · 8.0% maint · 8.0% mgmt
Financing live
Cash to close
- Down payment
- $44,000
- Closing costs
- $5,280
- Reserves months
- —
- Total cash needed
- —
Loan-product check · same deal, 3 products live
Conventional
25% down · 7.5% · 30yr
- Down + closing
- —
- Monthly P&I
- —
- Monthly cashflow
- —
- DSCR
- —
- Eligible?
- —
Personal DTI + credit; lowest rate.
DSCR
20% down · 8.5% · 30yr
- Down + closing
- —
- Monthly P&I
- —
- Monthly cashflow
- —
- DSCR
- —
- Eligible?
- —
No personal income docs; deal must DSCR.
Hard money
10% down · 12.0% · 12mo
- Down + closing
- —
- Monthly P&I
- —
- Monthly cashflow
- —
- DSCR
- —
- Eligible?
- —
Short-term bridge; refi at stabilization.
Rent comps 7 comps
| Address | Beds | Baths | Sqft | Rent | $/sqft | DOM | Units | Dist |
|---|---|---|---|---|---|---|---|---|
| 6600 Outer Loop Louisville, KY | 1.0–3.0 | 1.0–1.5 | 872 | $1,509 | $1.73 | 3d | 1 | 0.04mi |
| 6600 Outer Loop Unit 66 Louisville, KY | 3.0 | 1.5 | 1080 | $1,389 | $1.29 | 23d | 1 | 0.12mi |
| 6605 Vandre Ave Louisville, KY | 3.0 | 2.0 | 1100 | $1,775 | $1.61 | 23d | 1 | 0.15mi |
| 7400 Snow Bend Ave Louisville, KY | 1.0–3.0 | 1.0–2.0 | 1074 | $1,846 | $1.72 | 1d | 11 | 0.75mi |
| 7220 Harborton Way Louisville, KY | 3.0 | 1.0 | 1000 | $1,550 | $1.55 | 23d | 1 | 0.82mi |
| 7715 Oakfields Pointe Rd Louisville, KY | 1.0–2.0 | 1.0–2.0 | 1073 | $1,469 | $1.37 | 2d | 11 | 0.91mi |
| 8825 Anatolia Ct Louisville, KY | 1.0–3.0 | 1.0–2.0 | 1071 | $2,059 | $1.92 | 3d | 18 | 1.17mi |
Listing history 17 events
-
2026-06-18days on market $176,000 Active 32 DOM
-
2026-06-17days on market $176,000 Active 31 DOM
-
2026-06-16days on market $176,000 Active 30 DOM
-
2026-06-15days on market $176,000 Active 29 DOM
-
2026-06-13days on market $176,000 Active 27 DOM
-
2026-06-10days on market $176,000 Active 24 DOM
-
2026-06-09days on market $176,000 Active 23 DOM
-
2026-06-08days on market $176,000 Active 22 DOM
-
2026-06-07days on market $176,000 Active 21 DOM
-
2026-06-03days on market $176,000 Active 17 DOM
-
2026-06-02days on market $176,000 Active 16 DOM
-
2026-06-01days on market $176,000 Active 15 DOM
-
2026-05-31pricedays on market $176,000 Active 14 DOM
-
2026-05-24status Active
-
2026-05-16status Pending
-
2026-05-08$179,000 Active
-
2004-07-01soldstatus $64,000
ⓘ Source: listings_history table (triggers on properties + properties_extension) + one-shot
backfill from property_details.listing_events for pre-trigger history.
Tax reassessment forecast KY · Resets to sale price
- Current annual tax
- $1,461 · $122/mo
- Projected year-2 tax
- $1,514 · $126/mo
- Expected delta
- +$53/yr (+$4/mo · 3.6%)
ⓘ Screening estimate from a state-policy table — verify with the county assessor before closing.
Climate risk First Street
- Flood 1/10 Low FEMA zone X (unshaded) · 0% chance over 30 yrs
- Wildfire 1/10 Low
- Heat 5/10 Major 7 d/yr ≥104°F today · 19 d/yr by 30 yrs out
- Wind 2/10 Low 2% chance of damaging wind over 30 yrs
- Air quality 3/10 Moderate 2 unhealthy d/yr today · 3 by 30 yrs out
Nearby sold comps map
Loading sold comps map…
Walkable amenities ~0.75 mi
Loading nearby amenities…
Taxation est. · year 1
- Rental income
- $21,771
- − Mortgage interest
- −$9,859
- − Property taxes
- −$1,461
- − Insurance
- −$880
- − Repairs & maintenance
- −$1,742
- − Management
- −$1,742
- − Depreciation
- −$5,120
- Taxable income
- $968
- Est. tax owed @ 24.0%
- −$232
- After-tax cash flow
- $3,550/yr
For passive investors: Depreciation is non-cash, so a rental often shows a tax loss while cash-flowing — sheltering income. Rental losses are passive: they offset passive income freely, and up to $25,000/yr can offset ordinary (W-2) income if you actively participate and your MAGI is under $100k (phasing out to $0 by $150k); unused losses carry forward. On sale, claimed depreciation is recaptured at up to 25%, and gains may owe capital-gains tax (a 1031 exchange can defer both). Figures are a year-1 estimate at your 24.0% rate — not tax advice; consult a CPA.
Schools (NCES district)
- District
- Jefferson County
- NCES district ID
- 2102990
- Math proficiency
- 19% ▼ -17.00%
- Reading proficiency
- 35% ▼ -11.00%
- Median HH income
- $47,885
- Composite
- 23.45/100
- National rank
- #7884
- State rank
- #121 of 165 in KY
Livability — Louisville/Jefferson County metro government (balance)
No livability data for this city. (Only ~50 U.S. cities are tracked.)
Census & demographics
- Census place
- Louisville/Jefferson County metro government (balance), KY
- County
- Jefferson County · 790,184 people
- City population
- 419,741
- Metro
- Louisville/Jefferson County, KY-IN
- Population (ZIP)
- 18,085
- Household income
- $79,404
- Rent vs Own
- Severe rent burden
- 95.0
Population outlook (Jefferson County) Hauer SSP2
- Today (2025)
- 823,112 people
- By 2030
- 849,343 · +3.2%
- By 2040
- 895,696 · +8.8%
- By 2050
- 933,630 · +13.4%
- By 2075
- 1,028,262 · +24.9%
- By 2100
- 1,072,675 · +30.3%
Race, ethnicity, and origin ACS 2023
- Neighborhood character
- Majority White (65%)
- Race & ethnicity
- White 65% Black 16% Two or more races 14% Hispanic / Latino 11% Asian 1%
- Hispanic origin (detail)
- Mexican 1% Cuban 7%
- Common ancestry
- Italian 2% Lithuanian 2% Swiss 1%
- Foreign-born
- 14% · Canada
- Languages at home
- 84% English-only · Spanish 9% Arabic 1% Other Asian/Pacific 1%
Political lean MEDSL · Jefferson
- 2024 margin
- D (+16.6) · D 57.4% · R 40.9% · Other 1.7%
- 2008→2024 swing
- +4.5pp toward D · 2008: 12.0pp · 2024: 16.6pp
- All cycles
- 2024: D+16.6 2020: D+20.1 2016: D+13.3 2012: D+11.1 2008: D+12.0
Not yet ingested
- Civics
- —
Market trends
- HPI YoY
- ▼ -215.41%
- Current HPI
- 238.4061
- Rent YoY
- —
- Metro
- Louisville/Jefferson County, KY-IN
- State GDP YoY
- ▲ 1.81%
- F500 in state
- 4
Industry mix (Fortune 500 HQ in KY)
| Industry | F500 HQs | Revenue |
|---|---|---|
| Healthcare | 1 | $118B |
|
||
| Food / Beverage | 1 | $7B |
|
||
Price history
+179.7% since first listed4 events — show timeline
- 2026-05-24 Relisted — Metro Search MLS
- 2026-05-16 Pending — Metro Search MLS
- 2026-05-08 Listed $179,000 Metro Search MLS
- 2004-07-01 Sold (Public Records) $64,000 Public Records
Property tax history
+6.6%/yrLatest (2025): $1,461 · +51.7% YoY. Source: county tax records.
Cash-flow waterfall
monthlySold comps — $/sqft
last 12 mo · ≤1 miLoading sold comps…