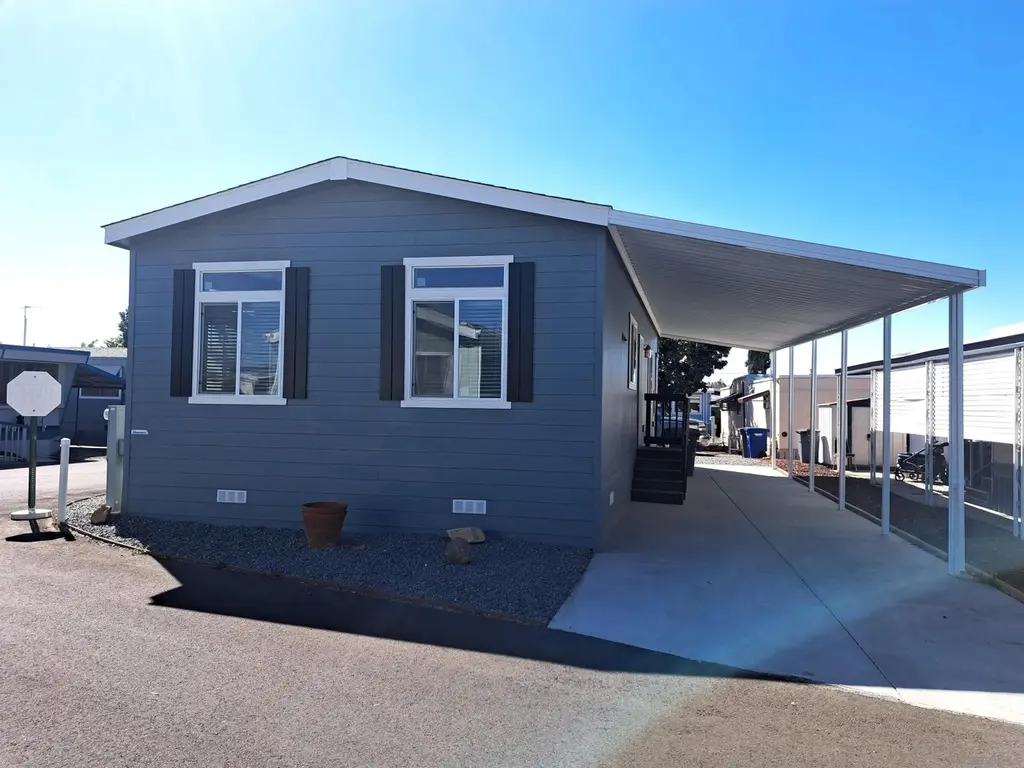
410 S First St #94 · El Cajon, CA
Flood risk 6/10 · Moderate
- FEMA flood zone
- X (shaded)
- Chance of flooding over 30 yrs
- 0.69%
- Est. flood insurance / yr
- $507 – $1,088
Fire risk 1/10 · Minimal
- Est. fire insurance / yr
- $659 – $1,223
Heat risk 5/10 · Moderate
- Hot days now (above 99°F)
- 6 days/yr
- Hot days in 30 yrs
- 17 days/yr
Wind risk 1/10 · Minimal
- Chance of severe wind over 30 yrs
- —
Air-quality risk 4/10 · Minor
- Unhealthy air days now
- 6 days/yr
- Unhealthy air days in 30 yrs
- 7 days/yr
Risk factors via First Street. Map © Google.
Why this score? — see what drove the C+ grade
The composite is a weighted blend of 9 inputs, each scored 0–100. Each bar is that input's sub-score; the figure is the points it added to the 100-point composite (weight × sub-score).
- Cash flow +30.0/30.0
- 1% rule +10.0/10.0
- DSCR +10.0/10.0
- Schools +4.0/10.0
- Condition / age +4.0/5.0
- Livability +3.5/5.0
- Rent growth +1.8/5.0
- ARV discount +0.0/15.0
- Appreciation +0.0/10.0
$149,900
🖨 Deal sheet 📄 Offer letter ✓ Due diligence
Listing remarks
Brand new Silvercrest manufactured home on corner lot, in affordable senior living community with a very reasonable monthly fee of $1,100. Home comes with a 7 year factory warranty. Ceilings are 9 foot high flat with tape and textured drywall throughout. Heavy duty vinyl plank flooring except for in the bed rooms and bed room closets. Also comes equipped with wood cabinets and corian counter tops with center island.
Key facts
- 9 foot high ceilings
- Corian counter tops
- Corner lot
Tags
Property features AI
Finance
- HOA & community: Located in a senior community; El Cajon Valley MHP community
Exterior
- Parking: 2 parking spaces
- Utilities: Public water; Public sewer / sewer connected
- Home design: Manufactured home; Single-story
- Construction: Composition / shingle roof
- Exterior features: Community pool
Interior
- Kitchen: Gas oven; Gas range / Gas cooktop; Range; Oven
- Bedrooms: 2 possible bedrooms
- Bathrooms: 2 full bathrooms
- Heating & cooling: Forced air heating; Natural gas heating
- Interior features: Dishwasher; Disposal; Microwave; Refrigerator; Ice maker; Exhaust fan; Gas water heater
- Laundry & utility: Washer hookup
Neighborhood map
What this means for you Summary
Snapshot
- This is a 2-bed/2.0-bath manufactured listed at $150k. Condition is rated good.
Deal economics
- At list price, monthly cash flow is $791 ($9k/yr) — positive.
- The deal already cash-flows at list — no discount required.
- Meets the 1% rule at list price ($2k rent vs $150k).
- Recommended offer: $145k (3.0% below list) — sets the bar for market timing.
- Cap rate 12.6% vs local median 2.4% in El Cajon — top-decile yield for the area; either an underpriced asset or a hidden risk that comps aren't pricing in. Stress-test before assuming the spread holds.
Location & tenants
- Location reads 70/100 on livability (#230 in CA) — a middle-class / working-renter tenant base. Strengths: amenities A+, commute A+; Watch: health & safety C-, crime D+, cost of living F.
- Grossmont Union High (suburban): math 31% / reading 60% proficiency, ranked #173 of 517 in CA (top 34%) — families likely to look elsewhere, expect single-tenant / working-renter base with shorter leases; only 17% free/reduced lunch — higher-income household profile.
- Market conditions: Rents soft (-2.6%/yr); 137 active listings in the ZIP; 40 comparable units currently listed for rent nearby; rentals leasing fast (median 2d on market — plan ~1-2 weeks tenant-placement turnaround); solid renter incomes; 11,759 units permitted in San Diego County in 2024 (7,244 in 5+ unit buildings).
Forward outlook
- Local home prices are declining (-3.0%/yr); year-one equity from $1k of loan paydown is wiped out by about $4k of value loss. Plan a longer hold.
- San Diego County population projected at +20% by 2050 — long-run rental-demand tailwind backs the buy-and-hold thesis.
- At projected returns (-3.0% appreciation + 0.0% rent growth), your $42k cash investment doubles in ~7 years — after that, you're playing with house money.
Negotiation context
- It's been on market 57 days — a 3% lower offer ($145k) is reasonable based on typical stale-listing flexibility.
- 8 sale attempts since 2y ago with the ask held roughly flat each time — persistent listings suggest the price (not the market) is what's stuck; bring a comps-based counter.
Risks & watch-outs
- Climate carrying-cost: major flood risk; extreme-heat days projected 6→17/yr by 2055 (HVAC capex compounding) — expect insurance premiums to compound above CPI over the hold.
Questions for the listing agent
- It's been on market 57 days. Have you received any prior offers? Is the seller open to a 3% concession, seller financing, or rate buy-down credit?
- Is there a deadline driving the sale (1031 exchange, divorce, estate, relocation)? That informs how much negotiation room exists.
- Crime grade is D in this area — have there been break-ins, vandalism, or insurance claims at this property in the last 3 years? What carrier currently insures it and at what premium?
- What's the average days-on-market for RENTAL listings here right now (not sales)? A rising rental-DOM trend means longer vacancies and softer asking-rent achievability than the comps imply.
- What's the recent tenant-quality profile in this submarket — average credit score on applications, eviction rate, late-payment / NSF rate, and stable-employment percentage? A property-management company in the area should have these aggregated.
- How much new for-sale + rental construction is in the pipeline within 1–3 miles? Heavy new supply typically softens prices + rents 12–24 months out; constrained supply supports both.
Investment metrics
- 1% rule
- 1.54% ✓
- Cap rate
- 12.62%
- Cash-on-cash
- 22.61%
- DSCR
- 2.01
- GRM
- 5.4
CMA / ARV
- ARV (on-the-fly)
- $120,000
- Comps found
- 9
Show comp detail 9 sales within ~0.75 mi
| Address | Dist | Beds/Ba | Sqft | Sold | Price | $/sf | Match |
|---|---|---|---|---|---|---|---|
| 410 S 1st St #30 | 0.09mi | 2/1.0 | 784 (-2%) | 4mo | $85,000 | $108 | 85 |
| 410 S 1st St #126 | 0.09mi | 2/1.0 | 800 (0%) | 15mo | $107,500 | $134 | 80 |
| 410 S 1st St Spc 145 | 0.08mi | 2/1.5 | 742 (-7%) | 5mo | $85,575 | $115 | 78 |
| 187 Ballard St #15 | 0.48mi | 2/2.0 | 800 (0%) | 1mo | $120,000 | $150 | 76 |
| 410 S 1st | 0.03mi | 2/2.0 | 880 (+10%) | 11mo | $175,000 | $199 | 73 |
| 1174 E Main St Spc 92 | 0.58mi | 2/2.0 | 800 (0%) | 10mo | $139,000 | $174 | 64 |
| 1174 E Main St #62 | 0.57mi | 2/2.0 | 691 (-14%) | 2mo | $175,000 | $253 | 49 |
| 1285 E Washington Ave #94 | 0.73mi | 1/2.0 (-1) | 832 (+4%) | 9mo | $89,500 | $108 | 47 |
| 998 E Main St Spc 68 | 0.49mi | 2/1.0 | 900 (+12%) | 13mo | $175,000 | $194 | 41 |
Match score weights: distance 35% · size 25% · config 20% · recency 20%. Top-matched comps best support the ARV.
Projected returns pro-forma
-3.0% appreciation · 0.0% rent growth · sell at horizon
- IRR
- 12.0%
- Equity multiple
- 1.46×
- Total profit
- $19,338
- Equity at exit
- $22,351
- IRR
- 18.5%
- Equity multiple
- 2.33×
- Total profit
- $55,652
- Equity at exit
- $12,961
Cash invested: $41,972 (down + closing). Projections, not guarantees.
Landlord ↔ Tenant lean methodology
- Overall (STATE)
- 18 Strongly Tenant-Friendly
- State California
- 18 Strongly Tenant-Friendly · D+13
- County
- — inherits STATE
- City
- — inherits STATE
ZIP-level market 92019
- Rents YoY
- -2.6%
- Active inventory
- 137
- Price-to-rent
- 5.4×
Monthly cashflow live
- Estimated rent
- $2,312 high interval (Pro) →
- Mortgage (P&I)
- −$786
- Tax est. 1.5%
- −$187 /mo · $2,248/yr
- Insurance
- −$62
- HOA
- −$0
- Vacancy / Maint / Mgmt
- −$486
- Net cashflow
- $791
Break-even live
UW: 25.0% down · 7.5% · 30yr · 1.5% tax · 5.0% vac · 8.0% maint · 8.0% mgmt
Financing live
Cash to close
- Down payment
- $37,475
- Closing costs
- $4,497
- Reserves months
- —
- Total cash needed
- —
Loan-product check · same deal, 3 products live
Conventional
25% down · 7.5% · 30yr
- Down + closing
- —
- Monthly P&I
- —
- Monthly cashflow
- —
- DSCR
- —
- Eligible?
- —
Personal DTI + credit; lowest rate.
DSCR
20% down · 8.5% · 30yr
- Down + closing
- —
- Monthly P&I
- —
- Monthly cashflow
- —
- DSCR
- —
- Eligible?
- —
No personal income docs; deal must DSCR.
Hard money
10% down · 12.0% · 12mo
- Down + closing
- —
- Monthly P&I
- —
- Monthly cashflow
- —
- DSCR
- —
- Eligible?
- —
Short-term bridge; refi at stabilization.
Rent comps 40 comps
| Address | Beds | Baths | Sqft | Rent | $/sqft | DOM | Units | Dist |
|---|---|---|---|---|---|---|---|---|
| 588 S Anza St El Cajon, CA | 1.0–2.0 | 1.0 | 767 | $2,100 | $2.74 | 1d | 6 | 0.11mi |
| 1041-89 E Lexington Ave El Cajon, CA | 1.0–2.0 | 1.0–2.0 | 838 | $2,425 | $2.89 | 1d | 8 | 0.16mi |
| 1037 E Lexington Ave El Cajon, CA | 1.0–3.0 | 1.0–2.0 | 855 | $2,225 | $2.60 | 1d | 5 | 0.19mi |
| 1065 E Washington Ave El Cajon, CA | 3.0 | 2.0 | 1100 | $2,850 | $2.59 | 1d | 1 | 0.20mi |
| 1065 E Washington Ave Apt N El Cajon, CA | 3.0 | 2.0 | 1100 | $2,850 | $2.59 | 17d | 1 | 0.20mi |
| 1018 E Lexington Ave El Cajon, CA | 1.0 | 1.0 | 670 | $1,800 | $2.69 | 1d | 1 | 0.21mi |
| 975 E Washington Ave Apt E El Cajon, CA | 2.0 | 1.0 | 900 | $2,100 | $2.33 | 22d | 1 | 0.22mi |
| 265 S Anza St El Cajon, CA | 2.0 | 1.0 | 775 | $2,250 | $2.90 | 2d | 1 | 0.22mi |
| 421 S Mollison Ave El Cajon, CA | 1.0–2.0 | 1.0 | 726 | $1,900 | $2.62 | 1d | 2 | 0.23mi |
| 957 E Washington Ave El Cajon, CA | 2.0 | 2.0 | 900 | $2,295 | $2.55 | 1d | 1 | 0.24mi |
| 602 S Mollison Ave Unit C El Cajon, CA | 2.0 | 2.0 | 1024 | $2,600 | $2.54 | 1d | 1 | 0.25mi |
| 390 S Mollison Ave El Cajon, CA | 1.0 | 1.0 | 750 | $1,725 | $2.30 | 1d | 1 | 0.29mi |
| 1137 E Lexington Ave El Cajon, CA | 2.0 | 1.0 | 900 | $1,995 | $2.22 | 1d | 1 | 0.29mi |
| 279 S Mollison Ave El Cajon, CA | 1.0 | 1.0 | 570 | $1,950 | $3.42 | 1d | 1 | 0.30mi |
| 725 Washington Heights Rd El Cajon, CA | 2.0 | 1.0 | 800 | $2,238 | $2.80 | 1d | 4 | 0.35mi |
| 447 S Lincoln Ave El Cajon, CA | 2.0 | 1.5 | 928 | $2,300 | $2.48 | 1d | 1 | 0.35mi |
| 800 E Lexington Ave El Cajon, CA | 2.0–3.0 | 2.0 | 1040 | $2,390 | $2.30 | 1d | 5 | 0.36mi |
| 200 S Mollison Ave El Cajon, CA | 2.0 | 1.0 | 950 | $1,995 | $2.10 | 1d | 1 | 0.36mi |
| 758 S Mollison Ave El Cajon, CA | 2.0 | 1.0 | 875 | $1,945 | $2.22 | 1d | 3 | 0.37mi |
| 351 S Lincoln Ave El Cajon, CA | 2.0 | 2.0 | 900 | $2,395 | $2.66 | 1d | 1 | 0.39mi |
| 685 S Lincoln Ave El Cajon, CA | 2.0 | 2.0 | 800 | $2,300 | $2.88 | 1d | 1 | 0.41mi |
| 444 S Lincoln Ave El Cajon, CA | 2.0 | 1.0 | 748 | $2,000 | $2.67 | 24d | 1 | 0.41mi |
| 570 S Lincoln Ave El Cajon, CA | 1.0–2.0 | 1.0 | 745 | $2,475 | $3.32 | 3d | 2 | 0.43mi |
| 180 N 1st St El Cajon, CA | 1.0–2.0 | 1.0–2.0 | 830 | $2,125 | $2.56 | 1d | 3 | 0.44mi |
| 187 Ballard St El Cajon, CA | 1.0–2.0 | 1.0–2.0 | 542 | $2,150 | $3.97 | 1d | 2 | 0.47mi |
| 620 E Lexington Ave #3 El Cajon, CA | 2.0 | 2.0 | 1000 | $2,900 | $2.90 | 2d | 1 | 0.50mi |
| 233 N Mollison Ave El Cajon, CA | 1.0–2.0 | 1.0–2.0 | 843 | $2,202 | $2.61 | 1d | 10 | 0.50mi |
| 277 N 1st St El Cajon, CA | 2.0 | 2.0 | 825 | $2,130 | $2.58 | 1d | 1 | 0.54mi |
| 304 N 1st St El Cajon, CA | 2.0 | 1.0 | 769 | $2,300 | $2.99 | 1d | 1 | 0.55mi |
| 244 N Mollison Ave El Cajon, CA | 2.0 | 1.0 | 858 | $2,110 | $2.46 | 1d | 2 | 0.55mi |
| 340 N 1st St El Cajon, CA | 2.0 | 1.0 | 751 | $1,980 | $2.64 | 1d | 3 | 0.57mi |
| 595 S 2nd St El Cajon, CA | 2.0 | 1.0 | 800 | $2,290 | $2.86 | 1d | 1 | 0.58mi |
| 280 N Mollison Ave El Cajon, CA | 1.0–2.0 | 1.0 | 825 | $2,195 | $2.66 | 1d | 1 | 0.59mi |
| 360 N 1st St El Cajon, CA | 2.0 | 2.0 | 725 | $1,995 | $2.75 | 16d | 1 | 0.60mi |
| 200 Taft Ave El Cajon, CA | 2.0 | 2.0 | 700 | $2,175 | $3.11 | 1d | 6 | 0.63mi |
| 148 Taft Ave Unit 7 El Cajon, CA | 2.0 | 1.0 | 875 | $1,895 | $2.17 | 1d | 1 | 0.64mi |
| 960 E Chase Ave Unit C El Cajon, CA | 2.0 | 2.0 | 813 | $2,100 | $2.58 | 1d | 1 | 0.65mi |
| 870 E Chase Ave Unit D El Cajon, CA | 2.0 | 1.0 | 795 | $2,440 | $3.07 | 1d | 1 | 0.68mi |
| 432 Dominguez Way Unit 13 El Cajon, CA | 2.0 | 1.5 | 952 | $2,195 | $2.31 | 20d | 1 | 0.68mi |
| 280 Roanoke Rd El Cajon, CA | 2.0 | 2.0 | 1024 | $2,395 | $2.34 | 1d | 1 | 0.70mi |
Listing history 41 events
-
2026-06-18days on market $149,900 Active 57 DOM
-
2026-06-17days on market $149,900 Active 56 DOM
-
2026-06-16days on market $149,900 Active 55 DOM
-
2026-06-15days on market $149,900 Active 54 DOM
-
2026-06-13days on market $149,900 Active 52 DOM
-
2026-06-13days on market $149,900 Active 51 DOM
-
2026-06-09days on market $149,900 Active 48 DOM
-
2026-06-08days on market $149,900 Active 47 DOM
-
2026-06-07days on market $149,900 Active 46 DOM
-
2026-06-04days on market $149,900 Active 43 DOM
-
2026-06-03days on market $149,900 Active 42 DOM
-
2026-06-02days on market $149,900 Active 41 DOM
-
2026-06-01days on market $149,900 Active 40 DOM
-
2026-05-31pricedays on market $149,900 Active 39 DOM
-
2026-04-22$154,900 Active
-
2026-04-17historical
-
2026-04-07price $159,900
-
2026-03-01price $169,900
-
2026-01-16$175,000 Active
-
2026-01-12historical
-
2025-11-08price $175,900
-
2025-10-11$175,000 Active
-
2025-09-09historical
-
2025-08-12price $175,000
-
2025-07-08$199,000 Active
-
2025-07-04historical
-
2025-06-29price $175,000
-
2025-05-03$195,000 Active
-
2025-05-03historical
-
2025-04-28status Active
-
2025-04-25historical
-
2025-04-16price $195,000
-
2025-04-04price $199,000
-
2025-03-20price $215,000
-
2025-02-24$225,000 Active
-
2025-02-20historical
-
2025-01-30price $249,000
-
2024-11-18price $269,000
-
2024-11-08price $289,000
-
2024-09-16$299,000 Active
-
2024-09-16historical
ⓘ Source: listings_history table (triggers on properties + properties_extension) + one-shot
backfill from property_details.listing_events for pre-trigger history.
Climate risk First Street
- Flood 6/10 Major FEMA zone X (shaded) · 69% chance over 30 yrs
- Wildfire 1/10 Low
- Heat 5/10 Major 6 d/yr ≥99°F today · 17 d/yr by 30 yrs out
- Wind 1/10 Low
- Air quality 4/10 Moderate 6 unhealthy d/yr today · 7 by 30 yrs out
Nearby sold comps map
Loading sold comps map…
Walkable amenities ~0.75 mi
Loading nearby amenities…
Taxation est. · year 1
- Rental income
- $27,749
- − Mortgage interest
- −$8,397
- − Property taxes
- −$2,248
- − Insurance
- −$750
- − Repairs & maintenance
- −$2,220
- − Management
- −$2,220
- − Depreciation
- −$4,361
- Taxable income
- $7,553
- Est. tax owed @ 24.0%
- −$1,813
- After-tax cash flow
- $7,678/yr
For passive investors: Depreciation is non-cash, so a rental often shows a tax loss while cash-flowing — sheltering income. Rental losses are passive: they offset passive income freely, and up to $25,000/yr can offset ordinary (W-2) income if you actively participate and your MAGI is under $100k (phasing out to $0 by $150k); unused losses carry forward. On sale, claimed depreciation is recaptured at up to 25%, and gains may owe capital-gains tax (a 1031 exchange can defer both). Figures are a year-1 estimate at your 24.0% rate — not tax advice; consult a CPA.
Condition & rehab AI · 12 photos
This brand new Silvercrest manufactured home is in excellent condition with modern finishes and a well-maintained exterior. It offers a good return on investment with minimal maintenance required.
Value-add opportunities
- Both Painting the exterior and interior walls — Fresh paint can enhance curb appeal and interior aesthetics.
- Both Landscaping improvements — A well-maintained yard can increase both resale and rental value.
- Both Adding smart home features — Smart home features can increase both resale and rental value by making the home more modern and convenient.
Renovation cost estimate screening
Value-add ROI direction
- Both Painting the exterior and interior walls — Fresh paint can enhance curb appeal and interior aesthetics. ↑
- Both Landscaping improvements — A well-maintained yard can increase both resale and rental value. ↑
- Both Adding smart home features — Smart home features can increase both resale and rental value by making the home more modern and convenient. ↑
ⓘ Cost ranges are severity-bucket heuristics (US national rule-of-thumb). Get contractor quotes + a written scope before underwriting a rehab budget.
Schools (NCES district)
- District
- Grossmont Union High
- NCES district ID
- 0616230
- Math proficiency
- 31% ▼ -1.00%
- Reading proficiency
- 60% ▲ 5.00%
- Median HH income
- $61,801
- Composite
- 40.07/100
- National rank
- #3810
- State rank
- #173 of 517 in CA
Livability — El Cajon
- Score
- 70/100
- State rank
- #230
- US rank
- #7531
Category grades
Schools grade is shown separately in the Schools card above.
Census & demographics
- Census place
- El Cajon, CA
- County
- San Diego County · 3,178,799 people
- City population
- 173,694
- Metro
- San Diego-Chula Vista-Carlsbad, CA
- Population (ZIP)
- 45,351
- Household income
- $101,973
- Rent vs Own
- Severe rent burden
- 1897.0
Population outlook (San Diego County) Hauer SSP2
- Today (2025)
- 3,678,185 people
- By 2030
- 3,856,546 · +4.8%
- By 2040
- 4,171,407 · +13.4%
- By 2050
- 4,421,607 · +20.2%
- By 2075
- 4,831,599 · +31.4%
- By 2100
- 4,832,502 · +31.4%
Race, ethnicity, and origin ACS 2023
- Neighborhood character
- Predominantly White (67%)
- Race & ethnicity
- White 67% Hispanic / Latino 21% Two or more races 15% Asian 3% Black 2%
- Hispanic origin (detail)
- Mexican 19%
- Common ancestry
- Arab 6% Romanian 2% Lithuanian 2%
- Foreign-born
- 22% · Canada, China
- Languages at home
- 69% English-only · Spanish 11% Arabic 10% Other Indo-European 1%
Political lean MEDSL · San Diego
- 2024 margin
- D (+16.8) · D 56.9% · R 40.1% · Other 2.9%
- 2008→2024 swing
- +6.6pp toward D · 2008: 10.2pp · 2024: 16.8pp
- All cycles
- 2024: D+16.8 2020: D+22.8 2016: D+17.8 2012: D+5.1 2008: D+10.2
Not yet ingested
- Civics
- —
Market trends
- HPI YoY
- ▼ -553.81%
- Current HPI
- 349.3085
- Rent YoY
- ▼ -2.61%
- Metro
- San Diego-Chula Vista-Carlsbad, CA
- State GDP YoY
- ▲ 3.21%
- F500 in state
- 116
Industry mix (Fortune 500 HQ in CA)
| Industry | F500 HQs | Revenue |
|---|---|---|
| Technology | 27 | $1,492B |
|
||
| Financial Services | 3 | $174B |
|
||
| Retail | 3 | $44B |
|
||
| Insurance | 3 | $26B |
|
||
| Media / Entertainment | 2 | $115B |
|
||
| Pharmaceuticals / Biotech | 2 | $62B |
|
||
Price history
-48.2% since first listed27 events — show timeline
- 2026-04-22 Listed $154,900 SDMLS
- 2026-04-17 Listing Removed — SDMLS
- 2026-04-07 Price Changed $159,900 SDMLS
- 2026-03-01 Price Changed $169,900 SDMLS
- 2026-01-16 Listed $175,000 SDMLS
- 2026-01-12 Listing Removed — SDMLS
- 2025-11-08 Price Changed $175,900 SDMLS
- 2025-10-11 Listed $175,000 SDMLS
- 2025-09-09 Listing Removed — SDMLS
- 2025-08-12 Price Changed $175,000 SDMLS
- 2025-07-08 Listed $199,000 SDMLS
- 2025-07-04 Listing Removed — SDMLS
- 2025-06-29 Price Changed $175,000 SDMLS
- 2025-05-03 Listing Removed — SDMLS
- 2025-05-03 Listed $195,000 SDMLS
- 2025-04-28 Relisted — SDMLS
- 2025-04-25 Listing Removed — SDMLS
- 2025-04-16 Price Changed $195,000 SDMLS
- 2025-04-04 Price Changed $199,000 SDMLS
- 2025-03-20 Price Changed $215,000 SDMLS
- 2025-02-24 Listed $225,000 SDMLS
- 2025-02-20 Listing Removed — CRMLS
- 2025-01-30 Price Changed $249,000 CRMLS
- 2024-11-18 Price Changed $269,000 CRMLS
- 2024-11-08 Price Changed $289,000 CRMLS
- 2024-09-16 Listed $299,000 CRMLS
- 2024-09-16 Coming Soon — CRMLS
Cash-flow waterfall
monthlySold comps — $/sqft
last 12 mo · ≤1 miLoading sold comps…