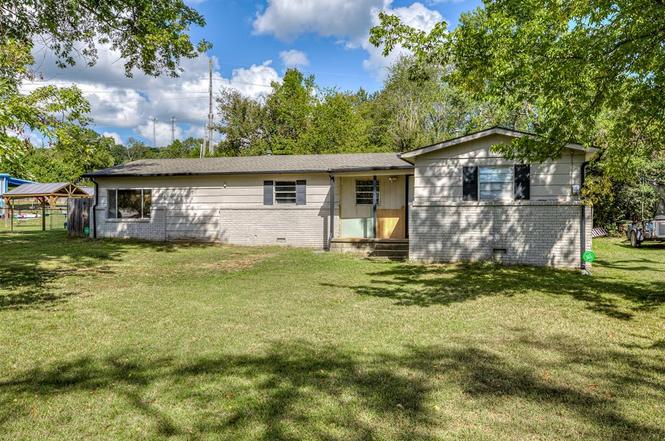
1025 W Fox St · Tahlequah, OK
Flood risk 1/10 · Minimal
- FEMA flood zone
- X (unshaded)
- Chance of flooding over 30 yrs
- 0.0%
- Est. flood insurance / yr
- $507 – $1,088
Fire risk 8/10 · Major
- Est. fire insurance / yr
- $2,463 – $4,575
Heat risk 6/10 · Moderate
- Hot days now (above 110°F)
- 7 days/yr
- Hot days in 30 yrs
- 19 days/yr
Wind risk 2/10 · Minimal
- Chance of severe wind over 30 yrs
- 4.0%
Air-quality risk 2/10 · Minimal
- Unhealthy air days now
- 1 days/yr
- Unhealthy air days in 30 yrs
- 2 days/yr
Risk factors via First Street. Map © Google.
Why this score? — see what drove the B grade
The composite is a weighted blend of 9 inputs, each scored 0–100. Each bar is that input's sub-score; the figure is the points it added to the 100-point composite (weight × sub-score).
- Cash flow +27.6/30.0
- ARV discount +15.0/15.0
- DSCR +9.7/10.0
- 1% rule +6.7/10.0
- Rent growth +4.8/5.0
- Livability +3.3/5.0
- Condition / age +2.5/5.0
- Schools +2.1/10.0
- Appreciation +0.0/10.0
$115,000
🖨 Deal sheet 📄 Offer letter ✓ Due diligence
Listing remarks MLS
1025 W. FOX STREET. .. A WONDERFUL PLACE TO BE! NICE 3 BEDROOM, 2 BATH HOUSE IN A GREAT LOCATION.
Key facts
- Access to nature
- Garage converted
- Investment property
Tags
Neighborhood map
What this means for you Summary
Snapshot
- This is a 3-bed/2.0-bath single-family listed at $115k.
Deal economics
- At list price, monthly cash flow is $342 ($4k/yr) — positive.
- The deal already cash-flows at list — no discount required.
- Meets the 1% rule at list price ($1k rent vs $115k).
- Cap rate 9.9% vs local median 4.3% in Tahlequah — top-decile yield for the area; either an underpriced asset or a hidden risk that comps aren't pricing in. Stress-test before assuming the spread holds.
Location & tenants
- Location reads 66/100 on livability (#124 in OK) — a middle-class / working-renter tenant base. Strengths: cost of living A+, housing A; Watch: schools D, amenities D, commute F.
- Tahlequah (town): math 27% / reading 25% proficiency, ranked #109 of 270 in OK (top 40%) — low school quality limits family demand, transient renter base, plan for 1-2y turnover; 64% free/reduced lunch — lower-income household profile, screen leases tightly.
- Market conditions: Rents rising fast (+9.2%/yr); 367 active listings in the ZIP; 48 units permitted in Cherokee County in 2024 (0 in 5+ unit buildings).
- This rent runs 31% of the median local income ($51k/yr) — at the standard rent-burdened threshold; future hikes will face affordability resistance.
Forward outlook
- Local home prices are declining (-3.0%/yr); year-one equity from $795 of loan paydown is wiped out by about $3k of value loss. Plan a longer hold.
- Cherokee County population projected at +15% by 2050 — modest demand growth; plan on rents tracking national, not racing it.
- At projected returns (-3.0% appreciation + 8.0% rent growth), your $32k cash investment doubles in ~7 years — after that, you're playing with house money.
Negotiation context
- Only 2 days on market — expect competitive offers; lowballing is unlikely to land.
- 5 sale attempts since 19y ago with the ask held roughly flat each time — persistent listings suggest the price (not the market) is what's stuck; bring a comps-based counter.
- Current owner paid $62k; list at $115k implies a 85% gain — meaningful room to come down on a strong offer.
Risks & watch-outs
- Climate carrying-cost: severe wildfire risk; extreme-heat days projected 7→19/yr by 2055 (HVAC capex compounding) — expect insurance premiums to compound above CPI over the hold.
Questions for the listing agent
- Built in 1970 — when were the roof, HVAC, electrical panel, plumbing, and water heater last replaced?
- Is there a deadline driving the sale (1031 exchange, divorce, estate, relocation)? That informs how much negotiation room exists.
- Schools are D-rated, which usually means shorter tenancies and higher turnover. Who's the typical renter profile here, and what's been the actual vacancy rate?
- What's the average days-on-market for RENTAL listings here right now (not sales)? A rising rental-DOM trend means longer vacancies and softer asking-rent achievability than the comps imply.
- What's the recent tenant-quality profile in this submarket — average credit score on applications, eviction rate, late-payment / NSF rate, and stable-employment percentage? A property-management company in the area should have these aggregated.
- How much new for-sale + rental construction is in the pipeline within 1–3 miles? Heavy new supply typically softens prices + rents 12–24 months out; constrained supply supports both.
Investment metrics
- 1% rule
- 1.17% ✓
- Cap rate
- 9.86%
- Cash-on-cash
- 12.74%
- DSCR
- 1.57
- GRM
- 7.1
CMA / ARV
- ARV (on-the-fly)
- $215,952
- Comps found
- 12
Show comp detail 12 sales within ~0.75 mi
| Address | Dist | Beds/Ba | Sqft | Sold | Price | $/sf | Match |
|---|---|---|---|---|---|---|---|
| 1002 Hillcrest Ave | 0.38mi | 3/2.0 | 1,734 (+6%) | 0mo | $258,220 | $149 | 72 |
| 1202 S Ross Ave | 0.57mi | 3/2.0 | 1,620 (-1%) | 1mo | $246,500 | $152 | 71 |
| 509 W 2nd St | 0.51mi | 3/2.0 | 1,608 (-2%) | 6mo | $239,900 | $149 | 68 |
| 1104 Chase Ave | 0.52mi | 3/2.0 | 1,560 (-5%) | 6mo | $238,485 | $153 | 63 |
| 501 W 2nd St | 0.55mi | 3/1.5 | 1,557 (-5%) | 4mo | $115,000 | $74 | 61 |
| 422 S Mission Ave Unit 1/2 | 0.49mi | 4/2.0 (+1) | 1,660 (+2%) | 12mo | $185,000 | $111 | 60 |
| 852 W Keetoowah St | 0.55mi | 3/2.0 | 1,588 (-3%) | 12mo | $125,000 | $79 | 60 |
| 1105 W 1st St | 0.26mi | 3/1.0 | 1,465 (-10%) | 11mo | $189,900 | $130 | 58 |
| 905 Lamer Ave | 0.53mi | 3/2.0 | 1,527 (-7%) | 10mo | $69,500 | $46 | 56 |
| 608 S College Ave | 0.62mi | 3/2.0 | 1,566 (-4%) | 12mo | $172,500 | $110 | 54 |
| 807 W Choctaw St | 0.47mi | 3/2.0 | 1,440 (-12%) | 6mo | $209,900 | $146 | 53 |
| 513 S State Ave | 0.51mi | 4/2.0 (+1) | 1,400 (-14%) | 1mo | $185,000 | $132 | 46 |
Match score weights: distance 35% · size 25% · config 20% · recency 20%. Top-matched comps best support the ARV.
Projected returns pro-forma
-3.0% appreciation · 8.0% rent growth · sell at horizon
- IRR
- 7.7%
- Equity multiple
- 1.32×
- Total profit
- $10,207
- Equity at exit
- $17,147
- IRR
- 20.7%
- Equity multiple
- 3.15×
- Total profit
- $69,126
- Equity at exit
- $9,943
Cash invested: $32,200 (down + closing). Projections, not guarantees.
Landlord ↔ Tenant lean methodology
- Overall (STATE)
- 83 Strongly Landlord-Friendly
- State Oklahoma
- 83 Strongly Landlord-Friendly · R+20
- County
- — inherits STATE
- City
- — inherits STATE
ZIP-level market 74464
- Rents YoY
- 9.2%
- Active inventory
- 367
- Price-to-rent
- 7.1×
Monthly cashflow live
- Estimated rent
- $1,343 medium interval (Pro) →
- Mortgage (P&I)
- −$603
- Tax from tax record
- −$68 /mo · $822/yr
- Insurance
- −$48
- HOA
- −$0
- Vacancy / Maint / Mgmt
- −$282
- Net cashflow
- $342
Break-even live
UW: 25.0% down · 7.5% · 30yr · 1.5% tax · 5.0% vac · 8.0% maint · 8.0% mgmt
Financing live
Cash to close
- Down payment
- $28,750
- Closing costs
- $3,450
- Reserves months
- —
- Total cash needed
- —
Loan-product check · same deal, 3 products live
Conventional
25% down · 7.5% · 30yr
- Down + closing
- —
- Monthly P&I
- —
- Monthly cashflow
- —
- DSCR
- —
- Eligible?
- —
Personal DTI + credit; lowest rate.
DSCR
20% down · 8.5% · 30yr
- Down + closing
- —
- Monthly P&I
- —
- Monthly cashflow
- —
- DSCR
- —
- Eligible?
- —
No personal income docs; deal must DSCR.
Hard money
10% down · 12.0% · 12mo
- Down + closing
- —
- Monthly P&I
- —
- Monthly cashflow
- —
- DSCR
- —
- Eligible?
- —
Short-term bridge; refi at stabilization.
Listing history 12 events
-
2025-10-10status Pending
-
2025-10-07$115,000 Active
-
2016-08-12soldstatus $62,000
-
2016-08-11soldstatus $62,000 97-char remark
Show marketing remark (97 chars)
1025 W. FOX STREET. .. A WONDERFUL PLACE TO BE! NICE 3 BEDROOM, 2 BATH HOUSE IN A GREAT LOCATION.
-
2016-05-16$69,900 97-char remark
Show marketing remark (97 chars)
1025 W. FOX STREET. .. A WONDERFUL PLACE TO BE! NICE 3 BEDROOM, 2 BATH HOUSE IN A GREAT LOCATION.
-
2016-05-16historical
Show marketing remark (97 chars)
1025 W. FOX STREET. .. A WONDERFUL PLACE TO BE! NICE 3 BEDROOM, 2 BATH HOUSE IN A GREAT LOCATION.
-
2015-11-24$69,900
-
2009-02-15historical
-
2008-08-15$79,900
-
2008-08-15historical
-
2007-04-24$82,500
-
1995-09-08soldstatus $43,500
ⓘ Source: listings_history table (triggers on properties + properties_extension) + one-shot
backfill from property_details.listing_events for pre-trigger history.
Tax reassessment forecast OK · Resets to sale price
- Current annual tax
- $822 · $68/mo
- Projected year-2 tax
- $1,035 · $86/mo
- Expected delta
- +$213/yr (+$18/mo · 25.9%)
ⓘ Screening estimate from a state-policy table — verify with the county assessor before closing.
Climate risk First Street
- Flood 1/10 Low FEMA zone X (unshaded) · 0% chance over 30 yrs
- Wildfire 8/10 Severe
- Heat 6/10 Major 7 d/yr ≥110°F today · 19 d/yr by 30 yrs out
- Wind 2/10 Low 4% chance of damaging wind over 30 yrs
- Air quality 2/10 Low 1 unhealthy d/yr today · 2 by 30 yrs out
Nearby sold comps map
Loading sold comps map…
Walkable amenities ~0.75 mi
Loading nearby amenities…
Taxation est. · year 1
- Rental income
- $16,121
- − Mortgage interest
- −$6,442
- − Property taxes
- −$822
- − Insurance
- −$575
- − Repairs & maintenance
- −$1,290
- − Management
- −$1,290
- − Depreciation
- −$3,345
- Taxable income
- $2,357
- Est. tax owed @ 24.0%
- −$566
- After-tax cash flow
- $3,536/yr
For passive investors: Depreciation is non-cash, so a rental often shows a tax loss while cash-flowing — sheltering income. Rental losses are passive: they offset passive income freely, and up to $25,000/yr can offset ordinary (W-2) income if you actively participate and your MAGI is under $100k (phasing out to $0 by $150k); unused losses carry forward. On sale, claimed depreciation is recaptured at up to 25%, and gains may owe capital-gains tax (a 1031 exchange can defer both). Figures are a year-1 estimate at your 24.0% rate — not tax advice; consult a CPA.
Schools (NCES district)
- District
- Tahlequah
- NCES district ID
- 4029380
- Math proficiency
- 27% ▼ -14.00%
- Reading proficiency
- 25% ▼ -11.00%
- Median HH income
- $32,990
- Composite
- 21.28/100
- National rank
- #8393
- State rank
- #109 of 270 in OK
Livability — Tahlequah
- Score
- 66/100
- State rank
- #124
- US rank
- #12171
Category grades
Schools grade is shown separately in the Schools card above.
Census & demographics
- Census place
- Tahlequah, OK
- County
- Cherokee County · 31,116 people
- City population
- 31,116
- Metro
- Tahlequah, OK
- Population (ZIP)
- 31,116
- Household income
- $51,262
- Rent vs Own
- Severe rent burden
- 1058.0
Population outlook (Cherokee County) Hauer SSP2
- Today (2025)
- 51,747 people
- By 2030
- 53,481 · +3.4%
- By 2040
- 56,503 · +9.2%
- By 2050
- 59,370 · +14.7%
- By 2075
- 67,178 · +29.8%
- By 2100
- 70,900 · +37.0%
Race, ethnicity, and origin ACS 2023
- Neighborhood character
- Highly diverse neighborhood (Simpson 0.82)
- Race & ethnicity
- White 41% Native American 35% Two or more races 16% Hispanic / Latino 10% Black 2%
- Hispanic origin (detail)
- Mexican 8%
- Common ancestry
- Italian 2% Slovak 2% Lithuanian 1%
- Foreign-born
- 4% · Canada
- Languages at home
- 90% English-only · Spanish 6%
Political lean MEDSL · Cherokee
- 2024 margin
- Solid R (+32.6) · D 32.7% · R 65.3% · Other 2.0%
- 2008→2024 swing
- -20.4pp toward R · 2008: -12.2pp · 2024: -32.6pp
- All cycles
- 2024: R+32.6 2020: R+29.3 2016: R+27.5 2012: R+14.1 2008: R+12.2
Not yet ingested
- Civics
- —
Market trends
- HPI YoY
- ▼ -184.14%
- Current HPI
- 226.4004
- Rent YoY
- ▲ 9.23%
- Metro
- Tahlequah, OK
- State GDP YoY
- ▲ 1.55%
- F500 in state
- 6
Industry mix (Fortune 500 HQ in OK)
| Industry | F500 HQs | Revenue |
|---|---|---|
| Energy | 3 | $48B |
|
||
Price history
+164.4% since first listed12 events — show timeline
- 2025-10-10 Pending — MLSOK
- 2025-10-07 Listed $115,000 MLSOK
- 2016-08-12 Sold (Public Records) $62,000 Public Records
- 2016-08-11 Sold (MLS) $62,000 MLS Technology, Inc.
- 2016-05-16 Listing Removed — MLS Technology, Inc.
- 2016-05-16 Listed $69,900 MLS Technology, Inc.
- 2015-11-24 Listed $69,900 MLS Technology, Inc.
- 2009-02-15 Listing Removed — MLS Technology, Inc.
- 2008-08-15 Listing Removed — MLS Technology, Inc.
- 2008-08-15 Listed $79,900 MLS Technology, Inc.
- 2007-04-24 Listed $82,500 MLS Technology, Inc.
- 1995-09-08 Sold (Public Records) $43,500 Public Records
Property tax history
+5.9%/yrLatest (2025): $822 · -21.1% YoY. Source: county tax records.
Cash-flow waterfall
monthlySold comps — $/sqft
last 12 mo · ≤1 miLoading sold comps…