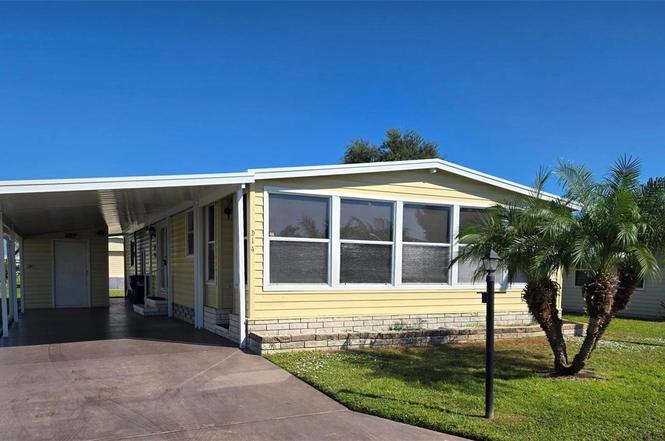
5316 53rd Ave E Unit D14 · Bradenton, FL
Flood risk 4/10 · Minor
- FEMA flood zone
- X (unshaded)
- Chance of flooding over 30 yrs
- 0.21%
- Est. flood insurance / yr
- $507 – $1,088
Fire risk 1/10 · Minimal
- Est. fire insurance / yr
- $947 – $1,759
Heat risk 10/10 · Severe
- Hot days now (above 108°F)
- 7 days/yr
- Hot days in 30 yrs
- 30 days/yr
Wind risk 10/10 · Severe
- Chance of severe wind over 30 yrs
- 99.0%
Air-quality risk 2/10 · Minimal
- Unhealthy air days now
- 1 days/yr
- Unhealthy air days in 30 yrs
- 1 days/yr
Risk factors via First Street. Map © Google.
Why this score? — see what drove the D+ grade
The composite is a weighted blend of 9 inputs, each scored 0–100. Each bar is that input's sub-score; the figure is the points it added to the 100-point composite (weight × sub-score).
- Cash flow +18.1/30.0
- 1% rule +6.1/10.0
- DSCR +5.7/10.0
- Schools +4.4/10.0
- Livability +4.0/5.0
- Condition / age +2.5/5.0
- ARV discount +2.4/15.0
- Rent growth +2.3/5.0
- Appreciation +0.0/10.0
$184,750
🖨 Deal sheet (PDF) 📄 Offer letter ✓ Due diligence
Listing remarks
Move right into your Fabulous New Home soon! Your new home has been immaculately maintained with many newer major improvements! This home has a replaced Carport in 2025 that could fits vehicles, along with more space for possibly a third vehicle uncovered. Enjoy the spacious Florida Room across the front of the Home. The Kitchen has a quality Stainless Steel newer Refrigerator and a nice eating area to relax in. The large Master Bedroom has a spacious Walk-In Closet, a separate Sink and Vanity area, along with the walk-in shower and commode. In 2023, a new Water Heater was installed, A/C, Dehumidifier, and Surge Protector along with all new flooring throughout, including the Florida Room. I
Key facts
- Huge heated pool
- New water heater
- Replaced carport
Tags
Property features AI
Finance
- Other: Furnished; Lease restrictions apply
- Financial info: Total monthly fees $300; total annual fees $3,600
- HOA & community: Has HOA (Lou Paul) with monthly fee of $300; Association fee includes cable TV, common area taxes, pool, escrow reserves, grounds maintenance, management, private road, recreational facilities, sewer, trash, and water; Association amenities: clubhouse, pool, recreation facilities, shuffleboard court, laundry, cable TV; Buyer approval required for association; Senior community; Pets allowed; Deed restrictions and special community restrictions; Street lights, community mailbox, golf carts OK
Exterior
- Parking: Carport with 2 spaces
- Utilities: Public water (see remarks); Public sewer; Electricity connected; Water connected; Sewer connected; Cable connected; Underground utilities
- Home design: Manufactured home (double wide); One story; South-facing; Entry level: One
- Construction: Metal siding; Roof over; Crawlspace foundation; Building area total approximately 1944 sq ft
- Exterior features: Front porch; Awnings; Shed(s); In county lot, paved; Paved road
Interior
- Kitchen: Dishwasher; Disposal; Ice maker; Microwave; Range; Range hood; Refrigerator; Electric water heater
- Bedrooms: 2 bedrooms
- Bathrooms: 2 full bathrooms
- Heating & cooling: Electric heating; Central air conditioning
- Interior features: Ceiling fans; Crown molding; Split-bedroom layout; Thermostat; Walk-in closet(s); Window treatments (blinds, tinted windows)
- Laundry & utility: Washer; Dryer; Laundry located outside
Neighborhood map
What this means for you Summary
Snapshot
- This is a 2-bed/1.0-bath manufactured listed at $185k.
Deal economics
- At list price, monthly cash flow is $163 ($2k/yr) — positive.
- The deal already cash-flows at list — no discount required.
- Meets the 1% rule at list price ($2k rent vs $185k).
- Recommended offer: $163k (12.0% below list) — sets the bar for market timing.
- Cap rate 7.3% vs local median 3.6% in Bradenton — top-decile yield for the area; either an underpriced asset or a hidden risk that comps aren't pricing in. Stress-test before assuming the spread holds.
Location & tenants
- Location reads 81/100 on livability (#101 in FL, #1,528 nationally) — a professional / high-income tenant draw. Strengths: commute A+, cost of living A+, housing A+; Watch: employment D+, crime D, amenities F.
- Manatee (suburban): math 54% / reading 50% proficiency, ranked #26 of 73 in FL (top 36%) — acceptable for families but not a draw, mixed tenant base, ~2y average lease.
- Zoned schools: Tara Elementary School (math 79% / reading 66%, grade A, #281 of 2,144 statewide, top 13%, 559 students, 52% FRL); Braden River High School (math 44% / reading 52%, grade D, #201 of 667 statewide, top 30%, 1,774 students, 45% FRL) — zoned schools at 48% FRL track the district average.
- Market conditions: Rents soft (-1.0%/yr); 384 active listings in the ZIP; 21 comparable units currently listed for rent nearby; rentals at typical pace (median 24d on market — plan ~3-4 weeks tenant-placement turnaround); 7,472 units permitted in Manatee County in 2024 (1,782 in 5+ unit buildings).
- This rent runs 35% of the median local income ($71k/yr) — at the standard rent-burdened threshold; future hikes will face affordability resistance.
Forward outlook
- Local home prices are declining (-3.0%/yr); year-one equity from $1k of loan paydown is wiped out by about $6k of value loss. Plan a longer hold.
- Manatee County population projected at +43% by 2050 — long-run rental-demand tailwind backs the buy-and-hold thesis.
Negotiation context
- It's been on market 231 days — a 12% lower offer ($163k) is reasonable based on typical stale-listing flexibility.
- Current owner paid $80k; list at $185k implies a 131% gain — meaningful room to come down on a strong offer.
Risks & watch-outs
- Climate carrying-cost: severe wind risk, 99% chance of damaging wind over 30y; extreme-heat days projected 7→30/yr by 2055 (HVAC capex compounding) — expect insurance premiums to compound above CPI over the hold.
Questions for the listing agent
- It's been on market 231 days. Have you received any prior offers? Is the seller open to a 12% concession, seller financing, or rate buy-down credit?
- Built in 1979 — when were the roof, HVAC, electrical panel, plumbing, and water heater last replaced?
- What does the HOA fee cover, when was the last increase, and are there any pending special assessments or reserve-fund shortfalls?
- Why hasn't it sold? Are there any deal-killer items the seller is aware of (foundation, flood, title, zoning, code violations)?
- Is there a deadline driving the sale (1031 exchange, divorce, estate, relocation)? That informs how much negotiation room exists.
- Crime grade is D in this area — have there been break-ins, vandalism, or insurance claims at this property in the last 3 years? What carrier currently insures it and at what premium?
- The area grade is low — what's the realistic commute time and amenity access for the typical tenant pool here? Any planned neighborhood developments (good or bad) we should know about?
- What's the average days-on-market for RENTAL listings here right now (not sales)? A rising rental-DOM trend means longer vacancies and softer asking-rent achievability than the comps imply.
- What's the recent tenant-quality profile in this submarket — average credit score on applications, eviction rate, late-payment / NSF rate, and stable-employment percentage? A property-management company in the area should have these aggregated.
- How much new for-sale + rental construction is in the pipeline within 1–3 miles? Heavy new supply typically softens prices + rents 12–24 months out; constrained supply supports both.
Investment metrics
- 1% rule
- 1.11% ✓
- Cap rate
- 7.35%
- Cash-on-cash
- 3.77%
- DSCR
- 1.17
- GRM
- 7.5
CMA / ARV
- ARV (on-the-fly)
- $165,792
- Comps found
- 12
Show comp detail 12 sales within ~0.75 mi
| Address | Dist | Beds/Ba | Sqft | Sold | Price | $/sf | Match |
|---|---|---|---|---|---|---|---|
| 5316 53rd Ave E Unit K14 | 0.12mi | 2/2.0 | 1,056 (0%) | 6mo | $140,000 | $133 | 86 |
| 5316 53rd Ave E Unit F24 | 0.10mi | 2/2.0 | 1,056 (0%) | 9mo | $60,000 | $57 | 84 |
| 5316 53rd Ave E Unit L1 | 0.19mi | 2/2.0 | 1,056 (0%) | 5mo | $175,000 | $166 | 83 |
| 5316 53rd Ave E Unit N9 | 0.23mi | 2/2.0 | 1,056 (0%) | 3mo | $160,000 | $152 | 82 |
| 5316 53rd Ave E Unit F41 | 0.07mi | 2/2.0 | 1,104 (+4%) | 10mo | $120,000 | $109 | 76 |
| 5316 53rd Ave E Unit Q5 | 0.20mi | 2/2.0 | 960 (-9%) | 4mo | $105,000 | $109 | 68 |
| 5707 45th St E #158 | 0.60mi | 2/2.0 | 1,042 (-1%) | 3mo | $170,000 | $163 | 63 |
| 5316 53rd Ave E Unit M7 | 0.21mi | 3/2.0 (+1) | 1,152 (+9%) | 9mo | $185,000 | $161 | 58 |
| 5707 45th St E #136 | 0.60mi | 2/2.0 | 1,100 (+4%) | 6mo | $150,000 | $136 | 56 |
| 5707 45th St E #253 | 0.60mi | 2/2.0 | 1,115 (+6%) | 3mo | $174,900 | $157 | 56 |
| 5707 45th St E #180 | 0.60mi | 2/2.0 | 1,125 (+6%) | 4mo | $225,000 | $200 | 53 |
| 5707 45th St E #35 | 0.60mi | 2/2.0 | 912 (-14%) | 4mo | $160,000 | $175 | 42 |
Match score weights: distance 35% · size 25% · config 20% · recency 20%. Top-matched comps best support the ARV.
Projected returns pro-forma
-3.0% appreciation · 0.0% rent growth · sell at horizon
- IRR
- -14.2%
- Equity multiple
- 0.51×
- Total profit
- $-25,449
- Equity at exit
- $27,547
- IRR
- -12.1%
- Equity multiple
- 0.39×
- Total profit
- $-31,487
- Equity at exit
- $15,974
Cash invested: $51,730 (down + closing). Projections, not guarantees.
Landlord ↔ Tenant lean methodology
- Overall (STATE)
- 87 Strongly Landlord-Friendly
- State Florida
- 87 Strongly Landlord-Friendly · R+3
- County
- — inherits STATE
- City
- — inherits STATE
ZIP-level market 34203
- Home prices YoY
- -24.5%
- Rents YoY
- -1.0%
- Active inventory
- 384
- Price-to-rent
- 7.5×
Monthly cashflow live
- Estimated rent
- $2,053 high interval (Pro) →
- Mortgage (P&I)
- −$969
- Tax from tax record
- −$113 /mo · $1,358/yr
- Insurance
- −$77
- HOA
- −$300
- Vacancy / Maint / Mgmt
- −$431
- Net cashflow
- $163
Break-even live
Sensitivity live
| Price | -10% $267 | -5% $215 | +0% $163 | +5% $110 | +10% $58 |
|---|---|---|---|---|---|
| Rent | -10% $1 | -5% $82 | +0% $163 | +5% $244 | +10% $325 |
| Rate | -1.0pp $256 | -0.5pp $210 | base $163 | +0.5pp $115 | +1.0pp $66 |
UW: 25.0% down · 7.5% · 30yr · 1.5% tax · 5.0% vac · 8.0% maint · 8.0% mgmt
Financing live
Cash to close
- Down payment
- $46,188
- Closing costs
- $5,542
- Reserves months
- —
- Total cash needed
- —
Loan-product check · same deal, 3 products live
Conventional
25% down · 7.5% · 30yr
- Down + closing
- —
- Monthly P&I
- —
- Monthly cashflow
- —
- DSCR
- —
- Eligible?
- —
Personal DTI + credit; lowest rate.
DSCR
20% down · 8.5% · 30yr
- Down + closing
- —
- Monthly P&I
- —
- Monthly cashflow
- —
- DSCR
- —
- Eligible?
- —
No personal income docs; deal must DSCR.
Hard money
10% down · 12.0% · 12mo
- Down + closing
- —
- Monthly P&I
- —
- Monthly cashflow
- —
- DSCR
- —
- Eligible?
- —
Short-term bridge; refi at stabilization.
Rent comps 21 comps
| Address | Beds | Baths | Sqft | Rent | $/sqft | DOM | Units | Dist |
|---|---|---|---|---|---|---|---|---|
| 5316 53rd Ave E Unit Q111 Bradenton, FL | 2.0 | 2.0 | 1056 | $1,495 | $1.42 | 11d | 1 | 0.11mi |
| 5616 Gentle Breeze St Bradenton, FL | 2.0 | 2.0 | 1100 | $1,700 | $1.55 | 24d | 1 | 0.21mi |
| 5650 Simonton St Bradenton, FL | 2.0 | 2.5 | 1496 | $2,095 | $1.40 | 4d | 1 | 0.31mi |
| 5635 Whitehead St Bradenton, FL | 2.0 | 2.5 | 1496 | $2,300 | $1.54 | 24d | 1 | 0.34mi |
| 5707 45th St E #19 Bradenton, FL | 2.0 | 2.0 | 972 | $1,700 | $1.75 | 24d | 1 | 0.58mi |
| 5016 Misty Canal Pl Bradenton, FL | 2.0 | 2.5 | 1080 | $1,950 | $1.81 | 24d | 1 | 0.77mi |
| 4540 Runabout Way Bradenton, FL | 2.0 | 2.5 | 1080 | $2,300 | $2.13 | 24d | 1 | 0.78mi |
| 5515 Fair Oaks St Unit 5515 Bradenton, FL | 2.0 | 2.0 | 1004 | $2,000 | $1.99 | 24d | 1 | 0.90mi |
| 6503 Fairway Gardens Dr Unit Available Bradenton, FL | 2.0 | 2.0 | 1346 | $2,200 | $1.63 | 24d | 1 | 0.95mi |
| 5414 Fair Oaks St Unit 10-D Bradenton, FL | 2.0 | 2.0 | 1004 | $1,995 | $1.99 | 4d | 1 | 0.95mi |
| 6501 Stone River Rd Bradenton, FL | 2.0 | 2.0 | 1080 | $2,820 | $2.61 | 16d | 2 | 1.03mi |
| 6501 Stone River Rd Unit Available Bradenton, FL | 2.0 | 2.0 | 1118 | $2,200 | $1.97 | 24d | 1 | 1.03mi |
| 6505 Stone River Rd Bradenton, FL | 2.0 | 2.0 | 1080 | $2,825 | $2.62 | 16d | 3 | 1.10mi |
| 3645 Ali ala LOOP Braden River, FL | 1.0 | 1.0 | 950 | $1,400 | $1.47 | 24d | 1 | 1.15mi |
| 3880 Palm Isle Pl Bradenton, FL | 1.0–2.0 | 1.0–2.0 | 1042 | $2,499 | $2.40 | 2d | 13 | 1.19mi |
| 6758 Fairview Ter Bradenton, FL | 2.0 | 2.0 | 1346 | $2,300 | $1.71 | 24d | 1 | 1.28mi |
| 6713 Stone River Rd #202 Bradenton, FL | 2.0 | 2.0 | 1232 | $1,900 | $1.54 | 24d | 1 | 1.31mi |
| 6807 Stone River Rd #202 Bradenton, FL | 2.0 | 2.0 | 1292 | $3,500 | $2.71 | 16d | 1 | 1.33mi |
| 4815 Woodbrook Dr Sarasota, FL | 2.0 | 2.0 | 1080 | $2,290 | $2.12 | 4d | 1 | 1.33mi |
| 6870 Fairview Ter #6870 Bradenton, FL | 2.0 | 2.0 | 1346 | $2,200 | $1.63 | 16d | 1 | 1.37mi |
| 6872 Fairview Ter #101 Bradenton, FL | 2.0 | 2.0 | 1352 | $2,000 | $1.48 | 24d | 1 | 1.37mi |
HOA detail
- Monthly dues
- $300 · $3,600/yr
- Likely covers
- water
Listing history 20 events
-
2026-06-18days on market $184,750 Active 231 DOM
-
2026-06-17days on market $184,750 Active 230 DOM
-
2026-06-16days on market $184,750 Active 229 DOM
-
2026-06-15days on market $184,750 Active 228 DOM
-
2026-06-13days on market $184,750 Active 226 DOM
-
2026-06-13days on market $184,750 Active 225 DOM
-
2026-06-10days on market $184,750 Active 223 DOM
-
2026-06-09days on market $184,750 Active 222 DOM
-
2026-06-08days on market $184,750 Active 221 DOM
-
2026-06-08days on market $184,750 Active 220 DOM
-
2026-06-03days on market $184,750 Active 216 DOM
-
2026-06-02days on market $184,750 Active 215 DOM
-
2026-06-01days on market $184,750 Active 214 DOM
-
2026-05-31days on market $184,750 Active 213 DOM
-
2026-04-10price $184,750
-
2026-01-26price $195,100
-
2025-10-30$214,750 Active
-
2020-03-11soldstatus $80,000
-
2016-04-28soldstatus $70,000
-
1991-11-15soldstatus $20,000
ⓘ Source: listings_history table (triggers on properties + properties_extension) + one-shot
backfill from property_details.listing_events for pre-trigger history.
Tax reassessment forecast FL · Resets to sale price
- Current annual tax
- $1,358 · $113/mo
- Projected year-2 tax
- $1,533 · $128/mo
- Expected delta
- +$175/yr (+$15/mo · 12.9%)
ⓘ Screening estimate from a state-policy table — verify with the county assessor before closing.
Climate risk First Street
- Flood 4/10 Moderate FEMA zone X (unshaded) · 21% chance over 30 yrs
- Wildfire 1/10 Low
- Heat 10/10 Extreme 7 d/yr ≥108°F today · 30 d/yr by 30 yrs out
- Wind 10/10 Extreme 99% chance of damaging wind over 30 yrs
- Air quality 2/10 Low 1 unhealthy d/yr today · 1 by 30 yrs out
Nearby sold comps map
Loading sold comps map…
Walkable amenities ~0.75 mi
Loading nearby amenities…
Taxation est. · year 1
- Rental income
- $24,634
- − Mortgage interest
- −$10,349
- − Property taxes
- −$1,358
- − Insurance
- −$924
- − Repairs & maintenance
- −$1,971
- − Management
- −$1,971
- − HOA
- −$3,600
- − Depreciation
- −$5,375
- Taxable loss
- −$913
- Est. tax savings @ 24.0%
- +$219
- After-tax cash flow
- $2,171/yr
For passive investors: Depreciation is non-cash, so a rental often shows a tax loss while cash-flowing — sheltering income. Rental losses are passive: they offset passive income freely, and up to $25,000/yr can offset ordinary (W-2) income if you actively participate and your MAGI is under $100k (phasing out to $0 by $150k); unused losses carry forward. On sale, claimed depreciation is recaptured at up to 25%, and gains may owe capital-gains tax (a 1031 exchange can defer both). Figures are a year-1 estimate at your 24.0% rate — not tax advice; consult a CPA.
Schools (NCES district)
- District
- Manatee
- NCES district ID
- 1201230
- Math proficiency
- 54% ▼ -6.00%
- Reading proficiency
- 50% ▼ -2.00%
- Median HH income
- $49,607
- Composite
- 44.43/100
- National rank
- #2806
- State rank
- #26 of 73 in FL
Livability — Bradenton
- Score
- 81/100
- State rank
- #101
- US rank
- #1528
Category grades
Schools grade is shown separately in the Schools card above.
Census & demographics
- County
- Manatee County · 416,364 people
- City population
- 227,091
- Metro
- North Port-Sarasota-Bradenton, FL
- Population (ZIP)
- 40,618
- Household income
- $70,761
- Rent vs Own
- Severe rent burden
- 1469.0
Population outlook (Manatee County) Hauer SSP2
- Today (2025)
- 447,342 people
- By 2030
- 488,911 · +9.3%
- By 2040
- 567,934 · +27.0%
- By 2050
- 637,995 · +42.6%
- By 2075
- 781,970 · +74.8%
- By 2100
- 848,272 · +89.6%
Race, ethnicity, and origin ACS 2023
- Neighborhood character
- Predominantly White (65%)
- Race & ethnicity
- White 65% Hispanic / Latino 19% Two or more races 12% Black 9% Asian 5%
- Hispanic origin (detail)
- Mexican 9% Puerto Rican 3% Cuban 2% Dominican 1%
- Common ancestry
- Lithuanian 3% Romanian 3% Slovak 2%
- Foreign-born
- 17% · Canada, Vietnam, Dominican Republic
- Languages at home
- 76% English-only · Spanish 16% Vietnamese 2% Other Indo-European 1%
Political lean MEDSL · Manatee
- 2024 margin
- Strong R (+23.5) · D 37.9% · R 61.4%
- 2008→2024 swing
- -16.5pp toward R · 2008: -7.0pp · 2024: -23.5pp
- All cycles
- 2024: R+23.5 2020: R+16.1 2016: R+17.1 2012: R+12.5 2008: R+7.0
Not yet ingested
- Civics
- —
Market trends
- HPI YoY
- ▼ -95.87%
- Current HPI
- 295.8871
- Rent YoY
- ▼ -0.97%
- Metro
- North Port-Sarasota-Bradenton, FL
- State GDP YoY
- ▲ 3.28%
- F500 in state
- 36
Industry mix (Fortune 500 HQ in FL)
| Industry | F500 HQs | Revenue |
|---|---|---|
| Industrial Technology | 2 | $29B |
|
||
| Insurance | 2 | $17B |
|
||
| Retail | 1 | $60B |
|
||
| Technology Distribution | 1 | $58B |
|
||
| Homebuilding | 1 | $35B |
|
||
| Technology Manufacturing | 1 | $35B |
|
||
Price history
+823.8% since first listed6 events — show timeline
- 2026-04-10 Price Changed $184,750 Stellar MLS as Distributed by MLS Grid
- 2026-01-26 Price Changed $195,100 Stellar MLS as Distributed by MLS Grid
- 2025-10-30 Listed $214,750 Stellar MLS as Distributed by MLS Grid
- 2020-03-11 Sold (Public Records) $80,000 Public Records
- 2016-04-28 Sold (Public Records) $70,000 Public Records
- 1991-11-15 Sold (Public Records) $20,000 Public Records
Property tax history
+10.3%/yrLatest (2025): $1,358 · -3.8% YoY. Source: county tax records.
Cash-flow waterfall
monthlySold comps — $/sqft
last 12 mo · ≤1 miLoading sold comps…