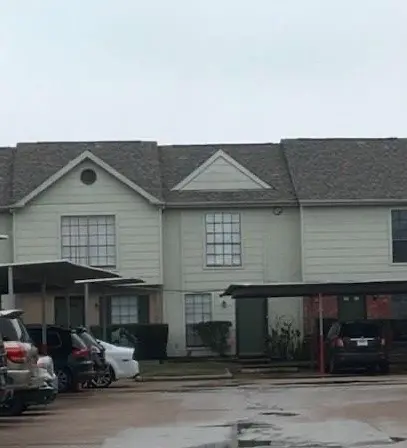
8714 Village Of Fondren Dr · Houston, TX
Flood risk 1/10 · Minimal
- FEMA flood zone
- X (unshaded)
- Chance of flooding over 30 yrs
- 0.0%
- Est. flood insurance / yr
- $507 – $1,088
Fire risk 1/10 · Minimal
- Est. fire insurance / yr
- $1,222 – $2,270
Heat risk 9/10 · Severe
- Hot days now (above 110°F)
- 7 days/yr
- Hot days in 30 yrs
- 24 days/yr
Wind risk 9/10 · Severe
- Chance of severe wind over 30 yrs
- 99.0%
Air-quality risk 3/10 · Minor
- Unhealthy air days now
- 2 days/yr
- Unhealthy air days in 30 yrs
- 3 days/yr
Risk factors via First Street. Map © Google.
Why this score? — see what drove the C+ grade
The composite is a weighted blend of 9 inputs, each scored 0–100. Each bar is that input's sub-score; the figure is the points it added to the 100-point composite (weight × sub-score).
- Cash flow +20.2/30.0
- 1% rule +10.0/10.0
- ARV discount +9.6/15.0
- DSCR +6.4/10.0
- Appreciation +4.6/10.0
- Livability +3.7/5.0
- Condition / age +2.8/5.0
- Schools +2.7/10.0
- Rent growth +2.1/5.0
$88,000
🖨 Deal sheet (PDF) 📄 Offer letter ✓ Due diligence
Listing remarks MLS
NOW AVAILABLE FOR SHOWINGS! Gated community! Three bedrooms and two bathroom townhome next to Beltway 8 & Gessner. Tile floor throughout, no carpet! Updated kitchen and bathrooms with granite counters. Great location, close to major freeways. Proof of funds required with all submitted offers. Room sizes are approximate, verify independently. Call listing agent for showing instructions.
Key facts
- Gated community
- Updated kitchen
- Granite counters
Tags
Neighborhood map
What this means for you Summary
Snapshot
- This is a 3-bed/2.0-bath townhouse listed at $88k. Condition is rated average.
Deal economics
- At list price, monthly cash flow is $110 ($1k/yr) — positive.
- The deal already cash-flows at list — no discount required.
- Meets the 1% rule at list price ($1k rent vs $88k).
- Recommended offer: $77k (12.0% below list) — sets the bar for market timing.
- Cap rate 7.8% vs local median 3.1% in Houston — top-decile yield for the area; either an underpriced asset or a hidden risk that comps aren't pricing in. Stress-test before assuming the spread holds.
Location & tenants
- Location reads 74/100 on livability (#184 in TX, #4,771 nationally) — a middle-class / working-renter tenant base. Strengths: amenities A+, cost of living A+, housing A+; Watch: schools D, crime F.
- Houston ISD (urban): math 27% / reading 35% proficiency, ranked #593 of 826 in TX (top 72%) — families likely to look elsewhere, expect single-tenant / working-renter base with shorter leases; 71% free/reduced lunch — lower-income household profile, screen leases tightly.
- Market conditions: Rents soft (-1.5%/yr); 136 active listings in the ZIP; 19 comparable units currently listed for rent nearby; rentals at typical pace (median 19d on market — plan ~3-4 weeks tenant-placement turnaround); 29,883 units permitted in Harris County in 2024 (8,621 in 5+ unit buildings).
- This rent runs 32% of the median local income ($54k/yr) — at the standard rent-burdened threshold; future hikes will face affordability resistance.
Forward outlook
- Local home prices are declining (-0.7%/yr); year-one equity from $608 of loan paydown is wiped out by about $640 of value loss. Plan a longer hold.
- Harris County population projected at +47% by 2050 — long-run rental-demand tailwind backs the buy-and-hold thesis.
Negotiation context
- It's been on market 344 days — a 12% lower offer ($77k) is reasonable based on typical stale-listing flexibility.
- 3 sale attempts since 2y ago; this cycle's ask is 5969% above the opening price — seller raised mid-cycle; expect resistance to lowballs.
Risks & watch-outs
- Watch-outs: HOA is 29% of rent.
- Climate carrying-cost: severe wind risk, 99% chance of damaging wind over 30y; extreme-heat days projected 7→24/yr by 2055 (HVAC capex compounding) — expect insurance premiums to compound above CPI over the hold.
Questions for the listing agent
- It's been on market 344 days. Have you received any prior offers? Is the seller open to a 12% concession, seller financing, or rate buy-down credit?
- What does the HOA fee cover, when was the last increase, and are there any pending special assessments or reserve-fund shortfalls?
- Why hasn't it sold? Are there any deal-killer items the seller is aware of (foundation, flood, title, zoning, code violations)?
- Is there a deadline driving the sale (1031 exchange, divorce, estate, relocation)? That informs how much negotiation room exists.
- Schools are D-rated, which usually means shorter tenancies and higher turnover. Who's the typical renter profile here, and what's been the actual vacancy rate?
- Crime grade is F in this area — have there been break-ins, vandalism, or insurance claims at this property in the last 3 years? What carrier currently insures it and at what premium?
- What's the average days-on-market for RENTAL listings here right now (not sales)? A rising rental-DOM trend means longer vacancies and softer asking-rent achievability than the comps imply.
- What's the recent tenant-quality profile in this submarket — average credit score on applications, eviction rate, late-payment / NSF rate, and stable-employment percentage? A property-management company in the area should have these aggregated.
- How much new for-sale + rental construction is in the pipeline within 1–3 miles? Heavy new supply typically softens prices + rents 12–24 months out; constrained supply supports both.
Investment metrics
- 1% rule
- 1.65% ✓
- Cap rate
- 7.80%
- Cash-on-cash
- 5.37%
- DSCR
- 1.24
- GRM
- 5.1
CMA / ARV
- ARV (median comp)
- $92,335
- List price
- $88,000
- Delta
- -4.70%
- Verdict
- FAIR
- Comps
- 20 within 1.0 mi
Show comp detail 10 sales within ~0.75 mi
| Address | Dist | Beds/Ba | Sqft | Sold | Price | $/sf | Match |
|---|---|---|---|---|---|---|---|
| 8719 Village Of Fondren Dr #8719 | 0.02mi | 3/2.0 | 1,184 (0%) | 7mo | $92,000 | $78 | 93 |
| 8711 Village Of Fondren Dr #8711 | 0.02mi | 3/2.0 | 1,184 (0%) | 12mo | $105,000 | $89 | 89 |
| 8720 Village Of Fondren Dr #87 | 0.00mi | 3/2.0 | 1,184 (0%) | 16mo | $90,000 | $76 | 87 |
| 8703 Victorian Village Dr #8703 | 0.03mi | 3/2.0 | 1,120 (-5%) | 5mo | $89,900 | $80 | 86 |
| 8733 Victorian Village Dr | 0.03mi | 3/2.0 | 1,120 (-5%) | 12mo | $107,000 | $96 | 80 |
| 8702 Victorian Village Dr #8702 | 0.03mi | 2/1.5 (-1) | 1,120 (-5%) | 12mo | $103,900 | $93 | 73 |
| 8711 Victorian Village Dr #8711 | 0.03mi | 3/2.0 | 1,120 (-5%) | 21mo | $120,000 | $107 | 72 |
| 12663 Windsor Village Dr #2663 | 0.06mi | 2/1.5 (-1) | 1,120 (-5%) | 14mo | $100,000 | $89 | 69 |
| 8647 Victorian Village Dr | 0.08mi | 3/2.0 | 1,120 (-5%) | 22mo | $134,900 | $120 | 69 |
| 8628 Village Of Fondren Dr | 0.07mi | 2/1.5 (-1) | 1,120 (-5%) | 15mo | $114,900 | $103 | 68 |
Match score weights: distance 35% · size 25% · config 20% · recency 20%. Top-matched comps best support the ARV.
Projected returns pro-forma
-0.73% appreciation · 0.0% rent growth · sell at horizon
- IRR
- -2.3%
- Equity multiple
- 0.90×
- Total profit
- $-2,473
- Equity at exit
- $22,399
- IRR
- -0.0%
- Equity multiple
- 1.00×
- Total profit
- $-57
- Equity at exit
- $24,521
Cash invested: $24,640 (down + closing). Projections, not guarantees.
Landlord ↔ Tenant lean methodology
- Overall (STATE)
- 87 Strongly Landlord-Friendly
- State Texas
- 87 Strongly Landlord-Friendly · R+5
- County
- — inherits STATE
- City
- — inherits STATE
ZIP-level market 77071
- Home prices YoY
- -0.3%
- Rents YoY
- -1.5%
- Active inventory
- 136
- Price-to-rent
- 5.1×
Monthly cashflow live
- Estimated rent
- $1,449 high interval (Pro) →
- Mortgage (P&I)
- −$461
- Tax est. 1.5%
- −$110 /mo · $1,320/yr
- Insurance
- −$37
- HOA
- −$426
- Vacancy / Maint / Mgmt
- −$304
- Net cashflow
- $110
Break-even live
Sensitivity live
| Price | -10% $171 | -5% $141 | +0% $110 | +5% $80 | +10% $50 |
|---|---|---|---|---|---|
| Rent | -10% $-4 | -5% $53 | +0% $110 | +5% $168 | +10% $225 |
| Rate | -1.0pp $155 | -0.5pp $133 | base $110 | +0.5pp $88 | +1.0pp $64 |
UW: 25.0% down · 7.5% · 30yr · 1.5% tax · 5.0% vac · 8.0% maint · 8.0% mgmt
Financing live
Cash to close
- Down payment
- $22,000
- Closing costs
- $2,640
- Reserves months
- —
- Total cash needed
- —
Loan-product check · same deal, 3 products live
Conventional
25% down · 7.5% · 30yr
- Down + closing
- —
- Monthly P&I
- —
- Monthly cashflow
- —
- DSCR
- —
- Eligible?
- —
Personal DTI + credit; lowest rate.
DSCR
20% down · 8.5% · 30yr
- Down + closing
- —
- Monthly P&I
- —
- Monthly cashflow
- —
- DSCR
- —
- Eligible?
- —
No personal income docs; deal must DSCR.
Hard money
10% down · 12.0% · 12mo
- Down + closing
- —
- Monthly P&I
- —
- Monthly cashflow
- —
- DSCR
- —
- Eligible?
- —
Short-term bridge; refi at stabilization.
Rent comps 19 comps
| Address | Beds | Baths | Sqft | Rent | $/sqft | DOM | Units | Dist |
|---|---|---|---|---|---|---|---|---|
| 8300 W Airport Blvd Houston, TX | 1.0–2.0 | 1.0–2.0 | 780 | $1,130 | $1.45 | 15d | 1 | 0.54mi |
| 12706 Riceville School Rd Stafford, TX | 2.0 | 2.0 | 1235 | $1,570 | $1.27 | 44d | 1 | 0.66mi |
| 8030 W Airport Blvd Houston, TX | 1.0–2.0 | 1.0–2.0 | 780 | $1,156 | $1.48 | 0d | 31 | 0.69mi |
| 12700 Stafford Rd Stafford, TX | 1.0–2.0 | 1.0–2.0 | 993 | $1,601 | $1.61 | 0d | 13 | 0.71mi |
| 12660 Stafford Rd Stafford, TX | 1.0–3.0 | 1.0–2.0 | 1027 | $1,892 | $1.84 | 0d | 44 | 0.75mi |
| 7706 W Airport Blvd Houston, TX | 2.0 | 1.0 | 875 | $1,080 | $1.23 | 44d | 1 | 1.15mi |
| 7700 W Airport Blvd Unit 7757 Houston, TX | 2.0 | 2.0 | 1005 | $1,232 | $1.23 | 14d | 1 | 1.16mi |
| 8207 W Bellfort Ave Houston, TX | 2.0 | 2.0 | 982 | $990 | $1.01 | 19d | 1 | 1.23mi |
| 8207 W Bellfort Ave Houston, TX | 2.0 | 2.0 | 982 | $990 | $1.01 | 44d | 1 | 1.23mi |
| 8201 W Bellfort Ave Unit 422 Houston, TX | 2.0 | 2.0 | 848 | $955 | $1.13 | 8d | 1 | 1.28mi |
| 8201 W Bellfort Ave Unit 2162 Houston, TX | 2.0 | 2.0 | 848 | $955 | $1.13 | 6d | 1 | 1.28mi |
| 8201 W Bellfort Ave Unit 510 Houston, TX | 3.0 | 2.0 | 1203 | $1,195 | $0.99 | 0d | 1 | 1.28mi |
| 8888 Benning Dr Houston, TX | 3.0 | 3.0 | 1472 | $1,750 | $1.19 | 44d | 1 | 1.39mi |
| 12271 Fondren Rd Houston, TX | 2.0 | 2.0 | 1007 | $1,050 | $1.04 | 23d | 1 | 1.42mi |
| 12271 Fondren Rd Houston, TX | 2.0 | 2.0 | 1007 | $1,050 | $1.04 | 19d | 1 | 1.42mi |
| 12211 Fondren Rd Houston, TX | 1.0–2.0 | 1.0–2.0 | 817 | $1,239 | $1.52 | 0d | 21 | 1.45mi |
| 7809 Wolfield Ln Houston, TX | 2.0 | 2.0 | 1208 | $1,390 | $1.15 | 44d | 1 | 1.47mi |
| 12107 Fondren Rd Houston, TX | 2.0 | 2.0 | 990 | $1,125 | $1.14 | 25d | 1 | 1.48mi |
| 6633 W Airport Blvd Houston, TX | 1.0–2.0 | 1.5–2.0 | 1063 | $1,200 | $1.13 | 44d | 2 | 1.50mi |
HOA detail
- Monthly dues
- $426 · $5,112/yr
- Likely covers
- security
Listing history 23 events
-
2026-06-21statusdays on market $88,000 Pending 344 DOM
-
2026-06-18days on market $88,000 Active 341 DOM
-
2026-06-17days on market $88,000 Active 340 DOM
-
2026-06-16days on market $88,000 Active 339 DOM
-
2026-06-15days on market $88,000 Active 338 DOM
-
2026-06-13days on market $88,000 Active 336 DOM
-
2026-06-10days on market $88,000 Active 332 DOM
-
2026-06-08days on market $88,000 Active 331 DOM
-
2026-06-07days on market $88,000 Active 330 DOM
-
2026-06-04days on market $88,000 Active 327 DOM
-
2026-06-01days on market $88,000 Active 324 DOM
-
2026-05-31days on market $88,000 Active 323 DOM
-
2026-04-26price $88,000 400-char remark
Show marketing remark (400 chars)
NOW AVAILABLE FOR SHOWINGS! Gated community! Three bedrooms and two bathroom townhome next to Beltway 8 & Gessner. Tile floor throughout, no carpet! Updated kitchen and bathrooms with granite counters. Great location, close to major freeways. Proof of funds required with all submitted offers. Room sizes are approximate, verify independently. Call listing agent for showing instructions.
-
2026-04-25price $91,500 400-char remark
Show marketing remark (400 chars)
NOW AVAILABLE FOR SHOWINGS! Gated community! Three bedrooms and two bathroom townhome next to Beltway 8 & Gessner. Tile floor throughout, no carpet! Updated kitchen and bathrooms with granite counters. Great location, close to major freeways. Proof of funds required with all submitted offers. Room sizes are approximate, verify independently. Call listing agent for showing instructions.
-
2026-02-11price $93,500 400-char remark
Show marketing remark (400 chars)
NOW AVAILABLE FOR SHOWINGS! Gated community! Three bedrooms and two bathroom townhome next to Beltway 8 & Gessner. Tile floor throughout, no carpet! Updated kitchen and bathrooms with granite counters. Great location, close to major freeways. Proof of funds required with all submitted offers. Room sizes are approximate, verify independently. Call listing agent for showing instructions.
-
2025-12-15historical $1,450
-
2025-12-05$1,450
-
2025-10-27price $95,000 400-char remark
Show marketing remark (400 chars)
NOW AVAILABLE FOR SHOWINGS! Gated community! Three bedrooms and two bathroom townhome next to Beltway 8 & Gessner. Tile floor throughout, no carpet! Updated kitchen and bathrooms with granite counters. Great location, close to major freeways. Proof of funds required with all submitted offers. Room sizes are approximate, verify independently. Call listing agent for showing instructions.
-
2025-07-12$100,000 Active 400-char remark
Show marketing remark (400 chars)
NOW AVAILABLE FOR SHOWINGS! Gated community! Three bedrooms and two bathroom townhome next to Beltway 8 & Gessner. Tile floor throughout, no carpet! Updated kitchen and bathrooms with granite counters. Great location, close to major freeways. Proof of funds required with all submitted offers. Room sizes are approximate, verify independently. Call listing agent for showing instructions.
-
2025-07-11historical
-
2025-04-09price $105,000
-
2024-10-19price $120,000
-
2024-07-13$129,000 Active
ⓘ Source: listings_history table (triggers on properties + properties_extension) + one-shot
backfill from property_details.listing_events for pre-trigger history.
Climate risk First Street
- Flood 1/10 Low FEMA zone X (unshaded) · 0% chance over 30 yrs
- Wildfire 1/10 Low
- Heat 9/10 Extreme 7 d/yr ≥110°F today · 24 d/yr by 30 yrs out
- Wind 9/10 Extreme 99% chance of damaging wind over 30 yrs
- Air quality 3/10 Moderate 2 unhealthy d/yr today · 3 by 30 yrs out
Nearby sold comps map
Loading sold comps map…
Walkable amenities ~0.75 mi
Loading nearby amenities…
Taxation est. · year 1
- Rental income
- $17,385
- − Mortgage interest
- −$4,929
- − Property taxes
- −$1,320
- − Insurance
- −$440
- − Repairs & maintenance
- −$1,391
- − Management
- −$1,391
- − HOA
- −$5,112
- − Depreciation
- −$2,560
- Taxable income
- $242
- Est. tax owed @ 24.0%
- −$58
- After-tax cash flow
- $1,266/yr
For passive investors: Depreciation is non-cash, so a rental often shows a tax loss while cash-flowing — sheltering income. Rental losses are passive: they offset passive income freely, and up to $25,000/yr can offset ordinary (W-2) income if you actively participate and your MAGI is under $100k (phasing out to $0 by $150k); unused losses carry forward. On sale, claimed depreciation is recaptured at up to 25%, and gains may owe capital-gains tax (a 1031 exchange can defer both). Figures are a year-1 estimate at your 24.0% rate — not tax advice; consult a CPA.
Condition & rehab AI · 9 photos
This townhouse is in average condition with some cosmetic updates needed. It has a good location and is move-in ready with minor repairs and maintenance required.
Repairs flagged
- Minor Paint — Paint appears faded in some areas.
- Minor Siding — Siding appears weathered, but no major damage.
- Minor Kitchen cabinets — Cabinets appear dated, but not damaged.
- Minor Bathroom fixtures — Fixtures appear dated, but not damaged.
Value-add opportunities
- Both Paint the exterior and interior walls — Fresh paint can improve curb appeal and interior aesthetics.
- Both Replace dated kitchen cabinets and fixtures — Newer cabinets and fixtures can significantly enhance the home's value and appeal.
- Both Landscaping and curb appeal improvements — A well-maintained exterior can attract more buyers and renters.
- Both HVAC maintenance — A well-maintained HVAC system can improve comfort and energy efficiency, attracting more buyers and renters.
Renovation cost estimate screening
| Repair item | Severity | Est. cost |
|---|---|---|
| Paint · Paint appears faded in some areas. | Minor | $500–3,000 |
| Siding · Siding appears weathered, but no major damage. | Minor | $500–3,000 |
| Kitchen cabinets · Cabinets appear dated, but not damaged. | Minor | $500–3,000 |
| Bathroom fixtures · Fixtures appear dated, but not damaged. | Minor | $500–3,000 |
| Total estimated repair cost · 4 items | $2,000–12,000 |
Value-add ROI direction
- Both Paint the exterior and interior walls — Fresh paint can improve curb appeal and interior aesthetics. ↑
- Both Replace dated kitchen cabinets and fixtures — Newer cabinets and fixtures can significantly enhance the home's value and appeal. ↑
- Both Landscaping and curb appeal improvements — A well-maintained exterior can attract more buyers and renters. ↑
- Both HVAC maintenance — A well-maintained HVAC system can improve comfort and energy efficiency, attracting more buyers and renters. ↑
ⓘ Cost ranges are severity-bucket heuristics (US national rule-of-thumb). Get contractor quotes + a written scope before underwriting a rehab budget.
Schools (NCES district)
- District
- Houston ISD
- NCES district ID
- 4823640
- Math proficiency
- 27% ▼ -18.00%
- Reading proficiency
- 35% ▼ -6.00%
- Median HH income
- $46,054
- Composite
- 26.63/100
- National rank
- #7173
- State rank
- #593 of 826 in TX
Livability — Houston
- Score
- 74/100
- State rank
- #184
- US rank
- #4771
Category grades
Schools grade is shown separately in the Schools card above.
Census & demographics
- Census place
- Houston, TX
- County
- Harris County · 4,702,590 people
- City population
- 3,226,434
- Metro
- Houston-The Woodlands-Sugar Land, TX
- Population (ZIP)
- 27,056
- Household income
- $54,139
- Rent vs Own
- Severe rent burden
- 1242.0
Population outlook (Harris County) Hauer SSP2
- Today (2025)
- 5,571,493 people
- By 2030
- 6,089,821 · +9.3%
- By 2040
- 7,142,806 · +28.2%
- By 2050
- 8,185,864 · +46.9%
- By 2075
- 10,574,329 · +89.8%
- By 2100
- 12,109,958 · +117.4%
Race, ethnicity, and origin ACS 2023
- Neighborhood character
- Diverse neighborhood (Simpson 0.69)
- Race & ethnicity
- Black 46% Hispanic / Latino 26% White 17% Two or more races 8% Asian 7%
- Hispanic origin (detail)
- Mexican 13%
- Common ancestry
- Romanian 2% Scotch-Irish 1% Lithuanian 1%
- Foreign-born
- 33% · Canada, Vietnam, China
- Languages at home
- 58% English-only · Spanish 25% Vietnamese 3% Chinese 2%
Political lean MEDSL · Harris
- 2024 margin
- Lean D (+5.5) · D 52.0% · R 46.4% · Other 1.6%
- 2008→2024 swing
- +3.9pp toward D · 2008: 1.6pp · 2024: 5.5pp
- All cycles
- 2024: D+5.5 2020: D+13.3 2016: D+12.4 2012: D+0.1 2008: D+1.6
Not yet ingested
- Civics
- —
Market trends
- HPI YoY
- ▼ -0.73%
- Current HPI
- 250.0788
- Rent YoY
- ▼ -1.51%
- Metro
- Houston-The Woodlands-Sugar Land, TX
- State GDP YoY
- ▲ 3.95%
- F500 in state
- 110
Industry mix (Fortune 500 HQ in TX)
| Industry | F500 HQs | Revenue |
|---|---|---|
| Energy | 16 | $1,198B |
|
||
| Technology | 5 | $198B |
|
||
| Engineering / Construction | 4 | $72B |
|
||
| Energy Services | 3 | $60B |
|
||
| Utilities | 3 | $41B |
|
||
| Healthcare | 2 | $330B |
|
||
Price history
-31.8% since first listed11 events — show timeline
- 2026-04-26 Price Changed $88,000 HARMLS
- 2026-04-25 Price Changed $91,500 HARMLS
- 2026-02-11 Price Changed $93,500 HARMLS
- 2025-12-15 Rental Removed $1,450 APPFOLIO
- 2025-12-05 Listed for Rent $1,450 APPFOLIO
- 2025-10-27 Price Changed $95,000 HARMLS
- 2025-07-12 Listed $100,000 HARMLS
- 2025-07-11 Listing Removed — HARMLS
- 2025-04-09 Price Changed $105,000 HARMLS
- 2024-10-19 Price Changed $120,000 HARMLS
- 2024-07-13 Listed $129,000 HARMLS
Cash-flow waterfall
monthlySold comps — $/sqft
last 12 mo · ≤1 miLoading sold comps…