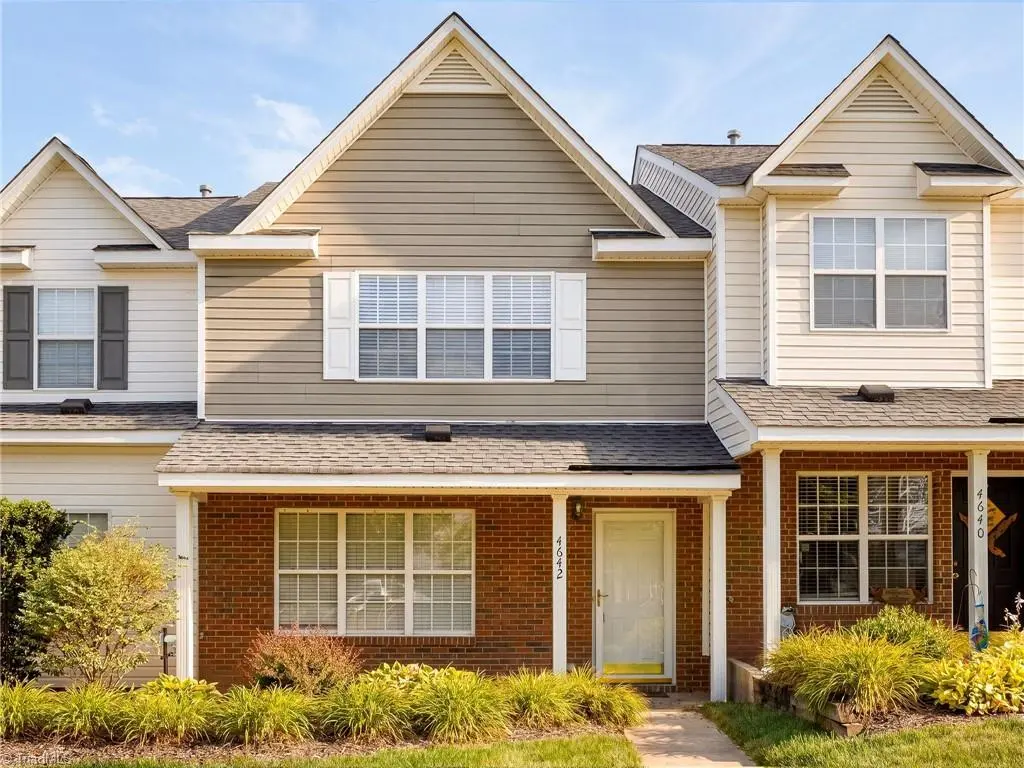
4642 Cross Ridge Ln · Greensboro, NC
Flood risk 1/10 · Minimal
- FEMA flood zone
- X (unshaded)
- Chance of flooding over 30 yrs
- 0.0%
- Est. flood insurance / yr
- $507 – $1,088
Fire risk 1/10 · Minimal
- Est. fire insurance / yr
- $906 – $1,684
Heat risk 5/10 · Moderate
- Hot days now (above 102°F)
- 7 days/yr
- Hot days in 30 yrs
- 18 days/yr
Wind risk 4/10 · Minor
- Chance of severe wind over 30 yrs
- 13.0%
Air-quality risk 2/10 · Minimal
- Unhealthy air days now
- 1 days/yr
- Unhealthy air days in 30 yrs
- 1 days/yr
Risk factors via First Street. Map © Google.
Why this score? — see what drove the D grade
The composite is a weighted blend of 9 inputs, each scored 0–100. Each bar is that input's sub-score; the figure is the points it added to the 100-point composite (weight × sub-score).
- Cash flow +11.6/30.0
- ARV discount +9.8/15.0
- Livability +4.0/5.0
- Rent growth +3.9/5.0
- Schools +3.6/10.0
- DSCR +3.4/10.0
- 1% rule +2.8/10.0
- Condition / age +2.5/5.0
- Appreciation +0.0/10.0
$232,500
🖨 Deal sheet (PDF) 📄 Offer letter ✓ Due diligence
Listing remarks MLS
Updated 2 bedroom/2.5 bathroom townhome with open floor plan. The main level boasts luxury vinyl plank. Fantastic kitchen: granite countertops, pantry, island with breakfast bar. Great entertaining space. Two bedroom suites upstairs, both with vaulted ceilings and walk-in closets. Located at the back of the community. Community pool. This charming townhouse is located minutes away from major shopping centers on Highwoods Blvd and Battleground Ave. Easy access to Bryan Blvd and 220. A MUST SEE!!
Key facts
- New flooring
- New commodes
- New sinks
Tags
Property features AI
Finance
- Other: Directions: Bryan Blvd to New Garden Rd to Horse Pen Creek; community next to St Paul the Apostle Church
- HOA & community: Association: Greensboro; Subdivision: Keswick Place
Exterior
- Parking: Lighted parking
- Utilities: Public water; Public sewer; Electric water heater
- Home design: Townhouse; Stick/Site built residential property; Two levels; Built in 2001
- Construction: Brick and vinyl siding exterior; Slab foundation
- Exterior features: Community pool; Private maintained road; Lot approximately 0.02 acres
Interior
- Kitchen: Microwave; Dishwasher; Free-standing range
- Bedrooms: 5 total rooms (bedroom count not specified)
- Bathrooms: 2 full bathrooms; 1 half bathroom
- Heating & cooling: Central air conditioning; Forced air heating; Natural gas heating
- Interior features: Living room fireplace
- Laundry & utility: Electric water heater
Neighborhood map
What this means for you Summary
Snapshot
- This is a 2-bed/2.5-bath townhouse listed at $232k.
Deal economics
- At list price, monthly cash flow is $-71 ($-851/yr) — negative.
- To cash-flow at today's rent, offer at most $220k (5.4% below list).
- To meet the 1% rule (rent ≥ 1% of price), the offer needs to be $182k (21.6% below list).
- Recommended offer: $182k (21.6% below list) — sets the bar for 1% rule.
- Cap rate 5.9% vs local median 3.8% in Greensboro — top-decile yield for the area; either an underpriced asset or a hidden risk that comps aren't pricing in. Stress-test before assuming the spread holds.
Location & tenants
- Location reads 81/100 on livability (#12 in NC, #1,335 nationally) — a professional / high-income tenant draw. Strengths: amenities A+, commute A+, cost of living A+; Watch: employment D, crime F.
- Guilford County Schools (urban): math 39% / reading 45% proficiency, ranked #99 of 178 in NC (top 56%) — families likely to look elsewhere, expect single-tenant / working-renter base with shorter leases.
- Market conditions: Rents rising fast (+5.6%/yr); 324 active listings in the ZIP; 10 comparable units currently listed for rent nearby; rentals at typical pace (median 16d on market — plan ~3-4 weeks tenant-placement turnaround); solid renter incomes; 3,843 units permitted in Guilford County in 2024 (2,397 in 5+ unit buildings).
Forward outlook
- Local home prices are declining (-3.0%/yr); year-one equity from $2k of loan paydown is wiped out by about $7k of value loss. Plan a longer hold.
- Guilford County population projected at +26% by 2050 — long-run rental-demand tailwind backs the buy-and-hold thesis.
Negotiation context
- Only 1 days on market — expect competitive offers; lowballing is unlikely to land.
- 5 sale attempts since 13y ago with the ask held roughly flat each time — persistent listings suggest the price (not the market) is what's stuck; bring a comps-based counter.
- Current owner paid $128k; list at $232k implies a 81% gain — meaningful room to come down on a strong offer.
Risks & watch-outs
- Climate carrying-cost: extreme-heat days projected 7→18/yr by 2055 (HVAC capex compounding) — expect insurance premiums to compound above CPI over the hold.
Questions for the listing agent
- What do current leases actually rent for vs. the listed asking? Can we see a recent rent roll and the last 12 months of T-12 income?
- Is there a deadline driving the sale (1031 exchange, divorce, estate, relocation)? That informs how much negotiation room exists.
- Crime grade is F in this area — have there been break-ins, vandalism, or insurance claims at this property in the last 3 years? What carrier currently insures it and at what premium?
- The area grade is low — what's the realistic commute time and amenity access for the typical tenant pool here? Any planned neighborhood developments (good or bad) we should know about?
- What's the average days-on-market for RENTAL listings here right now (not sales)? A rising rental-DOM trend means longer vacancies and softer asking-rent achievability than the comps imply.
- What's the recent tenant-quality profile in this submarket — average credit score on applications, eviction rate, late-payment / NSF rate, and stable-employment percentage? A property-management company in the area should have these aggregated.
- How much new for-sale + rental construction is in the pipeline within 1–3 miles? Heavy new supply typically softens prices + rents 12–24 months out; constrained supply supports both.
Investment metrics
- 1% rule
- 0.78% ✗
- Cap rate
- 5.93%
- Cash-on-cash
- -1.31%
- DSCR
- 0.94
- GRM
- 10.6
CMA / ARV
- ARV (on-the-fly)
- $245,152
- Comps found
- 12
Show comp detail 12 sales within ~0.75 mi
| Address | Dist | Beds/Ba | Sqft | Sold | Price | $/sf | Match |
|---|---|---|---|---|---|---|---|
| 4551 Cross Ridge Ln | 0.08mi | 2/2.5 | 1,304 (0%) | 4mo | $225,000 | $173 | 93 |
| 2703 Spring Bridge Trl | 0.23mi | 2/2.0 | 1,303 (-0%) | 4mo | $295,000 | $226 | 84 |
| 4421 Lake Walk Dr | 0.30mi | 2/2.0 | 1,296 (-1%) | 2mo | $295,000 | $228 | 82 |
| 2703 N Keswick Way | 0.33mi | 2/2.5 | 1,296 (-1%) | 6mo | $244,000 | $188 | 79 |
| 2707 Spring Bridge Trl | 0.24mi | 2/2.0 | 1,278 (-2%) | 7mo | $300,000 | $235 | 78 |
| 47 Tannenbaum Cir | 0.45mi | 2/2.5 | 1,300 (-0%) | 2mo | $220,000 | $169 | 77 |
| 1923 Haven Rd | 0.37mi | 2/2.5 | 1,324 (+2%) | 6mo | $190,000 | $144 | 75 |
| 150 Tannenbaum Cir | 0.47mi | 2/2.5 | 1,275 (-2%) | 1mo | $223,000 | $175 | 74 |
| 142 Tannenbaum Cir | 0.47mi | 2/2.5 | 1,270 (-3%) | 2mo | $221,000 | $174 | 72 |
| 25 Tannenbaum Cir | 0.42mi | 2/2.0 | 1,374 (+5%) | 4mo | $230,000 | $167 | 66 |
| 4212 Sullivans Lake Dr | 0.48mi | 2/2.0 | 1,371 (+5%) | 1mo | $260,000 | $190 | 66 |
| 2607 Spring Bridge Cir | 0.23mi | 2/2.0 | 1,464 (+12%) | 5mo | $290,000 | $198 | 63 |
Match score weights: distance 35% · size 25% · config 20% · recency 20%. Top-matched comps best support the ARV.
Projected returns pro-forma
-3.0% appreciation · 5.57% rent growth · sell at horizon
- IRR
- -15.8%
- Equity multiple
- 0.43×
- Total profit
- $-37,387
- Equity at exit
- $34,667
- IRR
- -3.7%
- Equity multiple
- 0.73×
- Total profit
- $-17,585
- Equity at exit
- $20,102
Cash invested: $65,100 (down + closing). Projections, not guarantees.
Landlord ↔ Tenant lean methodology
- Overall (STATE)
- 85 Strongly Landlord-Friendly
- State North Carolina
- 85 Strongly Landlord-Friendly · R+3
- County
- — inherits STATE
- City
- — inherits STATE
ZIP-level market 27410
- Rents YoY
- 5.6%
- Active inventory
- 324
- Price-to-rent
- 10.6×
Monthly cashflow live
- Estimated rent
- $1,823 high interval (Pro) →
- Mortgage (P&I)
- −$1,219
- Tax from tax record
- −$195 /mo · $2,338/yr
- Insurance
- −$97
- HOA
- −$0
- Vacancy / Maint / Mgmt
- −$383
- Net cashflow
- $-71
Break-even live
Sensitivity live
| Price | -10% $61 | -5% $-5 | +0% $-71 | +5% $-137 | +10% $-203 |
|---|---|---|---|---|---|
| Rent | -10% $-215 | -5% $-143 | +0% $-71 | +5% $1 | +10% $73 |
| Rate | -1.0pp $46 | -0.5pp $-12 | base $-71 | +0.5pp $-131 | +1.0pp $-192 |
UW: 25.0% down · 7.5% · 30yr · 1.5% tax · 5.0% vac · 8.0% maint · 8.0% mgmt
Financing live
Cash to close
- Down payment
- $58,125
- Closing costs
- $6,975
- Reserves months
- —
- Total cash needed
- —
Loan-product check · same deal, 3 products live
Conventional
25% down · 7.5% · 30yr
- Down + closing
- —
- Monthly P&I
- —
- Monthly cashflow
- —
- DSCR
- —
- Eligible?
- —
Personal DTI + credit; lowest rate.
DSCR
20% down · 8.5% · 30yr
- Down + closing
- —
- Monthly P&I
- —
- Monthly cashflow
- —
- DSCR
- —
- Eligible?
- —
No personal income docs; deal must DSCR.
Hard money
10% down · 12.0% · 12mo
- Down + closing
- —
- Monthly P&I
- —
- Monthly cashflow
- —
- DSCR
- —
- Eligible?
- —
Short-term bridge; refi at stabilization.
Rent comps 10 comps
| Address | Beds | Baths | Sqft | Rent | $/sqft | DOM | Units | Dist |
|---|---|---|---|---|---|---|---|---|
| 1815 New Bedford Dr Greensboro, NC | 3.0 | 2.0 | 1212 | $1,825 | $1.51 | 20d | 1 | 0.11mi |
| 4126 Macbeth ST Greensboro, NC | 3.0–4.0 | 2.5–3.5 | 1917 | $2,644 | $1.38 | 25d | 24 | 0.27mi |
| 1509 New Garden Rd Greensboro, NC | 1.0–3.0 | 1.0–2.0 | 1060 | $1,505 | $1.42 | 15d | 15 | 0.37mi |
| 12 Tannenbaum Cir Unit 1 Greensboro, NC | 3.0 | 2.5 | 1355 | $1,850 | $1.37 | 25d | 1 | 0.48mi |
| 5856 Old Oak Ridge Rd Greensboro, NC | 1.0–2.0 | 1.0–2.0 | 1033 | $1,457 | $1.41 | 15d | 17 | 1.23mi |
| 3611 Bridleton Ridge Trl Greensboro, NC | 3.0 | 2.5 | 1637 | $2,350 | $1.44 | 15d | 1 | 1.34mi |
| 5817 Garden Village Ct Greensboro, NC | 1.0–2.0 | 1.0–2.0 | 1093 | $2,119 | $1.94 | 15d | 7 | 1.37mi |
| 907 Elderberry Way Greensboro, NC | 3.0 | 2.5 | 1618 | $1,995 | $1.23 | 25d | 1 | 1.37mi |
| 5855 Old Oak Ridge Rd Greensboro, NC | 1.0–2.0 | 1.0–2.5 | 745 | $1,509 | $2.03 | 15d | 23 | 1.43mi |
| 1921 New Garden Rd Greensboro, NC | 1.0–3.0 | 1.0–2.0 | 993 | $1,441 | $1.45 | 15d | 8 | 1.48mi |
Listing history 2 events
-
2026-06-17remarks 697-char remark
-
2026-06-17$232,500 Active 1 DOM
ⓘ Source: listings_history table (triggers on properties + properties_extension) + one-shot
backfill from property_details.listing_events for pre-trigger history.
Tax reassessment forecast NC · Resets to sale price
- Current annual tax
- $2,338 · $195/mo
- Projected year-2 tax
- $2,338 · $195/mo
- Expected delta
- $0/yr ($0/mo · 0.0%)
ⓘ Screening estimate from a state-policy table — verify with the county assessor before closing.
Climate risk First Street
- Flood 1/10 Low FEMA zone X (unshaded) · 0% chance over 30 yrs
- Wildfire 1/10 Low
- Heat 5/10 Major 7 d/yr ≥102°F today · 18 d/yr by 30 yrs out
- Wind 4/10 Moderate 13% chance of damaging wind over 30 yrs
- Air quality 2/10 Low 1 unhealthy d/yr today · 1 by 30 yrs out
Nearby sold comps map
Loading sold comps map…
Walkable amenities ~0.75 mi
Loading nearby amenities…
Taxation est. · year 1
- Rental income
- $21,874
- − Mortgage interest
- −$13,024
- − Property taxes
- −$2,338
- − Insurance
- −$1,162
- − Repairs & maintenance
- −$1,750
- − Management
- −$1,750
- − Depreciation
- −$6,764
- Taxable loss
- −$4,913
- Est. tax savings @ 24.0%
- +$1,179
- After-tax cash flow
- $328/yr
For passive investors: Depreciation is non-cash, so a rental often shows a tax loss while cash-flowing — sheltering income. Rental losses are passive: they offset passive income freely, and up to $25,000/yr can offset ordinary (W-2) income if you actively participate and your MAGI is under $100k (phasing out to $0 by $150k); unused losses carry forward. On sale, claimed depreciation is recaptured at up to 25%, and gains may owe capital-gains tax (a 1031 exchange can defer both). Figures are a year-1 estimate at your 24.0% rate — not tax advice; consult a CPA.
Schools (NCES district)
- District
- Guilford County Schools
- NCES district ID
- 3701920
- Math proficiency
- 39% ▲ 1.00%
- Reading proficiency
- 45% ▲ 1.00%
- Median HH income
- $46,315
- Composite
- 35.78/100
- National rank
- #4842
- State rank
- #99 of 178 in NC
Livability — Greensboro
- Score
- 81/100
- State rank
- #12
- US rank
- #1335
Category grades
Schools grade is shown separately in the Schools card above.
Census & demographics
- Census place
- Greensboro, NC
- County
- Guilford County · 487,190 people
- City population
- 329,421
- Metro
- Greensboro-High Point, NC
- Population (ZIP)
- 54,921
- Household income
- $85,291
- Rent vs Own
- Severe rent burden
- 2696.0
Population outlook (Guilford County) Hauer SSP2
- Today (2025)
- 584,596 people
- By 2030
- 616,851 · +5.5%
- By 2040
- 678,451 · +16.1%
- By 2050
- 734,788 · +25.7%
- By 2075
- 862,985 · +47.6%
- By 2100
- 948,704 · +62.3%
Race, ethnicity, and origin ACS 2023
- Neighborhood character
- Predominantly White (68%)
- Race & ethnicity
- White 68% Black 15% Two or more races 8% Hispanic / Latino 7% Asian 5%
- Hispanic origin (detail)
- Mexican 2% Puerto Rican 2%
- Common ancestry
- Italian 3% Serbian 3% Slovak 3%
- Foreign-born
- 11% · Canada, South Korea, China
- Languages at home
- 86% English-only · Spanish 4% Other Indo-European 3% Other Asian/Pacific 1%
Political lean MEDSL · Guilford
- 2024 margin
- Strong D (+21.8) · D 60.2% · R 38.4% · Other 1.4%
- 2008→2024 swing
- +3.5pp toward D · 2008: 18.4pp · 2024: 21.8pp
- All cycles
- 2024: D+21.8 2020: D+23.1 2016: D+20.0 2012: D+16.5 2008: D+18.4
Not yet ingested
- Civics
- —
Market trends
- HPI YoY
- ▼ -245.81%
- Current HPI
- 222.1685
- Rent YoY
- ▲ 5.57%
- Metro
- Greensboro-High Point, NC
- State GDP YoY
- ▲ 3.28%
- F500 in state
- 26
Industry mix (Fortune 500 HQ in NC)
| Industry | F500 HQs | Revenue |
|---|---|---|
| Financial Services | 2 | $213B |
|
||
| Retail | 2 | $95B |
|
||
| Industrial Conglomerate | 1 | $38B |
|
||
| Metals / Steel | 1 | $35B |
|
||
| Utilities | 1 | $30B |
|
||
| Industrial Machinery | 1 | $19B |
|
||
Price history
+158.3% since first listed13 events — show timeline
- 2026-06-17 Listed $232,500 Triad MLS
- 2026-06-09 Rental Removed $1,600 TRIADMLS
- 2026-04-18 Listed for Rent $1,600 TRIADMLS
- 2026-04-12 Rental Removed $1,600 TRIADMLS
- 2026-02-16 Listed for Rent $1,600 TRIADMLS
- 2019-07-31 Sold (Public Records) $128,500 Public Records
- 2019-07-31 Sold (MLS) $128,500 Triad MLS
- 2019-07-13 Pending — Triad MLS
- 2019-06-28 Contingent — Triad MLS
- 2019-06-26 Listed $125,000 Triad MLS
- 2016-07-29 Sold (Public Records) $106,000 Public Records
- 2013-06-19 Sold (MLS) $90,000 Triad MLS
- 2013-04-15 Listed $90,000 Triad MLS
Property tax history
+4.2%/yrLatest (2025): $2,338 · -1.0% YoY. Source: county tax records.
Cash-flow waterfall
monthlySold comps — $/sqft
last 12 mo · ≤1 miLoading sold comps…