 🏢 Co-op
900 SW 10th Ter Unit 2s · Hallandale Beach, FL
Flood risk 5/10 · Moderate
- FEMA flood zone
- X (shaded)
- Chance of flooding over 30 yrs
- 0.26%
- Est. flood insurance / yr
- $507 – $1,088
Fire risk 1/10 · Minimal
- Est. fire insurance / yr
- $947 – $1,759
Heat risk 10/10 · Severe
- Hot days now (above 104°F)
- 6 days/yr
- Hot days in 30 yrs
- 22 days/yr
Wind risk 10/10 · Severe
- Chance of severe wind over 30 yrs
- 99.0%
Air-quality risk 2/10 · Minimal
- Unhealthy air days now
- 2 days/yr
- Unhealthy air days in 30 yrs
- 2 days/yr
Risk factors via First Street. Map © Google.
Why this score? — see what drove the C- grade
The composite is a weighted blend of 9 inputs, each scored 0–100. Each bar is that input's sub-score; the figure is the points it added to the 100-point composite (weight × sub-score).
- Cash flow +18.6/30.0
- 1% rule +9.4/10.0
- ARV discount +7.5/15.0
- DSCR +5.8/10.0
- Schools +4.1/10.0
- Livability +4.0/5.0
- Rent growth +2.6/5.0
- Condition / age +2.5/5.0
- Appreciation +0.0/10.0
$144,900
🖨 Deal sheet 📄 Offer letter ✓ Due diligence
Listing remarks
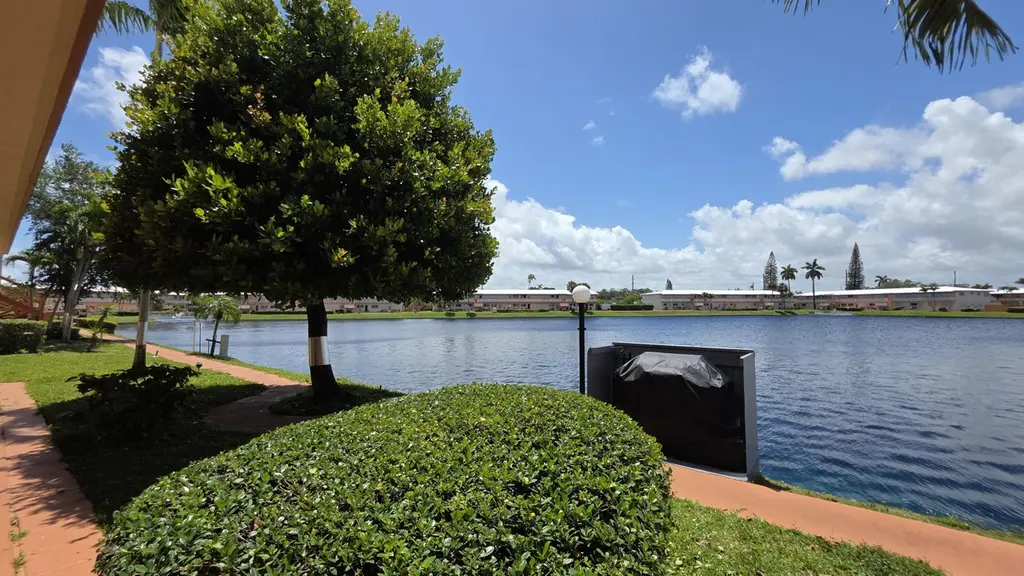
This lakefront unit in the Rolen Lakes 55+ co-op community offers a perfect blend of comfort and scenic beauty. Move-in ready and fully furnished, this 2-bedroom, 1-bathroom home is designed for easy South Florida living. The interior features two split A/C systems for efficient cooling and is protected by impact windows and additional shutters for peace of mind. Enjoy stunning western exposures from your back porch, providing front-row seats to vibrant evening sunsets. A magnificent mature tree sits just off the porch, offering natural shade that keeps the outdoor living space cool and inviting. Convenience is key: the unit is located steps away from the community BBQ area and laundry faci
Key facts
- Community bbq area
- Laundry facilities
- Lakefront unit
Tags
Property features AI
Finance
- Financial info: Land lease in effect (land lease expires 2061-04-01)
- HOA & community: Association with monthly fee; Monthly association fee covers insurance, grounds and structure maintenance, sewer, trash, water, common areas, roof repairs, recreation facility and pool service; Community amenities include clubhouse, pool, picnic area, parking, shuffleboard court and library; Senior community; Pets not allowed
Exterior
- Parking: 1 parking space; Guest parking available
- Security: Smoke detector(s); Other security features
- Utilities: Public water; Public sewer; Cable available
- Home design: Stock cooperative; One level; Resale; Faces west
- Construction: Built with stucco and concrete block (CBS); Tile roof; 2 total stories (building)
- Exterior features: Open patio; Open porch; Patio and porch areas; Waterfront (no specific waterfront features listed)
Interior
- Kitchen: Dishwasher; Electric range; Gas range; Microwave; Refrigerator; Electric water heater
- Bedrooms: 2 bedrooms on the main level
- Flooring: Ceramic tile
- Bathrooms: 1 full bathroom on the main level
- Heating & cooling: Heat pump; Window/wall heating; Ductless cooling; Wall/window units; Ceiling fans
- Interior features: Walk-in closets; Drapes, rods and shutters on windows; Furnished
- Laundry & utility: Indoor laundry
Neighborhood map
What this means for you Summary
Snapshot
- This is a 2-bed/1.0-bath condo listed at $145k.
Deal economics
- At list price, monthly cash flow is $140 ($2k/yr) — positive.
- The deal already cash-flows at list — no discount required.
- Meets the 1% rule at list price ($2k rent vs $145k).
- Recommended offer: $136k (6.0% below list) — sets the bar for market timing.
- Cap rate 7.5% vs local median 5.2% in Hallandale Beach — top-decile yield for the area; either an underpriced asset or a hidden risk that comps aren't pricing in. Stress-test before assuming the spread holds.
Location & tenants
- Location reads 81/100 on livability (#86 in FL, #1,400 nationally) — a professional / high-income tenant draw. Strengths: commute A+, health & safety A+, crime B+; Watch: employment D-.
- Broward (suburban): math 42% / reading 53% proficiency, ranked #46 of 73 in FL (top 63%) — families likely to look elsewhere, expect single-tenant / working-renter base with shorter leases.
- Zoned schools: Gulfstream Academy of Hallandale Beach (math 32% / reading 40%, grade F, #1,670 of 2,144 statewide, top 78%, 1,317 students, 73% FRL); Hallandale High School (math 10% / reading 24%, grade F, #597 of 667 statewide, top 90%, 1,104 students, 70% FRL) — zoned schools average 71% FRL vs 51% district-wide (20 pts higher); higher-poverty schools than district average — tighter screening recommended.
- Zoned-school proficiency averages 26% at this address vs 48% district-wide (-21 pts) — the specific schools serving this property underperform the Broward average; the district grade overstates school quality for this exact location.
- Market conditions: Rents flat; 1373 active listings in the ZIP; 19 comparable units currently listed for rent nearby; rentals at typical pace (median 24d on market — plan ~3-4 weeks tenant-placement turnaround); 2,111 units permitted in Broward County in 2024 (1,265 in 5+ unit buildings).
- At $2,080/mo this rent would consume 48% of the median local household income ($52k/yr) (locally 3293% of renters already pay >50% of income on rent) — very limited rent-growth headroom before tenants either downsize or default.
Forward outlook
- Local home prices are declining (-3.0%/yr); year-one equity from $1k of loan paydown is wiped out by about $4k of value loss. Plan a longer hold.
- Broward County population projected at +34% by 2050 — long-run rental-demand tailwind backs the buy-and-hold thesis.
Negotiation context
- It's been on market 66 days — a 6% lower offer ($136k) is reasonable based on typical stale-listing flexibility.
Risks & watch-outs
- Watch-outs: HOA is 23% of rent.
- Climate carrying-cost: moderate flood risk; severe wind risk, 99% chance of damaging wind over 30y; extreme-heat days projected 6→22/yr by 2055 (HVAC capex compounding) — expect insurance premiums to compound above CPI over the hold.
Questions for the listing agent
- It's been on market 66 days. Have you received any prior offers? Is the seller open to a 6% concession, seller financing, or rate buy-down credit?
- Built in 1962 — when were the roof, HVAC, electrical panel, plumbing, and water heater last replaced?
- What does the HOA fee cover, when was the last increase, and are there any pending special assessments or reserve-fund shortfalls?
- Any open or pending special assessments — roof, HVAC, plumbing, elevator, façade? What's the per-unit balance and payoff schedule, and is the seller paying it off at close or rolling it to the buyer?
- Why hasn't it sold? Are there any deal-killer items the seller is aware of (foundation, flood, title, zoning, code violations)?
- Is there a deadline driving the sale (1031 exchange, divorce, estate, relocation)? That informs how much negotiation room exists.
- This sits on a lake — are riparian / water-frontage rights deeded with the parcel? Any dock permits, shoreline easements, or HOA water-use restrictions?
- What's the documented flood / surge / shoreline-erosion history here (FEMA AND non-FEMA — e.g., storm surge, creek backup, septic-field saturation)?
- Any water-quality or seasonal algae-bloom issues that affect tenant satisfaction or short-term-rental demand?
- What's the average days-on-market for RENTAL listings here right now (not sales)? A rising rental-DOM trend means longer vacancies and softer asking-rent achievability than the comps imply.
- What's the recent tenant-quality profile in this submarket — average credit score on applications, eviction rate, late-payment / NSF rate, and stable-employment percentage? A property-management company in the area should have these aggregated.
- How much new apartment / multifamily construction is in the pipeline within 1–3 miles? Heavy new supply (>2% of stock underway) typically softens rents 12–24 months out; light construction supports rent growth.
Investment metrics
- 1% rule
- 1.44% ✓
- Cap rate
- 7.45%
- Cash-on-cash
- 4.14%
- DSCR
- 1.18
- GRM
- 5.8
CMA / ARV
No comps found within radius.
Projected returns pro-forma
-3.0% appreciation · 0.43% rent growth · sell at horizon
- IRR
- -13.8%
- Equity multiple
- 0.52×
- Total profit
- $-19,468
- Equity at exit
- $21,605
- IRR
- -12.2%
- Equity multiple
- 0.40×
- Total profit
- $-24,530
- Equity at exit
- $12,528
Cash invested: $40,572 (down + closing). Projections, not guarantees.
Landlord ↔ Tenant lean methodology
- Overall (STATE)
- 87 Strongly Landlord-Friendly
- State Florida
- 87 Strongly Landlord-Friendly · R+3
- County
- — inherits STATE
- City
- — inherits STATE
ZIP-level market 33009
- Rents YoY
- 0.4%
- Active inventory
- 1373
- Price-to-rent
- 5.8×
Monthly cashflow live
- Estimated rent
- $2,080 high interval (Pro) →
- Mortgage (P&I)
- −$760
- Tax from tax record
- −$214 /mo · $2,569/yr
- Insurance
- −$60
- HOA
- −$469
- Vacancy / Maint / Mgmt
- −$437
- Net cashflow
- $140
Break-even live
UW: 25.0% down · 7.5% · 30yr · 1.5% tax · 5.0% vac · 8.0% maint · 8.0% mgmt
Financing live
Cash to close
- Down payment
- $36,225
- Closing costs
- $4,347
- Reserves months
- —
- Total cash needed
- —
Loan-product check · same deal, 3 products live
Conventional
25% down · 7.5% · 30yr
- Down + closing
- —
- Monthly P&I
- —
- Monthly cashflow
- —
- DSCR
- —
- Eligible?
- —
Personal DTI + credit; lowest rate.
DSCR
20% down · 8.5% · 30yr
- Down + closing
- —
- Monthly P&I
- —
- Monthly cashflow
- —
- DSCR
- —
- Eligible?
- —
No personal income docs; deal must DSCR.
Hard money
10% down · 12.0% · 12mo
- Down + closing
- —
- Monthly P&I
- —
- Monthly cashflow
- —
- DSCR
- —
- Eligible?
- —
Short-term bridge; refi at stabilization.
Rent comps 19 comps
| Address | Beds | Baths | Sqft | Rent | $/sqft | DOM | Units | Dist |
|---|---|---|---|---|---|---|---|---|
| 900 SW 11th Ave Unit 17C Hallandale Beach, FL | 1.0 | 1.0 | 625 | $1,600 | $2.56 | 24d | 1 | 0.09mi |
| 920 SW 11th Ave Unit 11D Hallandale Beach, FL | 2.0 | 1.0 | 848 | $1,695 | $2.00 | 24d | 1 | 0.11mi |
| 280 SW 11th Ave #5 Hallandale Beach, FL | 1.0 | 1.0 | 580 | $1,475 | $2.54 | 24d | 1 | 0.39mi |
| 1033 SW 3rd St Hallandale Beach, FL | 2.0 | 1.0 | 875 | $2,800 | $3.20 | 24d | 1 | 0.39mi |
| 230 SW 11th Ave #17 Hallandale Beach, FL | 1.0 | 1.0 | 580 | $1,390 | $2.40 | 3d | 1 | 0.43mi |
| 1056 SW 2nd St Unit 1056 Hallandale Beach, FL | 3.0 | 2.0 | 1000 | $3,300 | $3.30 | 24d | 1 | 0.45mi |
| 220 SW 9th Ave Hallandale Beach, FL | 1.0–2.0 | 1.0–2.0 | 771 | $2,200 | $2.85 | 20d | 2 | 0.52mi |
| 220 SW 9th Ave #516 Hallandale Beach, FL | 2.0 | 2.0 | 918 | $2,200 | $2.40 | 24d | 1 | 0.53mi |
| 220 SW 9th Ave #219 Hallandale Beach, FL | 1.0 | 1.0 | 625 | $1,550 | $2.48 | 4d | 1 | 0.53mi |
| 829 SW 1st St Hallandale Beach, FL | 2.0 | 2.0 | 850 | $1,985 | $2.34 | 24d | 1 | 0.60mi |
| 3001 SW 35th Ave West Park, FL | 2.0 | 1.0 | 1050 | $2,400 | $2.29 | 16d | 1 | 0.99mi |
| 90 SW 3rd St Unit 2400 Hallandale Beach, FL | 2.0 | 2.0 | 1079 | $3,700 | $3.43 | 24d | 1 | 1.00mi |
| 215 SE 5th St Hallandale Beach, FL | 2.0–3.0 | 2.0 | 1133 | $2,700 | $2.38 | 24d | 5 | 1.18mi |
| 1041 NW 7th Ct Unit 2 Hallandale Beach, FL | 1.0 | 1.0 | 600 | $1,550 | $2.58 | 24d | 1 | 1.25mi |
| 4141 SW 32nd Dr West Park, FL | 3.0 | 1.0 | 1048 | $2,700 | $2.58 | 7d | 1 | 1.28mi |
| 4141 SW 32nd Dr West Park, FL | 3.0 | 1.0 | 1048 | $2,700 | $2.58 | 24d | 1 | 1.28mi |
| 832 NW 10th St Unit 1 Hallandale Beach, FL | 2.0 | 1.0 | 800 | $1,800 | $2.25 | 24d | 1 | 1.33mi |
| 1046 Foster Rd Hallandale Beach, FL | 2.0 | 1.0 | 750 | $1,795 | $2.39 | 7d | 1 | 1.34mi |
| 4030 SW 28th St West Park, FL | 2.0 | 1.0 | 800 | $2,400 | $3.00 | 22d | 1 | 1.39mi |
HOA detail condo
- Monthly dues
- $469 · $5,628/yr
- Assessments
- None detected in remarks — confirm with the listing agent.
Listing history 14 events
-
2026-06-18days on market $144,900 Active 66 DOM
-
2026-06-17days on market $144,900 Active 65 DOM
-
2026-06-16days on market $144,900 Active 64 DOM
-
2026-06-15days on market $144,900 Active 63 DOM
-
2026-06-13days on market $144,900 Active 61 DOM
-
2026-06-09days on market $144,900 Active 57 DOM
-
2026-06-08days on market $144,900 Active 56 DOM
-
2026-06-07days on market $144,900 Active 55 DOM
-
2026-06-04days on market $144,900 Active 52 DOM
-
2026-06-03days on market $144,900 Active 51 DOM
-
2026-06-02days on market $144,900 Active 50 DOM
-
2026-06-01days on market $144,900 Active 49 DOM
-
2026-05-31days on market $144,900 Active 48 DOM
-
2026-04-13$144,900 Active
ⓘ Source: listings_history table (triggers on properties + properties_extension) + one-shot
backfill from property_details.listing_events for pre-trigger history.
Tax reassessment forecast FL · Resets to sale price
- Current annual tax
- $2,569 · $214/mo
- Projected year-2 tax
- $2,569 · $214/mo
- Expected delta
- $0/yr ($0/mo · 0.0%)
ⓘ Screening estimate from a state-policy table — verify with the county assessor before closing.
Climate risk First Street
- Flood 5/10 Major FEMA zone X (shaded) · 26% chance over 30 yrs
- Wildfire 1/10 Low
- Heat 10/10 Extreme 6 d/yr ≥104°F today · 22 d/yr by 30 yrs out
- Wind 10/10 Extreme 99% chance of damaging wind over 30 yrs
- Air quality 2/10 Low 2 unhealthy d/yr today · 2 by 30 yrs out
Nearby sold comps map
Loading sold comps map…
Walkable amenities ~0.75 mi
Loading nearby amenities…
Taxation est. · year 1
- Rental income
- $24,962
- − Mortgage interest
- −$8,117
- − Property taxes
- −$2,569
- − Insurance
- −$724
- − Repairs & maintenance
- −$1,997
- − Management
- −$1,997
- − HOA
- −$5,628
- − Depreciation
- −$4,215
- Taxable loss
- −$285
- Est. tax savings @ 24.0%
- +$68
- After-tax cash flow
- $1,749/yr
For passive investors: Depreciation is non-cash, so a rental often shows a tax loss while cash-flowing — sheltering income. Rental losses are passive: they offset passive income freely, and up to $25,000/yr can offset ordinary (W-2) income if you actively participate and your MAGI is under $100k (phasing out to $0 by $150k); unused losses carry forward. On sale, claimed depreciation is recaptured at up to 25%, and gains may owe capital-gains tax (a 1031 exchange can defer both). Figures are a year-1 estimate at your 24.0% rate — not tax advice; consult a CPA.
Schools (NCES district)
- District
- Broward
- NCES district ID
- 1200180
- Math proficiency
- 42% ▼ -18.00%
- Reading proficiency
- 53% ▼ -5.00%
- Median HH income
- $52,139
- Composite
- 40.88/100
- National rank
- #3621
- State rank
- #46 of 73 in FL
Livability — Hallandale Beach
- Score
- 81/100
- State rank
- #86
- US rank
- #1400
Category grades
Schools grade is shown separately in the Schools card above.
Census & demographics
- Census place
- Hallandale Beach, FL
- County
- Broward County · 1,963,430 people
- City population
- 44,021
- Metro
- Miami-Fort Lauderdale-Pompano Beach, FL
- Population (ZIP)
- 44,502
- Household income
- $52,079
- Rent vs Own
- Severe rent burden
- 3293.0
Population outlook (Broward County) Hauer SSP2
- Today (2025)
- 2,207,033 people
- By 2030
- 2,360,704 · +7.0%
- By 2040
- 2,661,208 · +20.6%
- By 2050
- 2,946,698 · +33.5%
- By 2075
- 3,602,273 · +63.2%
- By 2100
- 3,970,984 · +79.9%
Race, ethnicity, and origin ACS 2023
- Neighborhood character
- Diverse neighborhood (Simpson 0.67)
- Race & ethnicity
- Hispanic / Latino 39% White 39% Two or more races 24% Black 17% Asian 1%
- Hispanic origin (detail)
- Mexican 2% Puerto Rican 3% Cuban 9% Dominican 3% Salvadoran 2%
- Common ancestry
- Scotch-Irish 5% Hispanic 5% Subsaharan African 3%
- Foreign-born
- 51% · Canada, Jamaica, Dominican Republic
- Languages at home
- 38% English-only · Spanish 36% Russian/Polish/Slavic 12% French/Haitian/Cajun 7%
Political lean MEDSL · Broward
- 2024 margin
- D (+17.0) · D 58.0% · R 41.0%
- 2008→2024 swing
- -17.8pp toward R · 2008: 34.7pp · 2024: 17.0pp
- All cycles
- 2024: D+17.0 2020: D+29.8 2016: D+35.0 2012: D+34.9 2008: D+34.7
Not yet ingested
- Civics
- —
Market trends
- HPI YoY
- ▼ -299.13%
- Current HPI
- 329.9081
- Rent YoY
- ▲ 0.43%
- Metro
- Miami-Fort Lauderdale-Pompano Beach, FL
- State GDP YoY
- ▲ 3.28%
- F500 in state
- 36
Industry mix (Fortune 500 HQ in FL)
| Industry | F500 HQs | Revenue |
|---|---|---|
| Industrial Technology | 2 | $29B |
|
||
| Insurance | 2 | $17B |
|
||
| Retail | 1 | $60B |
|
||
| Technology Distribution | 1 | $58B |
|
||
| Homebuilding | 1 | $35B |
|
||
| Technology Manufacturing | 1 | $35B |
|
||
Price history
1 event — show timeline
- 2026-04-13 Listed $144,900 Beaches MLS
Property tax history
+5.1%/yrLatest (2025): $2,569 · +4.7% YoY. Source: county tax records.
Cash-flow waterfall
monthlySold comps — $/sqft
last 12 mo · ≤1 miLoading sold comps…