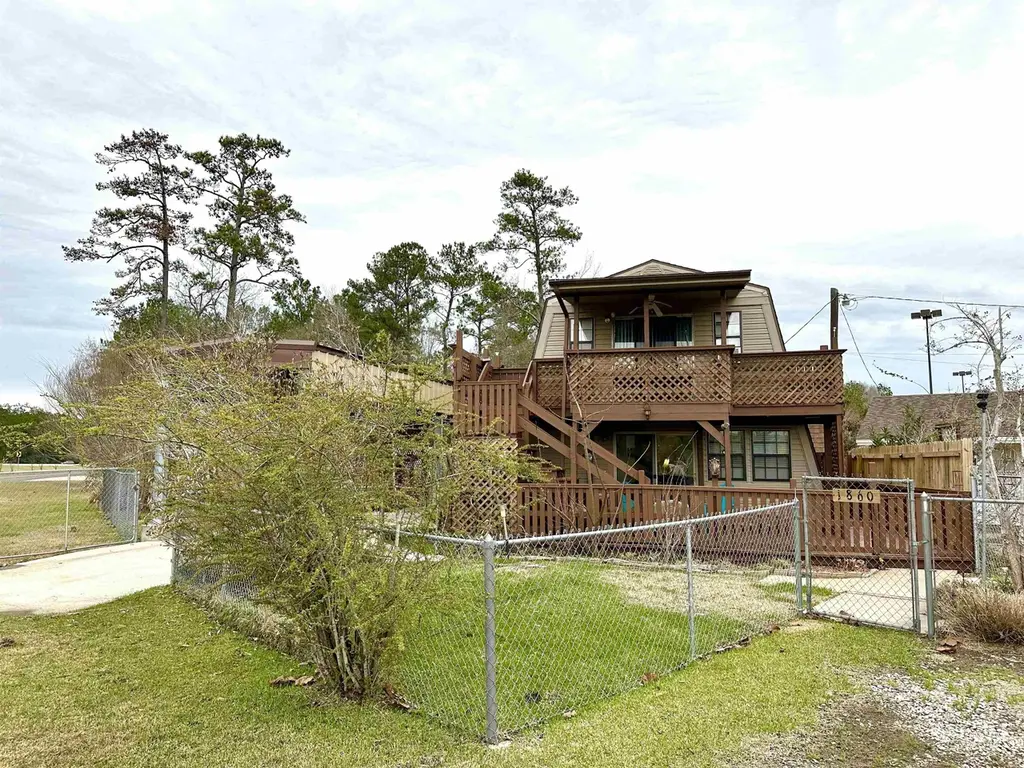
1860 S Hwy 96 · Lumberton, TX
Flood risk 8/10 · Major
- FEMA flood zone
- X (unshaded)
- Chance of flooding over 30 yrs
- 0.99%
- Est. flood insurance / yr
- $507 – $1,088
Fire risk 4/10 · Minor
- Est. fire insurance / yr
- $1,222 – $2,270
Heat risk 9/10 · Severe
- Hot days now (above 111°F)
- 7 days/yr
- Hot days in 30 yrs
- 25 days/yr
Wind risk 9/10 · Severe
- Chance of severe wind over 30 yrs
- 99.0%
Air-quality risk 2/10 · Minimal
- Unhealthy air days now
- 1 days/yr
- Unhealthy air days in 30 yrs
- 1 days/yr
Risk factors via First Street. Map © Google.
Why this score? — see what drove the D+ grade
The composite is a weighted blend of 9 inputs, each scored 0–100. Each bar is that input's sub-score; the figure is the points it added to the 100-point composite (weight × sub-score).
- Cash flow +16.1/30.0
- ARV discount +7.5/15.0
- DSCR +5.0/10.0
- 1% rule +4.4/10.0
- Schools +4.3/10.0
- Livability +3.8/5.0
- Rent growth +2.5/5.0
- Condition / age +2.5/5.0
- Appreciation +0.0/10.0
$239,900
🖨 Deal sheet (PDF) 📄 Offer letter ✓ Due diligence
Listing remarks
2 houses for the price of 1! This property would be a great investment opportunity to make 2 separate rental units from. Not only could you rent them to long term users but would also make a great Air BNB property. The A frame house offers 3 bedrooms and 2 baths each with standing shower stalls. The 12 x 45 foot RV cover could be used as a patio cover for weekend BBQ's or go ahead and park your RV in it, there are RV hookups available. There is a storage shed next to RV cover. The second home is single story 3 bedrooms, 1 bath with a large sunroom, galley kitchen and indoor utility room. These properties are located in the curve at the "Y" so very accessible to everything Lumbe
Key facts
- Storage shed
- Rv cover
- Air bnb property
Tags
Property features AI
Exterior
- Parking: Carport (1 space)
- Utilities: Public water; Public sewer; Cable available
- Home design: Single-family residence; Residential property
- Construction: Frame construction with vinyl siding; Composition roof
- Exterior features: Deck; Chain link fencing; Storage shed/structure; Public maintained road access (state road)
Interior
- Kitchen: Range
- Flooring: Carpet; Vinyl
- Bathrooms: 3 full bathrooms
- Heating & cooling: Central heating (electric); Central air; Ceiling fans
- Interior features: Breakfast bar
Neighborhood map
What this means for you Summary
Snapshot
- This is a 6-bed/3.0-bath single-family listed at $240k.
Deal economics
- At list price, monthly cash flow is $55 ($661/yr) — positive.
- The deal already cash-flows at list — no discount required.
- To meet the 1% rule (rent ≥ 1% of price), the offer needs to be $226k (5.9% below list).
- Recommended offer: $226k (5.9% below list) — sets the bar for 1% rule.
- Cap rate 6.9% vs local median 3.2% in Lumberton — top-decile yield for the area; either an underpriced asset or a hidden risk that comps aren't pricing in. Stress-test before assuming the spread holds.
Location & tenants
- Location reads 75/100 on livability (#160 in TX, #4,326 nationally) — a middle-class / working-renter tenant base. Strengths: crime A+, employment A+, cost of living A+; Watch: amenities F, commute F.
- Lumberton ISD (suburban): math 48% / reading 50% proficiency, ranked #173 of 826 in TX (top 21%) — families likely to look elsewhere, expect single-tenant / working-renter base with shorter leases.
- Zoned schools: Lumberton Pri (math 54% / reading 58%, grade C+, #574 of 4,322 statewide, top 14%, 982 students, 43% FRL); Lumberton Middle (math 47% / reading 51%, grade C-, #378 of 1,662 statewide, top 23%, 969 students, 35% FRL); Lumberton H S (math 55% / reading 61%, grade C, #320 of 1,632 statewide, top 20%, 1,229 students, 30% FRL).
- Market conditions: 318 active listings in the ZIP; solid renter incomes; 358 units permitted in Hardin County in 2024 (0 in 5+ unit buildings).
Forward outlook
- Local home prices are declining (-3.0%/yr); year-one equity from $2k of loan paydown is wiped out by about $7k of value loss. Plan a longer hold.
Negotiation context
- It's been on market 40 days — a 3% lower offer ($233k) is reasonable based on typical stale-listing flexibility.
Risks & watch-outs
- Watch-outs: flood insurance adds $66/mo.
- Climate carrying-cost: severe flood risk; severe wind risk, 99% chance of damaging wind over 30y; extreme-heat days projected 7→25/yr by 2055 (HVAC capex compounding) — expect insurance premiums to compound above CPI over the hold.
Questions for the listing agent
- It's been on market 40 days. Have you received any prior offers? Is the seller open to a 6% concession, seller financing, or rate buy-down credit?
- Built in 1973 — when were the roof, HVAC, electrical panel, plumbing, and water heater last replaced?
- What's the actual annual flood-insurance premium (NFIP or private), and is the property in a SFHA with mandatory coverage?
- Is there a deadline driving the sale (1031 exchange, divorce, estate, relocation)? That informs how much negotiation room exists.
- The area grade is low — what's the realistic commute time and amenity access for the typical tenant pool here? Any planned neighborhood developments (good or bad) we should know about?
- What's the average days-on-market for RENTAL listings here right now (not sales)? A rising rental-DOM trend means longer vacancies and softer asking-rent achievability than the comps imply.
- What's the recent tenant-quality profile in this submarket — average credit score on applications, eviction rate, late-payment / NSF rate, and stable-employment percentage? A property-management company in the area should have these aggregated.
- How much new for-sale + rental construction is in the pipeline within 1–3 miles? Heavy new supply typically softens prices + rents 12–24 months out; constrained supply supports both.
Investment metrics
- 1% rule
- 0.94% ✗
- Cap rate
- 6.90%
- Cash-on-cash
- 2.17%
- DSCR
- 1.10
- GRM
- 8.9
CMA / ARV
- ARV (median comp)
- $502,610
- List price
- $239,900
- Delta
- -52.27%
- Verdict
- UNDERPRICED
- Comps
- 6 within 1.0 mi
Projected returns pro-forma
-3.0% appreciation · 3.0% rent growth · sell at horizon
- IRR
- -14.7%
- Equity multiple
- 0.47×
- Total profit
- $-35,291
- Equity at exit
- $35,770
- IRR
- -6.0%
- Equity multiple
- 0.61×
- Total profit
- $-25,904
- Equity at exit
- $20,742
Cash invested: $67,172 (down + closing). Projections, not guarantees.
Landlord ↔ Tenant lean methodology
- Overall (STATE)
- 87 Strongly Landlord-Friendly
- State Texas
- 87 Strongly Landlord-Friendly · R+5
- County
- — inherits STATE
- City
- — inherits STATE
ZIP-level market 77657
- Active inventory
- 318
- Price-to-rent
- 8.9×
Monthly cashflow live
- Estimated rent
- $2,257 medium interval (Pro) →
- Mortgage (P&I)
- −$1,258
- Tax from tax record
- −$303 /mo · $3,641/yr
- Insurance
- −$100
- Flood insurance flood zone
- −$66 /mo · $798/yr
- HOA
- −$0
- Vacancy / Maint / Mgmt
- −$474
- Net cashflow
- $55
Break-even live
Sensitivity live
| Price | -10% $191 | -5% $123 | +0% $55 | +5% $-13 | +10% $-81 |
|---|---|---|---|---|---|
| Rent | -10% $-123 | -5% $-34 | +0% $55 | +5% $144 | +10% $233 |
| Rate | -1.0pp $176 | -0.5pp $116 | base $55 | +0.5pp $-7 | +1.0pp $-70 |
UW: 25.0% down · 7.5% · 30yr · 1.5% tax · 5.0% vac · 8.0% maint · 8.0% mgmt
Financing live
Cash to close
- Down payment
- $59,975
- Closing costs
- $7,197
- Reserves months
- —
- Total cash needed
- —
Loan-product check · same deal, 3 products live
Conventional
25% down · 7.5% · 30yr
- Down + closing
- —
- Monthly P&I
- —
- Monthly cashflow
- —
- DSCR
- —
- Eligible?
- —
Personal DTI + credit; lowest rate.
DSCR
20% down · 8.5% · 30yr
- Down + closing
- —
- Monthly P&I
- —
- Monthly cashflow
- —
- DSCR
- —
- Eligible?
- —
No personal income docs; deal must DSCR.
Hard money
10% down · 12.0% · 12mo
- Down + closing
- —
- Monthly P&I
- —
- Monthly cashflow
- —
- DSCR
- —
- Eligible?
- —
Short-term bridge; refi at stabilization.
Listing history 18 events
-
2026-06-22days on market $239,900 Active 40 DOM
-
2026-06-18days on market $239,900 Active 37 DOM
-
2026-06-17days on market $239,900 Active 36 DOM
-
2026-06-16days on market $239,900 Active 35 DOM
-
2026-06-15days on market $239,900 Active 34 DOM
-
2026-06-14days on market $239,900 Active 32 DOM
-
2026-06-10days on market $239,900 Active 29 DOM
-
2026-06-09days on market $239,900 Active 28 DOM
-
2026-06-08days on market $239,900 Active 27 DOM
-
2026-06-07days on market $239,900 Active 26 DOM
-
2026-06-05days on market $239,900 Active 23 DOM
-
2026-06-03days on market $239,900 Active 22 DOM
-
2026-06-02days on market $239,900 Active 21 DOM
-
2026-06-01days on market $239,900 Active 20 DOM
-
2026-05-31days on market $239,900 Active 19 DOM
-
2026-05-30days on market $239,900 Active 18 DOM
-
2026-05-12$239,900 Active 704-char remark
-
2023-03-31price $282,000
ⓘ Source: listings_history table (triggers on properties + properties_extension) + one-shot
backfill from property_details.listing_events for pre-trigger history.
Tax reassessment forecast TX · Resets to sale price
- Current annual tax
- $3,641 · $303/mo
- Projected year-2 tax
- $4,390 · $366/mo
- Expected delta
- +$749/yr (+$62/mo · 20.6%)
ⓘ Screening estimate from a state-policy table — verify with the county assessor before closing.
Climate risk First Street
- Flood 8/10 Severe FEMA zone X (unshaded) · 99% chance over 30 yrs
- Wildfire 4/10 Moderate
- Heat 9/10 Extreme 7 d/yr ≥111°F today · 25 d/yr by 30 yrs out
- Wind 9/10 Extreme 99% chance of damaging wind over 30 yrs
- Air quality 2/10 Low 1 unhealthy d/yr today · 1 by 30 yrs out
Nearby sold comps map
Loading sold comps map…
Walkable amenities ~0.75 mi
Loading nearby amenities…
Taxation est. · year 1
- Rental income
- $27,083
- − Mortgage interest
- −$13,438
- − Property taxes
- −$3,641
- − Insurance
- −$1,997
- − Repairs & maintenance
- −$2,167
- − Management
- −$2,167
- − Depreciation
- −$6,979
- Taxable loss
- −$3,306
- Est. tax savings @ 24.0%
- +$793
- After-tax cash flow
- $1,454/yr
For passive investors: Depreciation is non-cash, so a rental often shows a tax loss while cash-flowing — sheltering income. Rental losses are passive: they offset passive income freely, and up to $25,000/yr can offset ordinary (W-2) income if you actively participate and your MAGI is under $100k (phasing out to $0 by $150k); unused losses carry forward. On sale, claimed depreciation is recaptured at up to 25%, and gains may owe capital-gains tax (a 1031 exchange can defer both). Figures are a year-1 estimate at your 24.0% rate — not tax advice; consult a CPA.
Schools (NCES district)
- District
- Lumberton ISD
- NCES district ID
- 4813530
- Math proficiency
- 48% ▼ -5.00%
- Reading proficiency
- 50% ▼ -4.00%
- Median HH income
- $62,996
- Composite
- 43.2/100
- National rank
- #3063
- State rank
- #173 of 826 in TX
Livability — Lumberton
- Score
- 75/100
- State rank
- #160
- US rank
- #4326
Category grades
Schools grade is shown separately in the Schools card above.
Census & demographics
- County
- Hardin County · 39,783 people
- City population
- 22,258
- Metro
- Beaumont-Port Arthur, TX
- Population (ZIP)
- 22,258
- Household income
- $95,718
- Rent vs Own
- Severe rent burden
- 147.0
Population outlook (Hardin County) Hauer SSP2
- Today (2025)
- 57,780 people
- By 2030
- 58,296 · +0.9%
- By 2040
- 58,421 · +1.1%
- By 2050
- 57,391 · -0.7%
- By 2075
- 53,132 · -8.0%
- By 2100
- 44,905 · -22.3%
Race, ethnicity, and origin ACS 2023
- Neighborhood character
- Predominantly White (89%)
- Race & ethnicity
- White 89% Hispanic / Latino 5% Two or more races 5%
- Hispanic origin (detail)
- Mexican 4%
- Common ancestry
- Lithuanian 10% Serbian 3% Slovak 2%
- Foreign-born
- 2% · Canada
- Languages at home
- 97% English-only · Spanish 2%
Political lean MEDSL · Hardin
- 2024 margin
- Solid R (+75.8) · D 11.9% · R 87.7%
- 2008→2024 swing
- -14.6pp toward R · 2008: -61.2pp · 2024: -75.8pp
- All cycles
- 2024: R+75.8 2020: R+73.8 2016: R+73.9 2012: R+67.6 2008: R+61.2
Not yet ingested
- Civics
- —
Market trends
- HPI YoY
- ▼ -160.56%
- Current HPI
- 156.2265
- Rent YoY
- —
- Metro
- Beaumont-Port Arthur, TX
- State GDP YoY
- ▲ 3.95%
- F500 in state
- 110
Industry mix (Fortune 500 HQ in TX)
| Industry | F500 HQs | Revenue |
|---|---|---|
| Energy | 16 | $1,198B |
|
||
| Technology | 5 | $198B |
|
||
| Engineering / Construction | 4 | $72B |
|
||
| Energy Services | 3 | $60B |
|
||
| Utilities | 3 | $41B |
|
||
| Healthcare | 2 | $330B |
|
||
Price history
-14.9% since first listed2 events — show timeline
- 2026-05-12 Listed $239,900 BBOR
- 2023-03-31 Price Changed $282,000 BBOR
Property tax history
+5.2%/yrLatest (2025): $3,641 · +9.1% YoY. Source: county tax records.
Cash-flow waterfall
monthlySold comps — $/sqft
last 12 mo · ≤1 miLoading sold comps…