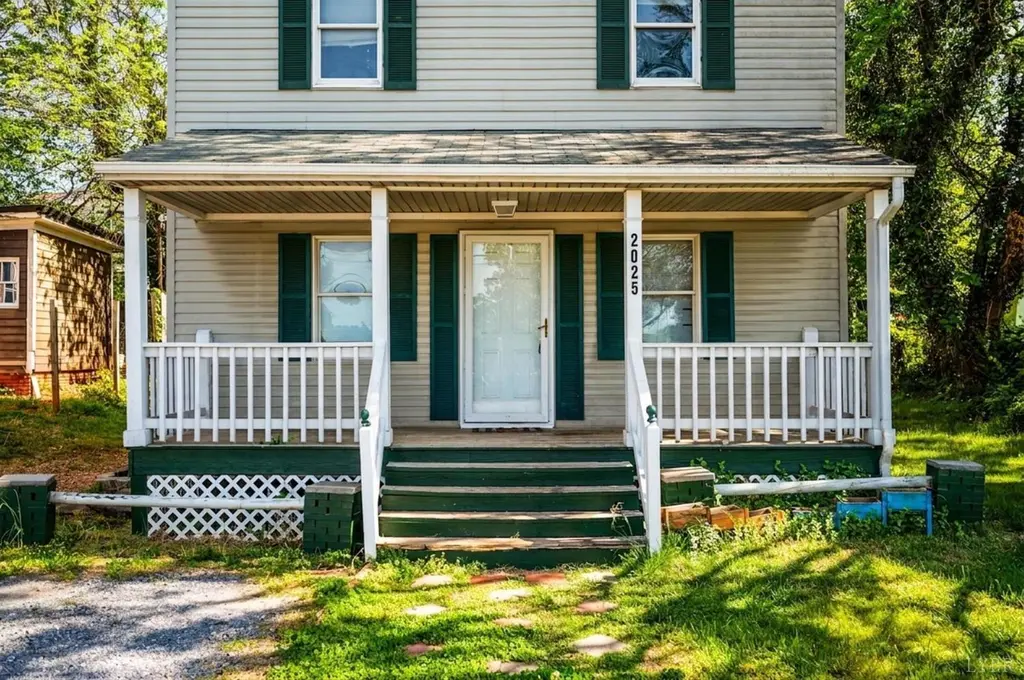
2025 Grace St · Lynchburg, VA
Flood risk 1/10 · Minimal
- FEMA flood zone
- X (unshaded)
- Chance of flooding over 30 yrs
- 0.0%
- Est. flood insurance / yr
- $507 – $1,088
Fire risk 3/10 · Minor
- Est. fire insurance / yr
- $666 – $1,236
Heat risk 6/10 · Moderate
- Hot days now (above 102°F)
- 7 days/yr
- Hot days in 30 yrs
- 18 days/yr
Wind risk 2/10 · Minimal
- Chance of severe wind over 30 yrs
- 3.0%
Air-quality risk 2/10 · Minimal
- Unhealthy air days now
- 0 days/yr
- Unhealthy air days in 30 yrs
- 1 days/yr
Risk factors via First Street. Map © Google.
Why this score? — see what drove the B- grade
The composite is a weighted blend of 9 inputs, each scored 0–100. Each bar is that input's sub-score; the figure is the points it added to the 100-point composite (weight × sub-score).
- Cash flow +24.3/30.0
- ARV discount +14.4/15.0
- DSCR +7.8/10.0
- 1% rule +5.6/10.0
- Livability +4.5/5.0
- Schools +4.0/10.0
- Rent growth +3.6/5.0
- Condition / age +2.5/5.0
- Appreciation +0.0/10.0
$129,900
🖨 Deal sheet 📄 Offer letter ✓ Due diligence
Listing remarks MLS
Two-story home located in the heart of Lynchburg, just minutes from downtown dining and entertainment. This home offers 3 bedrooms and 1.5 bathrooms, including a convenient main-level bedroom. The open-concept main level features a spacious living room, providing a comfortable and functional layout. Step outside to enjoy the rear deck and yard, perfect for relaxing or entertaining. Major updates include a roof and heating and cooling systems replaced in 2022, offering added peace of mind. A great opportunity for owner-occupants or investors seeking a well-located home with easy access to everything downtown Lynchburg has to offer.
Key facts
- Main-level bedroom
- Two-story home
- Rear deck
Tags
Neighborhood map
What this means for you Summary
Snapshot
- This is a 3-bed/1.5-bath single-family listed at $130k.
Deal economics
- At list price, monthly cash flow is $261 ($3k/yr) — positive.
- The deal already cash-flows at list — no discount required.
- Meets the 1% rule at list price ($1k rent vs $130k).
- Recommended offer: $122k (6.0% below list) — sets the bar for market timing.
- Cap rate 8.7% vs local median 4.0% in Lynchburg — top-decile yield for the area; either an underpriced asset or a hidden risk that comps aren't pricing in. Stress-test before assuming the spread holds.
Location & tenants
- Location reads 91/100 on livability (#1 in VA, #58 nationally) — a professional / high-income tenant draw. Strengths: amenities A+, commute A+, cost of living A+; Watch: crime C-, employment D+.
- Lynchburg City Public School District (urban): math 36% / reading 61% proficiency, ranked #104 of 131 in VA (top 79%) — families likely to look elsewhere, expect single-tenant / working-renter base with shorter leases; 61% free/reduced lunch — lower-income household profile, screen leases tightly.
- Market conditions: Rents rising fast (+4.6%/yr); 105 active listings in the ZIP; 31 comparable units currently listed for rent nearby; rentals at typical pace (median 21d on market — plan ~3-4 weeks tenant-placement turnaround); 472 units permitted in Lynchburg city in 2024 (240 in 5+ unit buildings).
- This rent runs 31% of the median local income ($53k/yr) — at the standard rent-burdened threshold; future hikes will face affordability resistance.
Forward outlook
- Local home prices are declining (-3.0%/yr); year-one equity from $898 of loan paydown is wiped out by about $4k of value loss. Plan a longer hold.
- Lynchburg County population projected at +37% by 2050 — long-run rental-demand tailwind backs the buy-and-hold thesis.
- At projected returns (-3.0% appreciation + 4.6% rent growth), your $36k cash investment doubles in ~10 years — after that, you're playing with house money.
Negotiation context
- It's been on market 63 days — a 6% lower offer ($122k) is reasonable based on typical stale-listing flexibility.
- Current owner paid $46k; list at $130k implies a 182% gain — meaningful room to come down on a strong offer.
Risks & watch-outs
- Climate carrying-cost: extreme-heat days projected 7→18/yr by 2055 (HVAC capex compounding) — expect insurance premiums to compound above CPI over the hold.
Questions for the listing agent
- It's been on market 63 days. Have you received any prior offers? Is the seller open to a 6% concession, seller financing, or rate buy-down credit?
- Why hasn't it sold? Are there any deal-killer items the seller is aware of (foundation, flood, title, zoning, code violations)?
- Is there a deadline driving the sale (1031 exchange, divorce, estate, relocation)? That informs how much negotiation room exists.
- Schools are A-rated — typically a magnet for longer-tenancy family renters. What's the average tenant stay here, and is there a school-zone premium baked into asking?
- What's the average days-on-market for RENTAL listings here right now (not sales)? A rising rental-DOM trend means longer vacancies and softer asking-rent achievability than the comps imply.
- What's the recent tenant-quality profile in this submarket — average credit score on applications, eviction rate, late-payment / NSF rate, and stable-employment percentage? A property-management company in the area should have these aggregated.
- How much new for-sale + rental construction is in the pipeline within 1–3 miles? Heavy new supply typically softens prices + rents 12–24 months out; constrained supply supports both.
Investment metrics
- 1% rule
- 1.06% ✓
- Cap rate
- 8.70%
- Cash-on-cash
- 8.60%
- DSCR
- 1.38
- GRM
- 7.9
CMA / ARV
- ARV (median comp)
- $153,331
- List price
- $129,900
- Delta
- -15.28%
- Verdict
- UNDERPRICED
- Comps
- 20 within 1.0 mi
Show comp detail 12 sales within ~0.75 mi
| Address | Dist | Beds/Ba | Sqft | Sold | Price | $/sf | Match |
|---|---|---|---|---|---|---|---|
| 2228 High St | 0.18mi | 2/1.0 (-1) | 1,233 (-1%) | 2mo | $21,500 | $17 | 81 |
| 1113 18th St | 0.34mi | 3/2.0 | 1,283 (+3%) | 4mo | $54,500 | $42 | 74 |
| 1930 Vine Street St | 0.16mi | 3/2.0 | 1,110 (-11%) | 5mo | $112,000 | $101 | 68 |
| 1114 Knight St | 0.28mi | 3/2.0 | 1,085 (-13%) | 0mo | $43,600 | $40 | 63 |
| 909 Virginia St | 0.14mi | 3/1.0 | 1,064 (-15%) | 6mo | $171,000 | $161 | 62 |
| 1027 Knight St | 0.30mi | 3/1.0 | 1,387 (+11%) | 6mo | $95,000 | $68 | 61 |
| 1800 Floyd St | 0.45mi | 3/1.0 | 1,370 (+10%) | 3mo | $190,000 | $139 | 59 |
| 1732 Otey St | 0.58mi | 3/2.0 | 1,176 (-6%) | 6mo | $90,000 | $77 | 56 |
| 1417 Floyd St | 0.61mi | 3/2.0 | 1,120 (-10%) | 1mo | $203,500 | $182 | 52 |
| 1505 Wise St | 0.53mi | 3/1.0 | 1,109 (-11%) | 6mo | $115,000 | $104 | 50 |
| 129 Jubilee Dr | 0.54mi | 4/1.0 (+1) | 1,108 (-11%) | 5mo | $117,000 | $106 | 45 |
| 1706 Floyd St | 0.47mi | 2/1.0 (-1) | 1,082 (-13%) | 6mo | $145,000 | $134 | 44 |
Match score weights: distance 35% · size 25% · config 20% · recency 20%. Top-matched comps best support the ARV.
Projected returns pro-forma
-3.0% appreciation · 4.56% rent growth · sell at horizon
- IRR
- -1.6%
- Equity multiple
- 0.94×
- Total profit
- $-2,282
- Equity at exit
- $19,369
- IRR
- 9.6%
- Equity multiple
- 1.79×
- Total profit
- $28,581
- Equity at exit
- $11,231
Cash invested: $36,372 (down + closing). Projections, not guarantees.
Landlord ↔ Tenant lean methodology
- Overall (STATE)
- 55 Moderately Landlord-Leaning
- State Virginia
- 55 Moderately Landlord-Leaning · D+2
- County
- — inherits STATE
- City
- — inherits STATE
ZIP-level market 24504
- Home prices YoY
- -12.7%
- Rents YoY
- 4.6%
- Active inventory
- 105
- Price-to-rent
- 7.9×
Monthly cashflow live
- Estimated rent
- $1,376 high interval (Pro) →
- Mortgage (P&I)
- −$681
- Tax from tax record
- −$91 /mo · $1,091/yr
- Insurance
- −$54
- HOA
- −$0
- Vacancy / Maint / Mgmt
- −$289
- Net cashflow
- $261
Break-even live
UW: 25.0% down · 7.5% · 30yr · 1.5% tax · 5.0% vac · 8.0% maint · 8.0% mgmt
Financing live
Cash to close
- Down payment
- $32,475
- Closing costs
- $3,897
- Reserves months
- —
- Total cash needed
- —
Loan-product check · same deal, 3 products live
Conventional
25% down · 7.5% · 30yr
- Down + closing
- —
- Monthly P&I
- —
- Monthly cashflow
- —
- DSCR
- —
- Eligible?
- —
Personal DTI + credit; lowest rate.
DSCR
20% down · 8.5% · 30yr
- Down + closing
- —
- Monthly P&I
- —
- Monthly cashflow
- —
- DSCR
- —
- Eligible?
- —
No personal income docs; deal must DSCR.
Hard money
10% down · 12.0% · 12mo
- Down + closing
- —
- Monthly P&I
- —
- Monthly cashflow
- —
- DSCR
- —
- Eligible?
- —
Short-term bridge; refi at stabilization.
Rent comps 31 comps
| Address | Beds | Baths | Sqft | Rent | $/sqft | DOM | Units | Dist |
|---|---|---|---|---|---|---|---|---|
| 1810 Laurel St Lynchburg, VA | 2.0 | 1.0 | 720 | $995 | $1.38 | 43d | 1 | 0.37mi |
| 1521 Taylor St Lynchburg, VA | 3.0 | 1.0 | 1337 | $1,195 | $0.89 | 21d | 1 | 0.50mi |
| 1500 Main St Lynchburg, VA | 1.0–2.0 | 1.0 | 1182 | $1,600 | $1.35 | 13d | 6 | 0.51mi |
| 1308 16th St Lynchburg, VA | 3.0 | 2.0 | 1380 | $1,800 | $1.30 | 13d | 1 | 0.52mi |
| 1415 Floyd St Lynchburg, VA | 3.0 | 2.0 | 1300 | $1,800 | $1.38 | 21d | 1 | 0.64mi |
| 1219 Pierce St Unit 1221 Lynchburg, VA | 2.0 | 1.0 | 1168 | $825 | $0.71 | 13d | 1 | 0.81mi |
| 1105 Fillmore St Unit B Lynchburg, VA | 3.0 | 1.0 | 1300 | $1,250 | $0.96 | 43d | 1 | 0.86mi |
| 900 Polk St Unit A Lynchburg, VA | 3.0 | 1.0 | 1100 | $895 | $0.81 | 13d | 1 | 0.87mi |
| 1106 Pierce St Lynchburg, VA | 3.0 | 2.0 | 1018 | $875 | $0.86 | 21d | 1 | 0.88mi |
| 1401 Kemper St Lynchburg, VA | 2.0–3.0 | 2.0 | 1118 | $1,167 | $1.04 | 21d | 6 | 0.90mi |
| 1008 8th St Lynchburg, VA | 3.0 | 2.0 | 1316 | $1,795 | $1.36 | 21d | 1 | 0.95mi |
| 801 Church St Unit 8 Lynchburg, VA | 2.0 | 2.0 | 875 | $1,850 | $2.11 | 13d | 1 | 0.96mi |
| 2205 Easley Ave Lynchburg, VA | 2.0 | 2.0 | 870 | $1,400 | $1.61 | 43d | 1 | 1.01mi |
| 601 Jackson St Lynchburg, VA | 3.0 | 2.0 | 1138 | $1,595 | $1.40 | 43d | 1 | 1.06mi |
| 2518 Carter St Lynchburg, VA | 3.0 | 2.0 | 1091 | $1,500 | $1.37 | 43d | 1 | 1.08mi |
| 612 Commerce St Lynchburg, VA | 1.0–2.0 | 1.0–2.0 | 716 | $1,250 | $1.74 | 13d | 2 | 1.10mi |
| 2269 Aragon St Lynchburg, VA | 3.0 | 2.0 | 1200 | $1,695 | $1.41 | 43d | 1 | 1.10mi |
| 2336 Aragon St Lynchburg, VA | 2.0 | 1.0 | 1042 | $995 | $0.95 | 13d | 1 | 1.11mi |
| 512 Polk St Lynchburg, VA | 3.0 | 1.0 | 1340 | $1,295 | $0.97 | 21d | 1 | 1.12mi |
| 317 Polk St Lynchburg, VA | 3.0 | 2.0 | 925 | $1,650 | $1.78 | 43d | 1 | 1.25mi |
| 1625 Shaffer St Lynchburg, VA | 2.0 | 1.0 | 895 | $850 | $0.95 | 43d | 1 | 1.26mi |
| 2107 Park Ave Unit 4 Lynchburg, VA | 2.0 | 1.0 | 800 | $785 | $0.98 | 13d | 1 | 1.33mi |
| 2210 Haden St Lynchburg, VA | 2.0 | 1.0 | 784 | $1,050 | $1.34 | 43d | 1 | 1.34mi |
| 2021 Rose Ln Lynchburg, VA | 2.0 | 1.0 | 836 | $1,095 | $1.31 | 21d | 1 | 1.38mi |
| 403 Grove St Lynchburg, VA | 3.0 | 2.0 | 1400 | $1,600 | $1.14 | 43d | 1 | 1.38mi |
| 2734 Fort Ave Lynchburg, VA | 1.0–2.0 | 1.0–2.0 | 875 | $1,450 | $1.66 | 43d | 1 | 1.40mi |
| 2205 Mayflower Dr Lynchburg, VA | 3.0 | 1.0 | 1500 | $1,450 | $0.97 | 21d | 1 | 1.40mi |
| 317 Grove St Unit A Lynchburg, VA | 2.0 | 1.0 | 900 | $895 | $0.99 | 43d | 1 | 1.41mi |
| 318 Wadsworth St Lynchburg, VA | 3.0 | 1.0 | 943 | $995 | $1.06 | 21d | 1 | 1.42mi |
| 905 Centerdale St Lynchburg, VA | 2.0 | 1.0 | 780 | $895 | $1.15 | 13d | 1 | 1.46mi |
| 630 Park Ln Lynchburg, VA | 4.0 | 1.5 | 1434 | $1,895 | $1.32 | 13d | 1 | 1.48mi |
Listing history 18 events
-
2026-06-19days on market $129,900 Active 63 DOM
-
2026-06-18days on market $129,900 Active 62 DOM
-
2026-06-17days on market $129,900 Active 61 DOM
-
2026-06-16days on market $129,900 Active 60 DOM
-
2026-06-15days on market $129,900 Active 59 DOM
-
2026-06-14days on market $129,900 Active 57 DOM
-
2026-06-13days on market $129,900 Active 56 DOM
-
2026-06-10days on market $129,900 Active 54 DOM
-
2026-06-09days on market $129,900 Active 53 DOM
-
2026-06-08days on market $129,900 Active 52 DOM
-
2026-06-07days on market $129,900 Active 51 DOM
-
2026-06-03days on market $129,900 Active 47 DOM
-
2026-06-02days on market $129,900 Active 46 DOM
-
2026-06-01days on market $129,900 Active 45 DOM
-
2026-05-31days on market $129,900 Active 44 DOM
-
2026-05-30days on market $129,900 Active 43 DOM
-
2026-04-17$139,900 Active 638-char remark
Show marketing remark (638 chars)
Two-story home located in the heart of Lynchburg, just minutes from downtown dining and entertainment. This home offers 3 bedrooms and 1.5 bathrooms, including a convenient main-level bedroom. The open-concept main level features a spacious living room, providing a comfortable and functional layout. Step outside to enjoy the rear deck and yard, perfect for relaxing or entertaining. Major updates include a roof and heating and cooling systems replaced in 2022, offering added peace of mind. A great opportunity for owner-occupants or investors seeking a well-located home with easy access to everything downtown Lynchburg has to offer.
-
1996-05-07soldstatus $46,000
ⓘ Source: listings_history table (triggers on properties + properties_extension) + one-shot
backfill from property_details.listing_events for pre-trigger history.
Tax reassessment forecast VA · Resets to sale price
- Current annual tax
- $1,091 · $91/mo
- Projected year-2 tax
- $1,091 · $91/mo
- Expected delta
- $0/yr ($0/mo · 0.0%)
ⓘ Screening estimate from a state-policy table — verify with the county assessor before closing.
Climate risk First Street
- Flood 1/10 Low FEMA zone X (unshaded) · 0% chance over 30 yrs
- Wildfire 3/10 Moderate
- Heat 6/10 Major 7 d/yr ≥102°F today · 18 d/yr by 30 yrs out
- Wind 2/10 Low 3% chance of damaging wind over 30 yrs
- Air quality 2/10 Low 0 unhealthy d/yr today · 1 by 30 yrs out
Nearby sold comps map
Loading sold comps map…
Walkable amenities ~0.75 mi
Loading nearby amenities…
Taxation est. · year 1
- Rental income
- $16,509
- − Mortgage interest
- −$7,276
- − Property taxes
- −$1,091
- − Insurance
- −$650
- − Repairs & maintenance
- −$1,321
- − Management
- −$1,321
- − Depreciation
- −$3,779
- Taxable income
- $1,072
- Est. tax owed @ 24.0%
- −$257
- After-tax cash flow
- $2,870/yr
For passive investors: Depreciation is non-cash, so a rental often shows a tax loss while cash-flowing — sheltering income. Rental losses are passive: they offset passive income freely, and up to $25,000/yr can offset ordinary (W-2) income if you actively participate and your MAGI is under $100k (phasing out to $0 by $150k); unused losses carry forward. On sale, claimed depreciation is recaptured at up to 25%, and gains may owe capital-gains tax (a 1031 exchange can defer both). Figures are a year-1 estimate at your 24.0% rate — not tax advice; consult a CPA.
Schools (NCES district)
- District
- Lynchburg City Public School District
- NCES district ID
- 5102340
- Math proficiency
- 36% ▼ -38.00%
- Reading proficiency
- 61% ▼ -8.00%
- Median HH income
- $39,097
- Composite
- 40.4/100
- National rank
- #3730
- State rank
- #104 of 131 in VA
Livability — Lynchburg
- Score
- 91/100
- State rank
- #1
- US rank
- #58
Category grades
Schools grade is shown separately in the Schools card above.
Census & demographics
- Census place
- Lynchburg, VA
- County
- Lynchburg City · 97,036 people
- City population
- 97,036
- Metro
- Lynchburg, VA
- Population (ZIP)
- 9,632
- Household income
- $52,571
- Rent vs Own
- Severe rent burden
- 552.0
Population outlook (Lynchburg County) Hauer SSP2
- Today (2025)
- 87,977 people
- By 2030
- 93,626 · +6.4%
- By 2040
- 106,145 · +20.7%
- By 2050
- 120,783 · +37.3%
- By 2075
- 162,249 · +84.4%
- By 2100
- 191,358 · +117.5%
Race, ethnicity, and origin ACS 2023
- Neighborhood character
- Diverse neighborhood (Simpson 0.57)
- Race & ethnicity
- White 51% Black 40% Two or more races 6% Hispanic / Latino 4%
- Common ancestry
- Italian 3% Lithuanian 1% Serbian 1%
- Foreign-born
- 4% · Canada, China
- Languages at home
- 95% English-only · Spanish 3% Chinese 1%
Political lean MEDSL · Lynchburg
- 2024 margin
- Lean R (+7.9) · D 45.4% · R 53.3% · Other 1.3%
- 2008→2024 swing
- -3.9pp toward R · 2008: -4.0pp · 2024: -7.9pp
- All cycles
- 2024: R+7.9 2020: D+2.6 2016: R+9.0 2012: R+10.6 2008: R+4.0
Not yet ingested
- Civics
- —
Market trends
- HPI YoY
- ▼ -33.39%
- Current HPI
- 229.4423
- Rent YoY
- ▲ 4.56%
- Metro
- Lynchburg, VA
- State GDP YoY
- ▲ 2.40%
- F500 in state
- 50
Industry mix (Fortune 500 HQ in VA)
| Industry | F500 HQs | Revenue |
|---|---|---|
| Aerospace / Defense | 4 | $236B |
|
||
| Technology / Defense | 3 | $32B |
|
||
| Financial Services | 2 | $176B |
|
||
| Utilities | 2 | $27B |
|
||
| Insurance | 2 | $25B |
|
||
| Technology | 2 | $15B |
|
||
Price history
+204.1% since first listed2 events — show timeline
- 2026-04-17 Listed $139,900 LMLS
- 1996-05-07 Sold (Public Records) $46,000 Public Records
Property tax history
+2.0%/yrLatest (2025): $1,091 · +35.8% YoY. Source: county tax records.
Cash-flow waterfall
monthlySold comps — $/sqft
last 12 mo · ≤1 miLoading sold comps…