 6-Plex
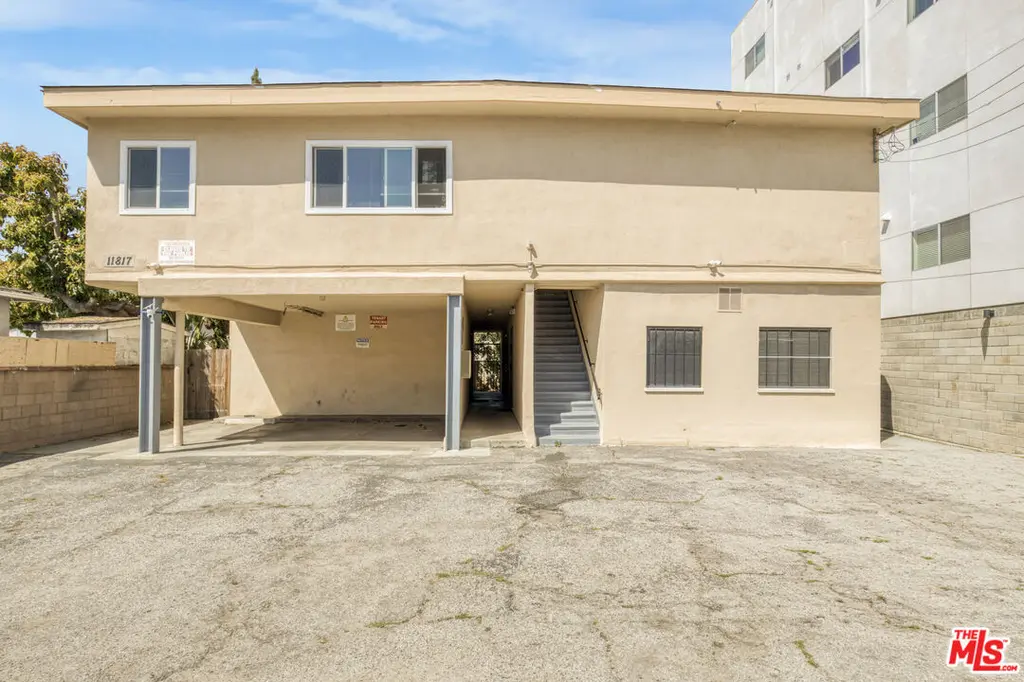
11817 Culver Blvd · Los Angeles, CA
Flood risk 6/10 · Moderate
- FEMA flood zone
- X (unshaded)
- Chance of flooding over 30 yrs
- 0.71%
- Est. flood insurance / yr
- $507 – $1,088
Fire risk 1/10 · Minimal
- Est. fire insurance / yr
- $659 – $1,223
Heat risk 5/10 · Moderate
- Hot days now (above 85°F)
- 7 days/yr
- Hot days in 30 yrs
- 20 days/yr
Wind risk 1/10 · Minimal
- Chance of severe wind over 30 yrs
- —
Air-quality risk 4/10 · Minor
- Unhealthy air days now
- 6 days/yr
- Unhealthy air days in 30 yrs
- 7 days/yr
Risk factors via First Street. Map © Google.
Why this score? — see what drove the B grade
The composite is a weighted blend of 9 inputs, each scored 0–100. Each bar is that input's sub-score; the figure is the points it added to the 100-point composite (weight × sub-score).
- Cash flow +30.0/30.0
- ARV discount +15.0/15.0
- DSCR +10.0/10.0
- 1% rule +7.2/10.0
- Schools +3.6/10.0
- Livability +3.4/5.0
- Rent growth +2.5/5.0
- Condition / age +2.5/5.0
- Appreciation +0.0/10.0
$1,275,000
🖨 Deal sheet 📄 Offer letter ✓ Due diligence
Multi-family units
County records classify this as Multi-Family (5+ Unit). Listing-text estimate: 6 units. confirmed
5+ unit building — per-unit beds/baths from public records are typically unavailable; the breakdown below (if shown) is an estimate from the listing text.
Listing remarks MLS
THREE PROPERTY TRUST SALE [3674 EMPIRE DR 10 UNITS, 4253 S CENTINELA AVE 6 UNITS, 11817 CULVER BLVD 7 UNITS] 11817 Culver Blvd is a well-maintained 6-unit property plus an additional non-conforming bachelor unit (7 units in total). The property, built between 1952 & 1960, is situated along the residential side of Culver Blvd in the desirable Del Rey neighborhood. This is a Trust Sale offered for the first time in 54 years. The property totals approximately 4,807 square feet of living space on an 8,409 square foot R3-zoned lot and features a unit mix of (1) 2BR/1BA detached front house, (5) 1BR/1BA units, and (1) non-conforming bachelor unit (legal guest room). The detached front house, measuring approximately 781 square feet, has its own private fenced front yard and storage shed. The back structure containing 6 units is approximately 4,026 square feet and includes a tuck under parking area and backyard. Current rents are approximately 97% below current market, representing one of the most compelling value-add opportunities available in today's Westside apartment market. The bachelor unit operates under a RUBS arrangement, and an on-site laundry room generates supplemental income. Ownership has completed meaningful capital improvements including a fully updated electrical main and sub-panels (2023), replacement of the majority of the windows, a 100-gallon water heater, and completion of the required soft-story seismic retrofit (2021). The tuck-under parking configuration presents strong attached ADU potential (Buyer to Verify), and the R3 zoning may support additional density under current state law (Buyer to Verify). Six on-site parking spaces serve the existing resident base. Ideally positioned along Culver Boulevard with immediate 405 Freeway access and less than two miles from the beach, the property sits at the center of Silicon Beach, home to major employers including Google, Amazon Studios, Hulu, and Snap. Plus, Cedars-Sinai's new nine-story Marina del Rey Hospital is slated to open in 2026 just minutes away.
Key facts
- On-site laundry room
- R3 zoning
- 8,412 sq ft lot
Tags
Neighborhood map
What this means for you Summary
Snapshot
- This is a 6 × 1-bed/?-bath units multifamily listed at $1.27M.
Deal economics
- At list price, monthly cash flow is $5k ($58k/yr) — positive. Per door: $801/mo.
- The deal already cash-flows at list — no discount required.
- Meets the 1% rule at list price ($16k rent vs $1.27M).
- Recommended offer: $1.24M (3.0% below list) — sets the bar for market timing.
- Cap rate 10.8% vs local median 2.1% in Los Angeles — top-decile yield for the area; either an underpriced asset or a hidden risk that comps aren't pricing in. Stress-test before assuming the spread holds.
Location & tenants
- Location reads 68/100 on livability (#273 in CA) — a middle-class / working-renter tenant base. Strengths: amenities A+, commute A+, employment B; Watch: health & safety C-, schools D+, crime F.
- Los Angeles Unified (urban): math 29% / reading 54% proficiency, ranked #223 of 517 in CA (top 43%) — families likely to look elsewhere, expect single-tenant / working-renter base with shorter leases; 67% free/reduced lunch — lower-income household profile, screen leases tightly.
- Market conditions: Rents soft (-0.1%/yr); 159 active listings in the ZIP; 40 comparable units currently listed for rent nearby; rentals at typical pace (median 25d on market — plan ~3-4 weeks tenant-placement turnaround); high-income renter base; 19,697 units permitted in Los Angeles County in 2024 (9,426 in 5+ unit buildings).
- At $15,573/mo this rent would consume 164% of the median local household income ($114k/yr) (locally 3174% of renters already pay >50% of income on rent) — very limited rent-growth headroom before tenants either downsize or default.
Forward outlook
- Local home prices are declining (-3.0%/yr); year-one equity from $9k of loan paydown is wiped out by about $38k of value loss. Plan a longer hold.
- Los Angeles County population projected at +9% by 2050 — modest demand growth; plan on rents tracking national, not racing it.
Negotiation context
- It's been on market 40 days — a 3% lower offer ($1.24M) is reasonable based on typical stale-listing flexibility.
- Current owner paid $14k; list at $1.27M implies a 9007% gain — meaningful room to come down on a strong offer.
Risks & watch-outs
- Watch-outs: built in 1952 — expect roof / HVAC / electrical / plumbing capex.
- Climate carrying-cost: major flood risk; extreme-heat days projected 7→20/yr by 2055 (HVAC capex compounding) — expect insurance premiums to compound above CPI over the hold.
Questions for the listing agent
- It's been on market 40 days. Have you received any prior offers? Is the seller open to a 3% concession, seller financing, or rate buy-down credit?
- Can we see the unit-by-unit rent roll, current vacancy, and any below-market leases? What's the average tenancy length?
- What capital expenditures (roof, boiler, parking lot, exteriors) have been made in the last 5 years, and what's planned in the next 2?
- Built in 1952 — when were the roof, HVAC, electrical panel, plumbing, and water heater last replaced?
- Is there a deadline driving the sale (1031 exchange, divorce, estate, relocation)? That informs how much negotiation room exists.
- Schools are D-rated, which usually means shorter tenancies and higher turnover. Who's the typical renter profile here, and what's been the actual vacancy rate?
- Crime grade is F in this area — have there been break-ins, vandalism, or insurance claims at this property in the last 3 years? What carrier currently insures it and at what premium?
- What's the average days-on-market for RENTAL listings here right now (not sales)? A rising rental-DOM trend means longer vacancies and softer asking-rent achievability than the comps imply.
- What's the recent tenant-quality profile in this submarket — average credit score on applications, eviction rate, late-payment / NSF rate, and stable-employment percentage? A property-management company in the area should have these aggregated.
- How much new apartment / multifamily construction is in the pipeline within 1–3 miles? Heavy new supply (>2% of stock underway) typically softens rents 12–24 months out; light construction supports rent growth.
Investment metrics
- 1% rule
- 1.22% ✓
- Cap rate
- 10.81%
- Cash-on-cash
- 16.15%
- DSCR
- 1.72
- GRM
- 6.8
CMA / ARV
- ARV (median comp)
- $1,766,501
- List price
- $1,275,000
- Delta
- -27.82%
- Verdict
- UNDERPRICED
- Comps
- 15 within 1.0 mi
Projected returns pro-forma
-3.0% appreciation · 0.0% rent growth · sell at horizon
- IRR
- 4.0%
- Equity multiple
- 1.15×
- Total profit
- $53,160
- Equity at exit
- $190,107
- IRR
- 10.7%
- Equity multiple
- 1.73×
- Total profit
- $261,586
- Equity at exit
- $110,239
Cash invested: $357,000 (down + closing). Projections, not guarantees.
Landlord ↔ Tenant lean methodology
- Overall (CITY)
- 0 Strongly Tenant-Friendly
- State California
- 18 Strongly Tenant-Friendly · D+13
- County
- — inherits STATE
- City Los Angeles
- 0 Strongly Tenant-Friendly · D+22
ZIP-level market 90066
- Rents YoY
- -0.1%
- Active inventory
- 159
- Price-to-rent
- 40.9×
Monthly cashflow live
- Estimated rent
- $15,573 high interval (Pro) →
- Mortgage (P&I)
- −$6,686
- Tax from tax record
- −$281 /mo · $3,373/yr
- Insurance
- −$531
- HOA
- −$0
- Vacancy / Maint / Mgmt
- −$3,270
- Net cashflow
- $4,804
Break-even live
6-unit breakdown (identical units grouped — click to expand)
| Units | Beds | Baths | Est. rent |
|---|---|---|---|
| 6× units | 1 | — | $15,576 |
| #1 | 1 | — | $2,596 |
| #2 | 1 | — | $2,596 |
| #3 | 1 | — | $2,596 |
| #4 | 1 | — | $2,596 |
| #5 | 1 | — | $2,596 |
| #6 | 1 | — | $2,596 |
| Total (6 units) | $15,573 | ||
UW: 25.0% down · 7.5% · 30yr · 1.5% tax · 5.0% vac · 8.0% maint · 8.0% mgmt
Financing live
Cash to close
- Down payment
- $318,750
- Closing costs
- $38,250
- Reserves months
- —
- Total cash needed
- —
Loan-product check · same deal, 3 products live
Conventional
25% down · 7.5% · 30yr
- Down + closing
- —
- Monthly P&I
- —
- Monthly cashflow
- —
- DSCR
- —
- Eligible?
- —
Personal DTI + credit; lowest rate.
DSCR
20% down · 8.5% · 30yr
- Down + closing
- —
- Monthly P&I
- —
- Monthly cashflow
- —
- DSCR
- —
- Eligible?
- —
No personal income docs; deal must DSCR.
Hard money
10% down · 12.0% · 12mo
- Down + closing
- —
- Monthly P&I
- —
- Monthly cashflow
- —
- DSCR
- —
- Eligible?
- —
Short-term bridge; refi at stabilization.
Rent comps 40 comps
| Address | Beds | Baths | Sqft | Rent | $/sqft | DOM | Units | Dist |
|---|---|---|---|---|---|---|---|---|
| 11834 Avon Way Apt 101 Los Angeles, CA | 2.0 | 2.0 | 912 | $2,795 | $3.06 | 7d | 1 | 0.02mi |
| 11834 Avon Way Unit 203 Los Angeles, CA | 2.0 | 2.0 | 802 | $3,095 | $3.86 | 43d | 1 | 0.02mi |
| 11846 Culver Blvd Los Angeles, CA | 2.0 | 1.5 | 1050 | $3,000 | $2.86 | 43d | 1 | 0.06mi |
| 11919 Culver Blvd Los Angeles, CA | 2.0 | 2.0 | 1000 | $2,975 | $2.98 | 19d | 1 | 0.07mi |
| 11734 Avon Way #102 Los Angeles, CA | 2.0 | 2.0 | 910 | $3,500 | $3.85 | 18d | 1 | 0.07mi |
| 11818 Courtleigh Dr #102 Los Angeles, CA | 2.0 | 2.0 | 1021 | $3,100 | $3.04 | 24d | 1 | 0.08mi |
| 11733 Avon Way #101 Los Angeles, CA | 2.0 | 2.0 | 860 | $3,350 | $3.90 | 18d | 1 | 0.10mi |
| 11733 Avon Way #101 Los Angeles, CA | 2.0 | 2.0 | 860 | $3,350 | $3.90 | 19d | 1 | 0.10mi |
| 11937 Avon Way Unit 16 Los Angeles, CA | 1.0 | 1.0 | 695 | $2,098 | $3.02 | 7d | 1 | 0.12mi |
| 11937 Avon Way Los Angeles, CA | 1.0 | 1.0 | 695 | $2,098 | $3.02 | 12d | 1 | 0.12mi |
| 11713 Avon Way Unit 6 Los Angeles, CA | 2.0 | 1.0 | 1100 | $2,495 | $2.27 | 24d | 1 | 0.12mi |
| 11955 Culver Blvd Unit 505 Los Angeles, CA | 2.0 | 1.5 | 1032 | $3,800 | $3.68 | 43d | 1 | 0.13mi |
| 11955 Culver Blvd Unit 203 Los Angeles, CA | 1.0 | 1.0 | 834 | $2,800 | $3.36 | 22d | 1 | 0.13mi |
| 11955 Culver Blvd Unit 402 Los Angeles, CA | 1.0 | 1.0 | 790 | $2,999 | $3.80 | 43d | 1 | 0.13mi |
| 11737 Courtleigh Dr Unit 108 Los Angeles, CA | 2.0 | 2.0 | 950 | $3,483 | $3.67 | 24d | 1 | 0.15mi |
| 11737 Courtleigh Dr Los Angeles, CA | 2.0 | 2.0 | 983 | $3,483 | $3.54 | 24d | 1 | 0.15mi |
| 4320 Inglewood Blvd Unit 201 Los Angeles, CA | 2.0 | 2.0 | 1000 | $3,700 | $3.70 | 43d | 1 | 0.17mi |
| 4354 McLaughlin Ave Unit 103 Los Angeles, CA | 2.0 | 2.0 | 850 | $3,000 | $3.53 | 7d | 1 | 0.18mi |
| 11901 W Washington Blvd Los Angeles, CA | 2.0 | 1.0 | 817 | $2,500 | $3.06 | 43d | 1 | 0.19mi |
| 4373 Inglewood Blvd Unit 2 Los Angeles, CA | 1.0 | 1.0 | 750 | $1,750 | $2.33 | 5d | 1 | 0.19mi |
| 4327 Inglewood Blvd Unit 4 Los Angeles, CA | 1.0 | 1.0 | 625 | $2,195 | $3.51 | 43d | 1 | 0.21mi |
| 4505 S Slauson Ave Unit 202 Culver City, CA | 1.0 | 1.0 | 700 | $2,580 | $3.69 | 24d | 1 | 0.21mi |
| 4505 S Slauson Ave Unit 323 Culver City, CA | 1.0 | 1.5 | 750 | $2,768 | $3.69 | 2d | 1 | 0.21mi |
| 11612 Culver Blvd Los Angeles, CA | 1.0 | 1.0 | 750 | $2,895 | $3.86 | 7d | 1 | 0.21mi |
| 11924 W Washington Blvd Los Angeles, CA | 3.0 | 1.0–2.0 | 1127 | $5,344 | $4.74 | 1d | 6 | 0.23mi |
| 11528 Culver Blvd Unit 1/2 Los Angeles, CA | 2.0 | 2.0 | 684 | $2,250 | $3.29 | 43d | 1 | 0.25mi |
| 4227 McLaughlin Ave #136 Los Angeles, CA | 1.0 | 1.0 | 750 | $3,610 | $4.81 | 5d | 1 | 0.29mi |
| 4358 Berryman Ave #14 Los Angeles, CA | 1.0 | 1.0 | 563 | $2,350 | $4.17 | 11d | 1 | 0.30mi |
| 4256 Lindblade Dr Unit 4 Los Angeles, CA | 1.0 | 1.0 | 650 | $2,195 | $3.38 | 43d | 1 | 0.31mi |
| 4209 McLaughlin Ave Los Angeles, CA | 1.0 | 1.0 | 600 | $2,450 | $4.08 | 43d | 1 | 0.32mi |
| 11572 Braddock Dr Culver City, CA | 2.0 | 1.0 | 667 | $2,650 | $3.97 | 43d | 1 | 0.33mi |
| 4733 S Slauson Ave Unit 8 Culver City, CA | 1.0 | 1.0 | 544 | $2,350 | $4.32 | 24d | 1 | 0.35mi |
| 4166 Inglewood Blvd Los Angeles, CA | 1.0 | 1.0 | 800 | $1,400 | $1.75 | 43d | 1 | 0.35mi |
| 4232 Lindblade Dr Unit 1 Los Angeles, CA | 2.0 | 1.0 | 700 | $2,495 | $3.56 | 3d | 1 | 0.35mi |
| 4111 McLaughlin Ave Los Angeles, CA | 2.0 | 1.0 | 1000 | $2,595 | $2.60 | 7d | 1 | 0.39mi |
| 4081 McLaughlin Ave Los Angeles, CA | 2.0 | 1.0 | 1000 | $2,595 | $2.60 | 3d | 1 | 0.41mi |
| 4081 McLaughlin Ave Los Angeles, CA | 2.0 | 1.0 | 1000 | $2,595 | $2.60 | 22d | 1 | 0.41mi |
| 4071 McLaughlin Ave Los Angeles, CA | 1.0 | 1.0 | 842 | $2,595 | $3.08 | 43d | 3 | 0.43mi |
| 4065 McLaughlin Ave Unit 8 Los Angeles, CA | 2.0 | 1.0 | 950 | $2,250 | $2.37 | 24d | 1 | 0.44mi |
| 4065 McLaughlin Ave Unit 8 Los Angeles, CA | 2.0 | 1.0 | 950 | $2,250 | $2.37 | 43d | 1 | 0.44mi |
Listing history 3 events
-
2026-05-31status $1,275,000 Pending 40 DOM
-
2026-04-13$1,275,000 Active 2060-char remark
Show marketing remark (2060 chars)
THREE PROPERTY TRUST SALE [3674 EMPIRE DR 10 UNITS, 4253 S CENTINELA AVE 6 UNITS, 11817 CULVER BLVD 7 UNITS] 11817 Culver Blvd is a well-maintained 6-unit property plus an additional non-conforming bachelor unit (7 units in total). The property, built between 1952 & 1960, is situated along the residential side of Culver Blvd in the desirable Del Rey neighborhood. This is a Trust Sale offered for the first time in 54 years. The property totals approximately 4,807 square feet of living space on an 8,409 square foot R3-zoned lot and features a unit mix of (1) 2BR/1BA detached front house, (5) 1BR/1BA units, and (1) non-conforming bachelor unit (legal guest room). The detached front house, measuring approximately 781 square feet, has its own private fenced front yard and storage shed. The back structure containing 6 units is approximately 4,026 square feet and includes a tuck under parking area and backyard. Current rents are approximately 97% below current market, representing one of the most compelling value-add opportunities available in today's Westside apartment market. The bachelor unit operates under a RUBS arrangement, and an on-site laundry room generates supplemental income. Ownership has completed meaningful capital improvements including a fully updated electrical main and sub-panels (2023), replacement of the majority of the windows, a 100-gallon water heater, and completion of the required soft-story seismic retrofit (2021). The tuck-under parking configuration presents strong attached ADU potential (Buyer to Verify), and the R3 zoning may support additional density under current state law (Buyer to Verify). Six on-site parking spaces serve the existing resident base. Ideally positioned along Culver Boulevard with immediate 405 Freeway access and less than two miles from the beach, the property sits at the center of Silicon Beach, home to major employers including Google, Amazon Studios, Hulu, and Snap. Plus, Cedars-Sinai's new nine-story Marina del Rey Hospital is slated to open in 2026 just minutes away.
-
1968-11-01soldstatus $14,000
ⓘ Source: listings_history table (triggers on properties + properties_extension) + one-shot
backfill from property_details.listing_events for pre-trigger history.
Tax reassessment forecast CA · Resets to sale price
- Current annual tax
- $3,373 · $281/mo
- Projected year-2 tax
- $9,690 · $808/mo
- Expected delta
- +$6,317/yr (+$526/mo · 187.3%)
ⓘ Screening estimate from a state-policy table — verify with the county assessor before closing.
Climate risk First Street
- Flood 6/10 Major FEMA zone X (unshaded) · 71% chance over 30 yrs
- Wildfire 1/10 Low
- Heat 5/10 Major 7 d/yr ≥85°F today · 20 d/yr by 30 yrs out
- Wind 1/10 Low
- Air quality 4/10 Moderate 6 unhealthy d/yr today · 7 by 30 yrs out
Nearby sold comps map
Loading sold comps map…
Walkable amenities ~0.75 mi
Loading nearby amenities…
Taxation est. · year 1
- Rental income
- $186,876
- − Mortgage interest
- −$71,420
- − Property taxes
- −$3,373
- − Insurance
- −$6,375
- − Repairs & maintenance
- −$14,950
- − Management
- −$14,950
- − Depreciation
- −$37,091
- Taxable income
- $38,717
- Est. tax owed @ 24.0%
- −$9,292
- After-tax cash flow
- $48,357/yr
For passive investors: Depreciation is non-cash, so a rental often shows a tax loss while cash-flowing — sheltering income. Rental losses are passive: they offset passive income freely, and up to $25,000/yr can offset ordinary (W-2) income if you actively participate and your MAGI is under $100k (phasing out to $0 by $150k); unused losses carry forward. On sale, claimed depreciation is recaptured at up to 25%, and gains may owe capital-gains tax (a 1031 exchange can defer both). Figures are a year-1 estimate at your 24.0% rate — not tax advice; consult a CPA.
Schools (NCES district)
- District
- Los Angeles Unified
- NCES district ID
- 0622710
- Math proficiency
- 29% ▼ -4.00%
- Reading proficiency
- 54% ▲ 10.00%
- Median HH income
- $50,403
- Composite
- 35.67/100
- National rank
- #4875
- State rank
- #223 of 517 in CA
Livability — Los Angeles
- Score
- 68/100
- State rank
- #273
- US rank
- #9237
Category grades
Schools grade is shown separately in the Schools card above.
Census & demographics
- Census place
- Los Angeles, CA
- County
- Los Angeles County · 9,444,647 people
- City population
- 3,838,149
- Metro
- Los Angeles-Long Beach-Anaheim, CA
- Population (ZIP)
- 56,740
- Household income
- $114,141
- Rent vs Own
- Severe rent burden
- 3174.0
Population outlook (Los Angeles County) Hauer SSP2
- Today (2025)
- 10,940,515 people
- By 2030
- 11,256,481 · +2.9%
- By 2040
- 11,729,929 · +7.2%
- By 2050
- 11,948,407 · +9.2%
- By 2075
- 11,818,114 · +8.0%
- By 2100
- 10,842,928 · -0.9%
Race, ethnicity, and origin ACS 2023
- Neighborhood character
- Diverse neighborhood (Simpson 0.68)
- Race & ethnicity
- White 48% Hispanic / Latino 25% Asian 16% Two or more races 13% Black 5%
- Hispanic origin (detail)
- Mexican 18%
- Common ancestry
- Italian 3% Romanian 3% Scotch-Irish 2%
- Foreign-born
- 25% · Canada, China, South Korea
- Languages at home
- 63% English-only · Spanish 19% Other Indo-European 4% Chinese 4%
Political lean MEDSL · Los Angeles
- 2024 margin
- Solid D (+32.9) · D 64.8% · R 31.9% · Other 3.3%
- 2008→2024 swing
- -7.4pp toward R · 2008: 40.4pp · 2024: 32.9pp
- All cycles
- 2024: D+32.9 2020: D+44.2 2016: D+48.0 2012: D+40.0 2008: D+40.4
Not yet ingested
- Civics
- —
Market trends
- HPI YoY
- ▼ -1200.36%
- Current HPI
- 466.5309
- Rent YoY
- ▼ -0.08%
- Metro
- Los Angeles-Long Beach-Anaheim, CA
- State GDP YoY
- ▲ 3.21%
- F500 in state
- 116
Industry mix (Fortune 500 HQ in CA)
| Industry | F500 HQs | Revenue |
|---|---|---|
| Technology | 27 | $1,492B |
|
||
| Financial Services | 3 | $174B |
|
||
| Retail | 3 | $44B |
|
||
| Insurance | 3 | $26B |
|
||
| Media / Entertainment | 2 | $115B |
|
||
| Pharmaceuticals / Biotech | 2 | $62B |
|
||
Price history
+9007.1% since first listed2 events — show timeline
- 2026-04-13 Listed $1,275,000 TheMLS
- 1968-11-01 Sold (Public Records) $14,000 Public Records
Property tax history
+2.0%/yrLatest (2025): $3,373 · +2.6% YoY. Source: county tax records.
Cash-flow waterfall
monthlySold comps — $/sqft
last 12 mo · ≤1 miLoading sold comps…