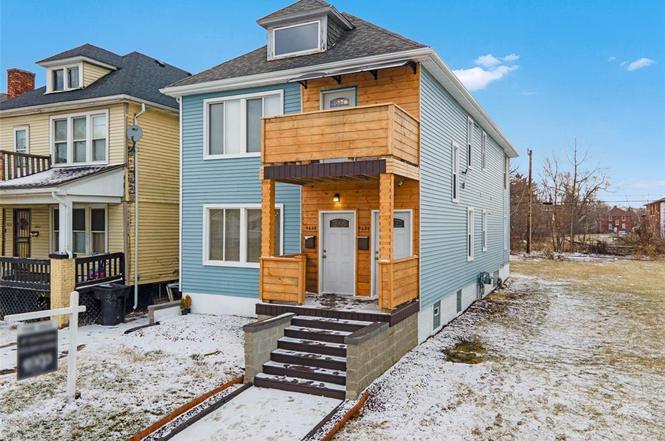
9628 Broadstreet Ave · Detroit, MI
Flood risk 1/10 · Minimal
- FEMA flood zone
- X (unshaded)
- Chance of flooding over 30 yrs
- 0.0%
- Est. flood insurance / yr
- $473 – $860
Fire risk 1/10 · Minimal
- Est. fire insurance / yr
- $784 – $1,456
Heat risk 3/10 · Minor
- Hot days now (above 97°F)
- 7 days/yr
- Hot days in 30 yrs
- 15 days/yr
Wind risk 2/10 · Minimal
- Chance of severe wind over 30 yrs
- —
Air-quality risk 4/10 · Minor
- Unhealthy air days now
- 4 days/yr
- Unhealthy air days in 30 yrs
- 6 days/yr
Risk factors via First Street. Map © Google.
Why this score? — see what drove the C grade
The composite is a weighted blend of 9 inputs, each scored 0–100. Each bar is that input's sub-score; the figure is the points it added to the 100-point composite (weight × sub-score).
- Cash flow +19.2/30.0
- Appreciation +10.0/10.0
- ARV discount +7.5/15.0
- DSCR +6.1/10.0
- 1% rule +3.8/10.0
- Livability +3.7/5.0
- Rent growth +2.5/5.0
- Condition / age +2.5/5.0
- Schools +1.3/10.0
$225,000
🖨 Deal sheet 📄 Offer letter ✓ Due diligence
Listing remarks MLS
Fully renovated two-unit multi-family offering a total of 6 bedrooms and 4 full bathrooms across 2,394 square feet. Each unit features 3 bedrooms, 2 full bathrooms, modern finishes and updated systems, making this property truly move-in ready. Large unfinished basement provides ample storage or future potential. Conveniently located near parks and schools and situated on the edge of the sought-after Boston Edison Historic District. Ideal for owner-occupants or investors seeking a turn-key opportunity.
Key facts
- 4,356 sq ft lot
- Built 1923
- Listed 55 days
Neighborhood map
What this means for you Summary
Snapshot
- This is a 6-bed/2.5-bath townhouse listed at $225k.
Deal economics
- At list price, monthly cash flow is $243 ($3k/yr) — positive.
- The deal already cash-flows at list — no discount required.
- To meet the 1% rule (rent ≥ 1% of price), the offer needs to be $199k (11.6% below list).
- Recommended offer: $199k (11.6% below list) — sets the bar for 1% rule.
- Cap rate 7.6% vs local median 10.2% in Detroit — below-typical yield; the buyer is paying a premium for something (appreciation thesis, condition, location) that the cap rate doesn't capture.
Location & tenants
- Location reads 73/100 on livability (#218 in MI) — a middle-class / working-renter tenant base. Strengths: amenities A+, commute A+, cost of living A+; Watch: schools F, crime F, employment F.
- Detroit Public Schools Community District (urban): math 10% / reading 24% proficiency, ranked #499 of 540 in MI (top 92%) — low school quality limits family demand, transient renter base, plan for 1-2y turnover; 90% free/reduced lunch — lower-income household profile, screen leases tightly.
- Market conditions: 244 active listings in the ZIP; 5 comparable units currently listed for rent nearby; rentals leasing fast (median 10d on market — plan ~1-2 weeks tenant-placement turnaround); lower-income renter base — watch delinquency; 2,639 units permitted in Wayne County in 2024 (1,216 in 5+ unit buildings).
- At $1,989/mo this rent would consume 69% of the median local household income ($34k/yr) (locally 1418% of renters already pay >50% of income on rent) — very limited rent-growth headroom before tenants either downsize or default.
Forward outlook
- In year one you build about $24k of equity ($2k loan paydown + $22k appreciation (10.0% local appreciation)).
- Wayne County population projected at -17% by 2050 — secular population decline; favor cash flow + early exit over multi-decade hold.
- At projected returns (10.0% appreciation + 3.0% rent growth), your $63k cash investment doubles in ~3 years — after that, you're playing with house money.
- By year 2, paydown + projected appreciation supports a ~$39k cash-out refi (75% LTV) — recoverable capital for the next deal without selling this one.
Negotiation context
- It's been on market 55 days — a 3% lower offer ($218k) is reasonable based on typical stale-listing flexibility.
- 2 sale attempts with the ask held roughly flat each time — persistent listings suggest the price (not the market) is what's stuck; bring a comps-based counter.
- Current owner paid $3k; list at $225k implies a 7400% gain — meaningful room to come down on a strong offer.
Risks & watch-outs
- Watch-outs: built in 1923 — expect roof / HVAC / electrical / plumbing capex.
Questions for the listing agent
- It's been on market 55 days. Have you received any prior offers? Is the seller open to a 12% concession, seller financing, or rate buy-down credit?
- Built in 1923 — when were the roof, HVAC, electrical panel, plumbing, and water heater last replaced?
- Is there a deadline driving the sale (1031 exchange, divorce, estate, relocation)? That informs how much negotiation room exists.
- Schools are F-rated, which usually means shorter tenancies and higher turnover. Who's the typical renter profile here, and what's been the actual vacancy rate?
- Crime grade is F in this area — have there been break-ins, vandalism, or insurance claims at this property in the last 3 years? What carrier currently insures it and at what premium?
- What's the average days-on-market for RENTAL listings here right now (not sales)? A rising rental-DOM trend means longer vacancies and softer asking-rent achievability than the comps imply.
- What's the recent tenant-quality profile in this submarket — average credit score on applications, eviction rate, late-payment / NSF rate, and stable-employment percentage? A property-management company in the area should have these aggregated.
- How much new for-sale + rental construction is in the pipeline within 1–3 miles? Heavy new supply typically softens prices + rents 12–24 months out; constrained supply supports both.
Investment metrics
- 1% rule
- 0.88% ✗
- Cap rate
- 7.59%
- Cash-on-cash
- 4.64%
- DSCR
- 1.21
- GRM
- 9.4
CMA / ARV
No comps found within radius.
Projected returns pro-forma
10.0% appreciation · 3.0% rent growth · sell at horizon
- IRR
- 27.6%
- Equity multiple
- 3.19×
- Total profit
- $137,934
- Equity at exit
- $202,698
- IRR
- 24.1%
- Equity multiple
- 7.25×
- Total profit
- $393,783
- Equity at exit
- $437,126
Cash invested: $63,000 (down + closing). Projections, not guarantees.
Landlord ↔ Tenant lean methodology
- Overall (STATE)
- 62 Landlord-Friendly
- State Michigan
- 62 Landlord-Friendly · EVEN
- County
- — inherits STATE
- City
- — inherits STATE
ZIP-level market 48204
- Home prices YoY
- 18.5%
- Active inventory
- 244
- Price-to-rent
- 9.4×
Monthly cashflow live
- Estimated rent
- $1,989 high interval (Pro) →
- Mortgage (P&I)
- −$1,180
- Tax from tax record
- −$54 /mo · $647/yr
- Insurance
- −$94
- HOA
- −$0
- Vacancy / Maint / Mgmt
- −$418
- Net cashflow
- $243
Break-even live
UW: 25.0% down · 7.5% · 30yr · 1.5% tax · 5.0% vac · 8.0% maint · 8.0% mgmt
Financing live
Cash to close
- Down payment
- $56,250
- Closing costs
- $6,750
- Reserves months
- —
- Total cash needed
- —
Loan-product check · same deal, 3 products live
Conventional
25% down · 7.5% · 30yr
- Down + closing
- —
- Monthly P&I
- —
- Monthly cashflow
- —
- DSCR
- —
- Eligible?
- —
Personal DTI + credit; lowest rate.
DSCR
20% down · 8.5% · 30yr
- Down + closing
- —
- Monthly P&I
- —
- Monthly cashflow
- —
- DSCR
- —
- Eligible?
- —
No personal income docs; deal must DSCR.
Hard money
10% down · 12.0% · 12mo
- Down + closing
- —
- Monthly P&I
- —
- Monthly cashflow
- —
- DSCR
- —
- Eligible?
- —
Short-term bridge; refi at stabilization.
Rent comps 5 comps
| Address | Beds | Baths | Sqft | Rent | $/sqft | DOM | Units | Dist |
|---|---|---|---|---|---|---|---|---|
| 3799 W Philadelphia St Detroit, MI | 5.0 | 2.0 | 2200 | $1,650 | $0.75 | 16d | 1 | 0.77mi |
| 2509 Gladstone St Unit NA Detroit, MI | 6.0 | 3.0 | 3008 | $2,000 | $0.66 | 10d | 1 | 1.14mi |
| 8951 La Salle Blvd Detroit, MI | 5.0 | 2.5 | 2440 | $2,500 | $1.02 | 15d | 1 | 1.18mi |
| 13225 Santa Rosa Dr Detroit, MI | 5.0 | 2.0 | 2100 | $1,700 | $0.81 | 5d | 1 | 1.31mi |
| 2028 Gladstone St Unit 1 Detroit, MI | 5.0 | 2.0 | 2500 | $2,850 | $1.14 | 3d | 1 | 1.44mi |
Listing history 13 events
-
2026-06-18days on market $225,000 Active 55 DOM
-
2026-06-17days on market $225,000 Active 54 DOM
-
2026-06-15days on market $225,000 Active 52 DOM
-
2026-06-13days on market $225,000 Active 50 DOM
-
2026-06-13statusdays on market $225,000 Active 49 DOM
-
2026-04-21status Pending 506-char remark
Show marketing remark (506 chars)
Fully renovated two-unit multi-family offering a total of 6 bedrooms and 4 full bathrooms across 2,394 square feet. Each unit features 3 bedrooms, 2 full bathrooms, modern finishes and updated systems, making this property truly move-in ready. Large unfinished basement provides ample storage or future potential. Conveniently located near parks and schools and situated on the edge of the sought-after Boston Edison Historic District. Ideal for owner-occupants or investors seeking a turn-key opportunity.
-
2026-04-21status Pending
Show marketing remark (506 chars)
Fully renovated two-unit multi-family offering a total of 6 bedrooms and 4 full bathrooms across 2,394 square feet. Each unit features 3 bedrooms, 2 full bathrooms, modern finishes and updated systems, making this property truly move-in ready. Large unfinished basement provides ample storage or future potential. Conveniently located near parks and schools and situated on the edge of the sought-after Boston Edison Historic District. Ideal for owner-occupants or investors seeking a turn-key opportunity.
-
2026-03-26historical Accepting Backup Offers 506-char remark
Show marketing remark (506 chars)
Fully renovated two-unit multi-family offering a total of 6 bedrooms and 4 full bathrooms across 2,394 square feet. Each unit features 3 bedrooms, 2 full bathrooms, modern finishes and updated systems, making this property truly move-in ready. Large unfinished basement provides ample storage or future potential. Conveniently located near parks and schools and situated on the edge of the sought-after Boston Edison Historic District. Ideal for owner-occupants or investors seeking a turn-key opportunity.
-
2026-03-26historical Active Under Contract
Show marketing remark (506 chars)
Fully renovated two-unit multi-family offering a total of 6 bedrooms and 4 full bathrooms across 2,394 square feet. Each unit features 3 bedrooms, 2 full bathrooms, modern finishes and updated systems, making this property truly move-in ready. Large unfinished basement provides ample storage or future potential. Conveniently located near parks and schools and situated on the edge of the sought-after Boston Edison Historic District. Ideal for owner-occupants or investors seeking a turn-key opportunity.
-
2026-03-06$225,000 Active 506-char remark
Show marketing remark (506 chars)
Fully renovated two-unit multi-family offering a total of 6 bedrooms and 4 full bathrooms across 2,394 square feet. Each unit features 3 bedrooms, 2 full bathrooms, modern finishes and updated systems, making this property truly move-in ready. Large unfinished basement provides ample storage or future potential. Conveniently located near parks and schools and situated on the edge of the sought-after Boston Edison Historic District. Ideal for owner-occupants or investors seeking a turn-key opportunity.
-
2026-03-06$225,000 Active
Show marketing remark (506 chars)
Fully renovated two-unit multi-family offering a total of 6 bedrooms and 4 full bathrooms across 2,394 square feet. Each unit features 3 bedrooms, 2 full bathrooms, modern finishes and updated systems, making this property truly move-in ready. Large unfinished basement provides ample storage or future potential. Conveniently located near parks and schools and situated on the edge of the sought-after Boston Edison Historic District. Ideal for owner-occupants or investors seeking a turn-key opportunity.
-
2026-03-01historical $225,000 506-char remark
Show marketing remark (506 chars)
Fully renovated two-unit multi-family offering a total of 6 bedrooms and 4 full bathrooms across 2,394 square feet. Each unit features 3 bedrooms, 2 full bathrooms, modern finishes and updated systems, making this property truly move-in ready. Large unfinished basement provides ample storage or future potential. Conveniently located near parks and schools and situated on the edge of the sought-after Boston Edison Historic District. Ideal for owner-occupants or investors seeking a turn-key opportunity.
-
1994-06-01soldstatus $3,000
ⓘ Source: listings_history table (triggers on properties + properties_extension) + one-shot
backfill from property_details.listing_events for pre-trigger history.
Tax reassessment forecast MI · Partial reset (capped growth)
- Current annual tax
- $647 · $54/mo
- Projected year-2 tax
- $2,056 · $171/mo
- Expected delta
- +$1,409/yr (+$117/mo · 217.7%)
ⓘ Screening estimate from a state-policy table — verify with the county assessor before closing.
Climate risk First Street
- Flood 1/10 Low FEMA zone X (unshaded) · 0% chance over 30 yrs
- Wildfire 1/10 Low
- Heat 3/10 Moderate 7 d/yr ≥97°F today · 15 d/yr by 30 yrs out
- Wind 2/10 Low
- Air quality 4/10 Moderate 4 unhealthy d/yr today · 6 by 30 yrs out
Nearby sold comps map
Loading sold comps map…
Walkable amenities ~0.75 mi
Loading nearby amenities…
Taxation est. · year 1
- Rental income
- $23,864
- − Mortgage interest
- −$12,603
- − Property taxes
- −$647
- − Insurance
- −$1,125
- − Repairs & maintenance
- −$1,909
- − Management
- −$1,909
- − Depreciation
- −$6,545
- Taxable loss
- −$876
- Est. tax savings @ 24.0%
- +$210
- After-tax cash flow
- $3,131/yr
For passive investors: Depreciation is non-cash, so a rental often shows a tax loss while cash-flowing — sheltering income. Rental losses are passive: they offset passive income freely, and up to $25,000/yr can offset ordinary (W-2) income if you actively participate and your MAGI is under $100k (phasing out to $0 by $150k); unused losses carry forward. On sale, claimed depreciation is recaptured at up to 25%, and gains may owe capital-gains tax (a 1031 exchange can defer both). Figures are a year-1 estimate at your 24.0% rate — not tax advice; consult a CPA.
Schools (NCES district)
- District
- Detroit Public Schools Community District
- NCES district ID
- 2601103
- Math proficiency
- 10% ▼ -2.00%
- Reading proficiency
- 24% ▲ 6.00%
- Median HH income
- $25,815
- Composite
- 13.06/100
- National rank
- #9564
- State rank
- #499 of 540 in MI
Livability — Detroit
- Score
- 73/100
- State rank
- #218
- US rank
- #5427
Category grades
Schools grade is shown separately in the Schools card above.
Census & demographics
- Census place
- Detroit, MI
- County
- Wayne County · 1,562,939 people
- City population
- 572,865
- Metro
- Detroit-Warren-Dearborn, MI
- Population (ZIP)
- 20,696
- Household income
- $34,468
- Rent vs Own
- Severe rent burden
- 1418.0
Population outlook (Wayne County) Hauer SSP2
- Today (2025)
- 1,675,273 people
- By 2030
- 1,620,300 · -3.3%
- By 2040
- 1,502,341 · -10.3%
- By 2050
- 1,384,039 · -17.4%
- By 2075
- 1,124,592 · -32.9%
- By 2100
- 881,193 · -47.4%
Race, ethnicity, and origin ACS 2023
- Neighborhood character
- Predominantly Black (86%)
- Race & ethnicity
- Black 86% Two or more races 7% Hispanic / Latino 5% White 4% Native American 2%
- Hispanic origin (detail)
- Mexican 4%
- Common ancestry
- Hispanic 1% Romanian 1%
- Foreign-born
- 2% · Canada
- Languages at home
- 95% English-only · Spanish 4%
Political lean MEDSL · Wayne
- 2024 margin
- Strong D (+29.0) · D 62.7% · R 33.7% · Other 3.6%
- 2008→2024 swing
- -20.5pp toward R · 2008: 49.5pp · 2024: 29.0pp
- All cycles
- 2024: D+29.0 2020: D+38.1 2016: D+37.3 2012: D+46.9 2008: D+49.5
Not yet ingested
- Civics
- —
Market trends
- HPI YoY
- ▲ 36.51%
- Current HPI
- 234.0465
- Rent YoY
- —
- Metro
- Detroit-Warren-Dearborn, MI
- State GDP YoY
- ▲ 1.37%
- F500 in state
- 28
Industry mix (Fortune 500 HQ in MI)
| Industry | F500 HQs | Revenue |
|---|---|---|
| Automotive Parts | 3 | $48B |
|
||
| Automotive | 2 | $372B |
|
||
| Chemicals | 1 | $45B |
|
||
| Automotive Retail | 1 | $29B |
|
||
| Healthcare / Medical Devices | 1 | $23B |
|
||
| Automotive Technology | 1 | $20B |
|
||
Price history
+7400.0% since first listed8 events — show timeline
- 2026-04-21 Pending — MiRealSource-MiMLS
- 2026-04-21 Pending — REALCOMP
- 2026-03-26 Contingent — MiRealSource-MiMLS
- 2026-03-26 Contingent — REALCOMP
- 2026-03-06 Listed $225,000 MiRealSource-MiMLS
- 2026-03-06 Listed $225,000 REALCOMP
- 2026-03-01 Coming Soon $225,000 MiRealSource-MiMLS
- 1994-06-01 Sold (Public Records) $3,000 Public Records
Property tax history
+6.0%/yrLatest (2025): $647 · +90.4% YoY. Source: county tax records.
Cash-flow waterfall
monthlySold comps — $/sqft
last 12 mo · ≤1 miLoading sold comps…