 🌊 Lakefront
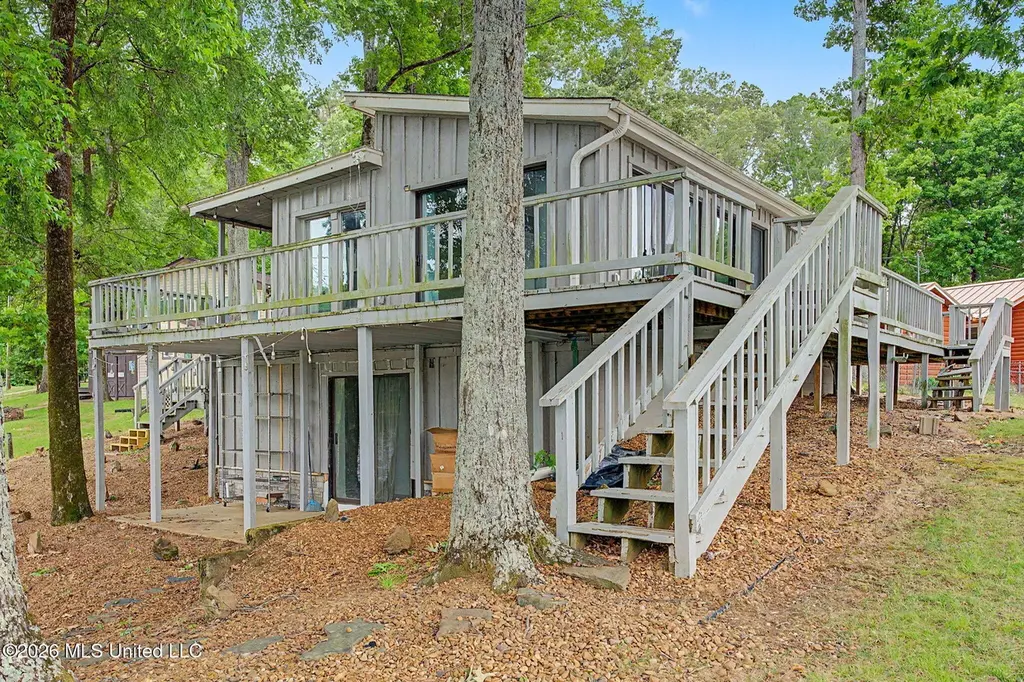
1150 S Thunderbird Dr · Coldwater, MS
Flood risk 1/10 · Minimal
- FEMA flood zone
- X (unshaded)
- Chance of flooding over 30 yrs
- 0.0%
- Est. flood insurance / yr
- $507 – $1,088
Fire risk 4/10 · Minor
- Est. fire insurance / yr
- $1,241 – $2,305
Heat risk 6/10 · Moderate
- Hot days now (above 109°F)
- 7 days/yr
- Hot days in 30 yrs
- 21 days/yr
Wind risk 4/10 · Minor
- Chance of severe wind over 30 yrs
- 21.0%
Air-quality risk 2/10 · Minimal
- Unhealthy air days now
- 1 days/yr
- Unhealthy air days in 30 yrs
- 1 days/yr
Risk factors via First Street. Map © Google.
Why this score? — see what drove the F grade
The composite is a weighted blend of 9 inputs, each scored 0–100. Each bar is that input's sub-score; the figure is the points it added to the 100-point composite (weight × sub-score).
- ARV discount +9.6/15.0
- Cash flow +8.8/30.0
- Schools +4.0/10.0
- Livability +3.2/5.0
- Condition / age +2.5/5.0
- DSCR +2.4/10.0
- Rent growth +2.4/5.0
- 1% rule +1.9/10.0
- Appreciation +0.0/10.0
$265,000
🖨 Deal sheet (PDF) 📄 Offer letter ✓ Due diligence
Listing remarks MLS
THE MOST GORGEOUS LAKE LOT AVAILABLE! LOTS OF WATER FRONTAGE INCLUDING A LITTLE PENINSULA ALL YOUR OWN! 2 PIERS WITH SEATING & EVEN THE BOATS STAY! HOME NEEDS LOTS OF TLC. PRICED $15,000 UNDER APPRAISAL FOR QUICK SALE!!
Key facts
- 0.28 acre lot
- 2 parking spots
- Community pool
Property features AI
Finance
- HOA & community: Homeowners association with annual fee of $225; Association covers grounds maintenance and pool service; Community amenities include boating, clubhouse, fishing, lake, and pool
Exterior
- Parking: 2 parking spaces; Paved parking pad
- Security: Deadbolt locks
- Utilities: Public water; Septic tank sewer; Electricity connected; Cable available; Water connected
- Home design: Single-family house; One-and-one-half levels; Asphalt shingle roof; Siding exterior; Conventional foundation
- Construction: Built with siding; Asphalt shingle roof; Conventional foundation
- Exterior features: Deck; Porch; Screened porch; Private entrance; Private yard; Few trees, landscaped and partly wooded lot; Waterfront with lakefront access and boat dock
Interior
- Kitchen: Dishwasher; Electric range; Microwave; Refrigerator
- Bedrooms: Primary bedroom on main level (approx. 20 x 11.8); Second bedroom on main level (approx. 11.5 x 11.5); Third bedroom on lower level (approx. 13 x 12); Sitting area off the great room on main level (approx. 8 x 7)
- Flooring: Carpet; Laminate; Tile; Combination flooring
- Bathrooms: 2 full bathrooms
- Heating & cooling: Central heating; Central air conditioning; Electric cooling; Ceiling fans
- Interior features: Built-in features; Cathedral ceilings; Ceiling fans; Breakfast bar; Blinds and metal window treatments; Deadbolt locks; Sliding doors; Walk-out heated and cooled basement; 6 total rooms
- Laundry & utility: Laundry room
Neighborhood map
What this means for you Summary
Snapshot
- This is a 2-bed/2.0-bath single-family listed at $265k.
Deal economics
- At list price, monthly cash flow is $-220 ($-3k/yr) — negative.
- To cash-flow at today's rent, offer at most $226k (14.7% below list).
- To meet the 1% rule (rent ≥ 1% of price), the offer needs to be $183k (30.9% below list).
- Recommended offer: $183k (30.9% below list) — sets the bar for 1% rule.
Location & tenants
- Location reads 64/100 on livability (#135 in MS) — a middle-class / working-renter tenant base. Strengths: crime A+, cost of living A+, housing A+; Watch: amenities F, commute F, employment F.
- Desoto County School District (suburban): math 48% / reading 42% proficiency, ranked #20 of 130 in MS (top 15%) — families likely to look elsewhere, expect single-tenant / working-renter base with shorter leases.
- Zoned schools: Hernando Elem (779 students, 100% FRL); Hernando Middle School (math 75% / reading 57%, grade A-, #2 of 179 statewide, top 1%, 1,150 students, 100% FRL); Hernando High School (math 69% / reading 62%, grade B, #2 of 197 statewide, top 1%, 1,419 students, 100% FRL) — zoned schools average 100% FRL vs 43% district-wide (56 pts higher); higher-poverty schools than district average — tighter screening recommended.
- Zoned-school proficiency averages 66% at this address vs 45% district-wide (+21 pts) — the actual schools serving this property are materially stronger than the Desoto County School District average implies; a family-tenant draw the district grade alone would hide.
- Market conditions: Rents soft (-0.4%/yr); 407 active listings in the ZIP; solid renter incomes; 1,155 units permitted in DeSoto County in 2024 (0 in 5+ unit buildings).
Forward outlook
- Local home prices are declining (-3.0%/yr); year-one equity from $2k of loan paydown is wiped out by about $8k of value loss. Plan a longer hold.
- DeSoto County population projected at +33% by 2050 — long-run rental-demand tailwind backs the buy-and-hold thesis.
Negotiation context
- It's been on market 36 days — a 3% lower offer ($257k) is reasonable based on typical stale-listing flexibility.
- 4 sale attempts since 21y ago; this cycle's ask has dropped $15k (5%) from the opening price — seller is motivated, your offer sets the floor, not the list.
Risks & watch-outs
- Climate carrying-cost: extreme-heat days projected 7→21/yr by 2055 (HVAC capex compounding) — expect insurance premiums to compound above CPI over the hold.
Questions for the listing agent
- What do current leases actually rent for vs. the listed asking? Can we see a recent rent roll and the last 12 months of T-12 income?
- It's been on market 36 days. Have you received any prior offers? Is the seller open to a 31% concession, seller financing, or rate buy-down credit?
- Built in 1974 — when were the roof, HVAC, electrical panel, plumbing, and water heater last replaced?
- What does the HOA fee cover, when was the last increase, and are there any pending special assessments or reserve-fund shortfalls?
- Is there a deadline driving the sale (1031 exchange, divorce, estate, relocation)? That informs how much negotiation room exists.
- Schools are F-rated, which usually means shorter tenancies and higher turnover. Who's the typical renter profile here, and what's been the actual vacancy rate?
- The area grade is low — what's the realistic commute time and amenity access for the typical tenant pool here? Any planned neighborhood developments (good or bad) we should know about?
- This sits on a lake — are riparian / water-frontage rights deeded with the parcel? Any dock permits, shoreline easements, or HOA water-use restrictions?
- What's the documented flood / surge / shoreline-erosion history here (FEMA AND non-FEMA — e.g., storm surge, creek backup, septic-field saturation)?
- Any water-quality or seasonal algae-bloom issues that affect tenant satisfaction or short-term-rental demand?
- What's the average days-on-market for RENTAL listings here right now (not sales)? A rising rental-DOM trend means longer vacancies and softer asking-rent achievability than the comps imply.
- What's the recent tenant-quality profile in this submarket — average credit score on applications, eviction rate, late-payment / NSF rate, and stable-employment percentage? A property-management company in the area should have these aggregated.
- How much new for-sale + rental construction is in the pipeline within 1–3 miles? Heavy new supply typically softens prices + rents 12–24 months out; constrained supply supports both.
Investment metrics
- 1% rule
- 0.69% ✗
- Cap rate
- 5.30%
- Cash-on-cash
- -3.56%
- DSCR
- 0.84
- GRM
- 12.1
CMA / ARV
- ARV (median comp)
- $278,093
- List price
- $265,000
- Delta
- -4.71%
- Verdict
- FAIR
- Comps
- 20 within 1.0 mi
Show comp detail 2 sales within ~0.75 mi
| Address | Dist | Beds/Ba | Sqft | Sold | Price | $/sf | Match |
|---|---|---|---|---|---|---|---|
| 614 Red Fox Cv | 0.47mi | 3/2.0 (+1) | 1,200 (+5%) | 15mo | $249,900 | $208 | 52 |
| 537 Thunderbird Dr | 0.69mi | 2/2.0 | 1,258 (+10%) | 4mo | $250,000 | $199 | 47 |
Match score weights: distance 35% · size 25% · config 20% · recency 20%. Top-matched comps best support the ARV.
Projected returns pro-forma
-3.0% appreciation · 0.0% rent growth · sell at horizon
- IRR
- -25.4%
- Equity multiple
- 0.16×
- Total profit
- $-62,405
- Equity at exit
- $39,512
- IRR
- -32.9%
- Equity multiple
- -0.26×
- Total profit
- $-93,433
- Equity at exit
- $22,912
Cash invested: $74,200 (down + closing). Projections, not guarantees.
Landlord ↔ Tenant lean methodology
- Overall (STATE)
- 90 Strongly Landlord-Friendly
- State Mississippi
- 90 Strongly Landlord-Friendly · R+11
- County
- — inherits STATE
- City
- — inherits STATE
ZIP-level market 38632
- Home prices YoY
- -31.8%
- Rents YoY
- -0.4%
- Active inventory
- 407
- Price-to-rent
- 12.1×
Monthly cashflow live
- Estimated rent
- $1,831 medium interval (Pro) →
- Mortgage (P&I)
- −$1,390
- Tax from tax record
- −$147 /mo · $1,767/yr
- Insurance
- −$110
- HOA
- −$19
- Vacancy / Maint / Mgmt
- −$384
- Net cashflow
- $-220
Break-even live
Sensitivity live
| Price | -10% $-70 | -5% $-145 | +0% $-220 | +5% $-295 | +10% $-370 |
|---|---|---|---|---|---|
| Rent | -10% $-365 | -5% $-293 | +0% $-220 | +5% $-148 | +10% $-76 |
| Rate | -1.0pp $-87 | -0.5pp $-153 | base $-220 | +0.5pp $-289 | +1.0pp $-359 |
UW: 25.0% down · 7.5% · 30yr · 1.5% tax · 5.0% vac · 8.0% maint · 8.0% mgmt
Financing live
Cash to close
- Down payment
- $66,250
- Closing costs
- $7,950
- Reserves months
- —
- Total cash needed
- —
Loan-product check · same deal, 3 products live
Conventional
25% down · 7.5% · 30yr
- Down + closing
- —
- Monthly P&I
- —
- Monthly cashflow
- —
- DSCR
- —
- Eligible?
- —
Personal DTI + credit; lowest rate.
DSCR
20% down · 8.5% · 30yr
- Down + closing
- —
- Monthly P&I
- —
- Monthly cashflow
- —
- DSCR
- —
- Eligible?
- —
No personal income docs; deal must DSCR.
Hard money
10% down · 12.0% · 12mo
- Down + closing
- —
- Monthly P&I
- —
- Monthly cashflow
- —
- DSCR
- —
- Eligible?
- —
Short-term bridge; refi at stabilization.
HOA detail
- Monthly dues
- $19 · $228/yr
- Likely covers
- water
Listing history 20 events
-
2026-06-10days on market $265,000 Active 36 DOM
-
2026-06-09days on market $265,000 Active 35 DOM
-
2026-06-08days on market $265,000 Active 34 DOM
-
2026-06-07days on market $265,000 Active 33 DOM
-
2026-06-03days on market $265,000 Active 29 DOM
-
2026-06-02days on market $265,000 Active 28 DOM
-
2026-06-01days on market $265,000 Active 27 DOM
-
2026-05-31days on market $265,000 Active 26 DOM
-
2026-05-13price $265,000 834-char remark
-
2026-05-05$279,900 Active 834-char remark
-
2016-11-16soldstatus
-
2013-08-21soldstatus
-
2009-09-24historical
-
2008-08-27$159,900
-
2006-02-10soldstatus
Show marketing remark (223 chars)
THE MOST GORGEOUS LAKE LOT AVAILABLE! LOTS OF WATER FRONTAGE INCLUDING A LITTLE PENINSULA ALL YOUR OWN! 2 PIERS WITH SEATING & EVEN THE BOATS STAY! HOME NEEDS LOTS OF TLC. PRICED $15,000 UNDER APPRAISAL FOR QUICK SALE!!
-
2006-02-10soldstatus $82,000
Show marketing remark (223 chars)
THE MOST GORGEOUS LAKE LOT AVAILABLE! LOTS OF WATER FRONTAGE INCLUDING A LITTLE PENINSULA ALL YOUR OWN! 2 PIERS WITH SEATING & EVEN THE BOATS STAY! HOME NEEDS LOTS OF TLC. PRICED $15,000 UNDER APPRAISAL FOR QUICK SALE!!
-
2006-02-10soldstatus
Show marketing remark (223 chars)
THE MOST GORGEOUS LAKE LOT AVAILABLE! LOTS OF WATER FRONTAGE INCLUDING A LITTLE PENINSULA ALL YOUR OWN! 2 PIERS WITH SEATING & EVEN THE BOATS STAY! HOME NEEDS LOTS OF TLC. PRICED $15,000 UNDER APPRAISAL FOR QUICK SALE!!
-
2006-01-25historical
-
2005-07-18$95,000
Show marketing remark (223 chars)
THE MOST GORGEOUS LAKE LOT AVAILABLE! LOTS OF WATER FRONTAGE INCLUDING A LITTLE PENINSULA ALL YOUR OWN! 2 PIERS WITH SEATING & EVEN THE BOATS STAY! HOME NEEDS LOTS OF TLC. PRICED $15,000 UNDER APPRAISAL FOR QUICK SALE!!
-
2005-07-18$95,000
Show marketing remark (223 chars)
THE MOST GORGEOUS LAKE LOT AVAILABLE! LOTS OF WATER FRONTAGE INCLUDING A LITTLE PENINSULA ALL YOUR OWN! 2 PIERS WITH SEATING & EVEN THE BOATS STAY! HOME NEEDS LOTS OF TLC. PRICED $15,000 UNDER APPRAISAL FOR QUICK SALE!!
ⓘ Source: listings_history table (triggers on properties + properties_extension) + one-shot
backfill from property_details.listing_events for pre-trigger history.
Tax reassessment forecast MS · Resets to sale price
- Current annual tax
- $1,767 · $147/mo
- Projected year-2 tax
- $2,094 · $174/mo
- Expected delta
- +$326/yr (+$27/mo · 18.4%)
ⓘ Screening estimate from a state-policy table — verify with the county assessor before closing.
Climate risk First Street
- Flood 1/10 Low FEMA zone X (unshaded) · 0% chance over 30 yrs
- Wildfire 4/10 Moderate
- Heat 6/10 Major 7 d/yr ≥109°F today · 21 d/yr by 30 yrs out
- Wind 4/10 Moderate 21% chance of damaging wind over 30 yrs
- Air quality 2/10 Low 1 unhealthy d/yr today · 1 by 30 yrs out
Nearby sold comps map
Loading sold comps map…
Walkable amenities ~0.75 mi
Loading nearby amenities…
Taxation est. · year 1
- Rental income
- $21,967
- − Mortgage interest
- −$14,844
- − Property taxes
- −$1,767
- − Insurance
- −$1,325
- − Repairs & maintenance
- −$1,757
- − Management
- −$1,757
- − HOA
- −$228
- − Depreciation
- −$7,709
- Taxable loss
- −$7,421
- Est. tax savings @ 24.0%
- +$1,781
- After-tax cash flow
- $-861/yr
For passive investors: Depreciation is non-cash, so a rental often shows a tax loss while cash-flowing — sheltering income. Rental losses are passive: they offset passive income freely, and up to $25,000/yr can offset ordinary (W-2) income if you actively participate and your MAGI is under $100k (phasing out to $0 by $150k); unused losses carry forward. On sale, claimed depreciation is recaptured at up to 25%, and gains may owe capital-gains tax (a 1031 exchange can defer both). Figures are a year-1 estimate at your 24.0% rate — not tax advice; consult a CPA.
Schools (NCES district)
- District
- Desoto County School District
- NCES district ID
- 2801320
- Math proficiency
- 48% ▼ -13.00%
- Reading proficiency
- 42% ▼ -6.00%
- Median HH income
- $59,272
- Composite
- 39.56/100
- National rank
- #3933
- State rank
- #20 of 130 in MS
Livability — Coldwater
- Score
- 64/100
- State rank
- #135
- US rank
- #14532
Category grades
Schools grade is shown separately in the Schools card above.
Census & demographics
- County
- DeSoto County · 176,513 people
- Metro
- Memphis, TN-MS-AR
- Population (ZIP)
- 31,374
- Household income
- $93,583
- Rent vs Own
- Severe rent burden
- 24.0
Population outlook (DeSoto County) Hauer SSP2
- Today (2025)
- 203,338 people
- By 2030
- 217,692 · +7.1%
- By 2040
- 245,320 · +20.6%
- By 2050
- 270,133 · +32.8%
- By 2075
- 323,341 · +59.0%
- By 2100
- 348,742 · +71.5%
Race, ethnicity, and origin ACS 2023
- Neighborhood character
- Predominantly White (81%)
- Race & ethnicity
- White 81% Black 13% Two or more races 4% Hispanic / Latino 2%
- Common ancestry
- Italian 2% Serbian 2% Slovak 1%
- Foreign-born
- 2% · Canada
- Languages at home
- 98% English-only · Spanish 1% Arabic 1%
Political lean MEDSL · DeSoto
- 2024 margin
- Strong R (+24.1) · D 36.7% · R 60.8% · Other 2.5%
- 2008→2024 swing
- +14.2pp toward D · 2008: -38.2pp · 2024: -24.1pp
- All cycles
- 2024: R+24.1 2020: R+23.9 2016: R+34.8 2012: R+33.5 2008: R+38.2
Not yet ingested
- Civics
- —
Market trends
- HPI YoY
- ▼ -82.49%
- Current HPI
- 176.8843
- Rent YoY
- ▼ -0.43%
- Metro
- Memphis, TN-MS-AR
- State GDP YoY
- —
- F500 in state
- 0
Price history
+178.9% since first listed13 events — show timeline
- 2026-06-10 Listing Removed — MLSU
- 2026-05-13 Price Changed $265,000 MLSU
- 2026-05-05 Listed $279,900 MLSU
- 2016-11-16 Sold (Public Records) — Public Records
- 2013-08-21 Sold (Public Records) — Public Records
- 2009-09-24 Listing Removed — MLSU
- 2008-08-27 Listed $159,900 MLSU
- 2006-02-10 Sold (Public Records) — Public Records
- 2006-02-10 Sold (MLS) — Memphis Area Association of Realtors(R) MLS
- 2006-02-10 Sold (MLS) — MLSU
- 2006-01-25 Delisted — Memphis Area Association of Realtors(R) MLS
- 2005-07-18 Listed $95,000 Memphis Area Association of Realtors(R) MLS
- 2005-07-18 Listed $95,000 MLSU
Property tax history
+5.5%/yrLatest (2025): $1,767 · +14.4% YoY. Source: county tax records.
Cash-flow waterfall
monthlySold comps — $/sqft
last 12 mo · ≤1 miLoading sold comps…