 🏗️ New Construction
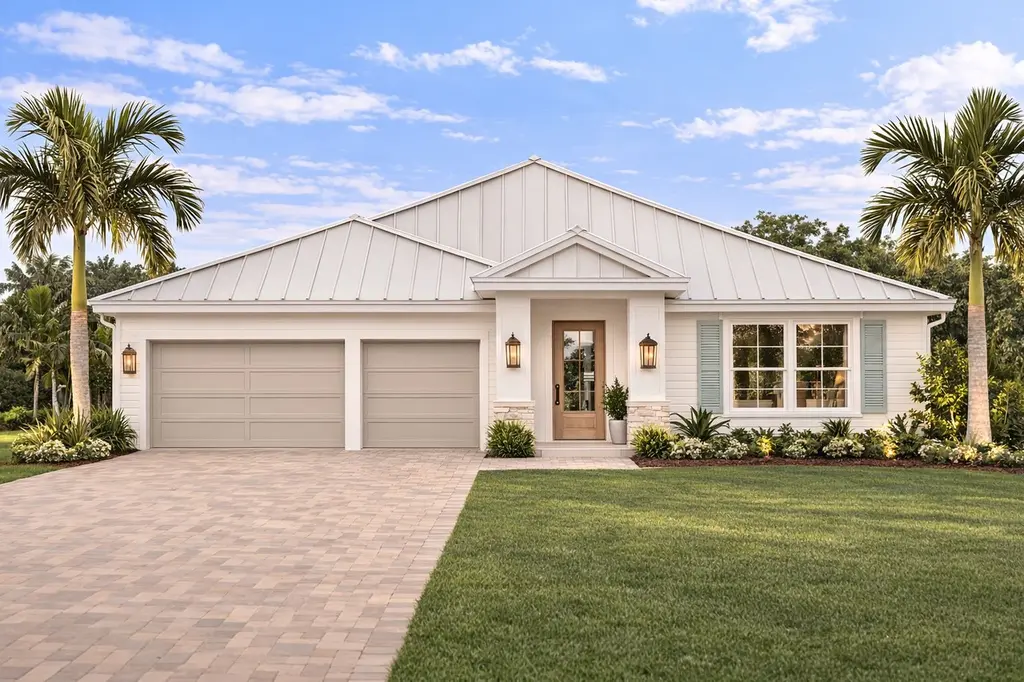
Aria Residence Plan · Burnt Store Marina, FL
Flood risk 9/10 · Severe
- FEMA flood zone
- AE
- Chance of flooding over 30 yrs
- 0.99%
- Est. flood insurance / yr
- $1,737 – $8,500
Fire risk 5/10 · Moderate
- Est. fire insurance / yr
- $947 – $1,759
Heat risk 10/10 · Severe
- Hot days now (above 107°F)
- 8 days/yr
- Hot days in 30 yrs
- 35 days/yr
Wind risk 10/10 · Severe
- Chance of severe wind over 30 yrs
- 99.0%
Air-quality risk 2/10 · Minimal
- Unhealthy air days now
- 1 days/yr
- Unhealthy air days in 30 yrs
- 2 days/yr
Risk factors via First Street. Map © Google.
Why this score? — see what drove the C grade
The composite is a weighted blend of 9 inputs, each scored 0–100. Each bar is that input's sub-score; the figure is the points it added to the 100-point composite (weight × sub-score).
- Cash flow +21.7/30.0
- ARV discount +7.5/15.0
- DSCR +6.9/10.0
- 1% rule +5.7/10.0
- Schools +4.6/10.0
- Condition / age +4.0/5.0
- Livability +3.6/5.0
- Rent growth +2.5/5.0
- Appreciation +0.0/10.0
$549,900
🖨 Deal sheet 📄 Offer letter ✓ Due diligence
Listing remarks
This thoughtfully designed custom home by Cloud Design Build combines architectural character, refined interior spaces, and the flexibility to personalize the home to reflect your individual style. The design can be executed in a modern coastal style or adapted to a more contemporary architectural approach, giving buyers the opportunity to shape the home around their preferences. The floor plan offers four bedrooms, with one easily serving as a home office, guest room, or flex space depending on your needs. An open-concept layout connects the kitchen, dining, and living areas, creating a bright and welcoming environment suited for both everyday living and entertaining. Interior features inc
Key facts
- Custom home
- Covered lanai
- Open-concept layout
Tags
Property features AI
Finance
- Financial info: List price $549,900
Exterior
- Parking: 3 total parking spaces; 3-car garage
- Home design: Single-family residence (Aria Residence plan)
- Exterior features: Living area of approximately 2,100 (plan)
Interior
- Bedrooms: 4 bedrooms
- Bathrooms: 3 bathrooms
- Interior features: Plan: Aria Residence (new construction plan)
Neighborhood map
What this means for you Summary
Snapshot
- This is a 4-bed/3.0-bath single-family listed at $550k. Condition is rated good.
Deal economics
- At list price, monthly cash flow is $322 ($4k/yr) — positive.
- To cash-flow at today's rent, offer at most $536k (2.6% below list).
- To meet the 1% rule (rent ≥ 1% of price), the offer needs to be $523k (4.9% below list).
- Recommended offer: $523k (4.9% below list) — sets the bar for 1% rule.
- Cap rate 8.1% vs local median 4.8% in Burnt Store Marina — top-decile yield for the area; either an underpriced asset or a hidden risk that comps aren't pricing in. Stress-test before assuming the spread holds.
Location & tenants
- Location reads 72/100 on livability (#354 in FL) — a middle-class / working-renter tenant base. Strengths: crime A+, employment A+, housing A+; Watch: schools C-, cost of living C-, amenities F.
- Charlotte (suburban): math 54% / reading 54% proficiency, ranked #22 of 73 in FL (top 30%) — acceptable for families but not a draw, mixed tenant base, ~2y average lease.
- Market conditions: 1481 active listings in the ZIP; 14 comparable units currently listed for rent nearby; rentals at typical pace (median 24d on market — plan ~3-4 weeks tenant-placement turnaround); solid renter incomes; 4,585 units permitted in Charlotte County in 2024 (703 in 5+ unit buildings).
- At $5,228/mo this rent would consume 82% of the median local household income ($77k/yr) (locally 226% of renters already pay >50% of income on rent) — very limited rent-growth headroom before tenants either downsize or default.
Forward outlook
- Local home prices are declining (-3.0%/yr); year-one equity from $3k of loan paydown is wiped out by about $15k of value loss. Plan a longer hold.
- Charlotte County population projected at +24% by 2050 — long-run rental-demand tailwind backs the buy-and-hold thesis.
Negotiation context
- It's been on market 27 days — a 2% lower offer ($542k) is reasonable based on typical stale-listing flexibility.
Risks & watch-outs
- Watch-outs: flood insurance adds $427/mo.
- Climate carrying-cost: in FEMA flood zone AE (mandatory federal flood insurance); severe wind risk, 99% chance of damaging wind over 30y; moderate wildfire risk; extreme-heat days projected 8→35/yr by 2055 (HVAC capex compounding) — expect insurance premiums to compound above CPI over the hold.
Questions for the listing agent
- What's the actual annual flood-insurance premium (NFIP or private), and is the property in a SFHA with mandatory coverage?
- Is there a deadline driving the sale (1031 exchange, divorce, estate, relocation)? That informs how much negotiation room exists.
- This sits on a lake — are riparian / water-frontage rights deeded with the parcel? Any dock permits, shoreline easements, or HOA water-use restrictions?
- What's the documented flood / surge / shoreline-erosion history here (FEMA AND non-FEMA — e.g., storm surge, creek backup, septic-field saturation)?
- Any water-quality or seasonal algae-bloom issues that affect tenant satisfaction or short-term-rental demand?
- What's the average days-on-market for RENTAL listings here right now (not sales)? A rising rental-DOM trend means longer vacancies and softer asking-rent achievability than the comps imply.
- What's the recent tenant-quality profile in this submarket — average credit score on applications, eviction rate, late-payment / NSF rate, and stable-employment percentage? A property-management company in the area should have these aggregated.
- How much new for-sale + rental construction is in the pipeline within 1–3 miles? Heavy new supply typically softens prices + rents 12–24 months out; constrained supply supports both.
Investment metrics
- 1% rule
- 1.07% ✓
- Cap rate
- 8.13%
- Cash-on-cash
- 6.56%
- DSCR
- 1.29
- GRM
- 7.8
CMA / ARV
- ARV (on-the-fly)
- $489,300
- Comps found
- 11
Show comp detail 11 sales within ~0.75 mi
| Address | Dist | Beds/Ba | Sqft | Sold | Price | $/sf | Match |
|---|---|---|---|---|---|---|---|
| 17313 Muscat Ln | 0.49mi | 4/2.0 | 1,973 (-6%) | 4mo | $432,000 | $219 | 59 |
| 17261 Naiad Ct | 0.39mi | 4/3.0 | 2,351 (+12%) | 4mo | $373,000 | $159 | 59 |
| 17533 Megra Ct | 0.38mi | 3/2.0 (-1) | 2,094 (-0%) | 22mo | $560,000 | $267 | 54 |
| 24228 Peppercorn Rd | 0.47mi | 3/2.0 (-1) | 2,099 (-0%) | 20mo | $465,000 | $222 | 52 |
| 17139 Anthem Ln | 0.63mi | 3/2.0 (-1) | 1,995 (-5%) | 1mo | $465,000 | $233 | 52 |
| 17320 Comingo Ln | 0.52mi | 4/3.0 | 2,351 (+12%) | 13mo | $460,000 | $196 | 45 |
| 24378 Peppercorn Rd | 0.51mi | 3/2.0 (-1) | 2,305 (+10%) | 9mo | $650,000 | $282 | 44 |
| 17199 Anthem Ln | 0.55mi | 3/3.0 (-1) | 2,259 (+8%) | 16mo | $750,000 | $332 | 43 |
| 17458 Medillin Ct | 0.50mi | 3/2.0 (-1) | 2,175 (+4%) | 23mo | $433,400 | $199 | 43 |
| 1040 Matecumbe Key Rd | 0.56mi | 4/3.5 | 2,359 (+12%) | 17mo | $1,030,000 | $437 | 37 |
| 24195 Savory Ln | 0.75mi | 3/2.5 (-1) | 1,961 (-7%) | 23mo | $665,000 | $339 | 28 |
Match score weights: distance 35% · size 25% · config 20% · recency 20%. Top-matched comps best support the ARV.
Projected returns pro-forma
-3.0% appreciation · 3.0% rent growth · sell at horizon
- IRR
- -11.8%
- Equity multiple
- 0.57×
- Total profit
- $-58,448
- Equity at exit
- $72,956
- IRR
- -2.5%
- Equity multiple
- 0.83×
- Total profit
- $-23,114
- Equity at exit
- $42,306
Cash invested: $137,004 (down + closing). Projections, not guarantees.
Landlord ↔ Tenant lean methodology
- Overall (STATE)
- 87 Strongly Landlord-Friendly
- State Florida
- 87 Strongly Landlord-Friendly · R+3
- County
- — inherits STATE
- City
- — inherits STATE
ZIP-level market 33955
- Home prices YoY
- -24.5%
- Active inventory
- 1481
- Price-to-rent
- 8.8×
Monthly cashflow live
- Estimated rent
- $5,228 high interval (Pro) →
- Mortgage (P&I)
- −$2,566
- Tax est. 1.5%
- −$612 /mo · $7,340/yr
- Insurance
- −$204
- Flood insurance flood zone
- −$427 /mo · $5,118/yr
- HOA
- −$0
- Vacancy / Maint / Mgmt
- −$1,098
- Net cashflow
- $322
Break-even live
UW: 25.0% down · 7.5% · 30yr · 1.5% tax · 5.0% vac · 8.0% maint · 8.0% mgmt
Financing live
Cash to close
- Down payment
- $122,325
- Closing costs
- $14,679
- Reserves months
- —
- Total cash needed
- —
Loan-product check · same deal, 3 products live
Conventional
25% down · 7.5% · 30yr
- Down + closing
- —
- Monthly P&I
- —
- Monthly cashflow
- —
- DSCR
- —
- Eligible?
- —
Personal DTI + credit; lowest rate.
DSCR
20% down · 8.5% · 30yr
- Down + closing
- —
- Monthly P&I
- —
- Monthly cashflow
- —
- DSCR
- —
- Eligible?
- —
No personal income docs; deal must DSCR.
Hard money
10% down · 12.0% · 12mo
- Down + closing
- —
- Monthly P&I
- —
- Monthly cashflow
- —
- DSCR
- —
- Eligible?
- —
Short-term bridge; refi at stabilization.
Rent comps 14 comps
| Address | Beds | Baths | Sqft | Rent | $/sqft | DOM | Units | Dist |
|---|---|---|---|---|---|---|---|---|
| 17434 Oro Ct Punta Gorda, FL | 3.0 | 2.5 | 1864 | $2,000 | $1.07 | 21d | 1 | 0.23mi |
| 17314 Cape Horn Blvd Punta Gorda, FL | 3.0 | 2.0 | 2216 | $2,800 | $1.26 | 13d | 1 | 0.26mi |
| 17849 Hibiscus Cove Ct #1 Punta Gorda, FL | 3.0 | 2.0 | 1937 | $6,250 | $3.23 | 23d | 1 | 0.66mi |
| 3001 King Tarpon Dr Punta Gorda, FL | 3.0 | 2.0 | 1734 | $5,500 | $3.17 | 23d | 1 | 0.79mi |
| 2091 King Tarpon Dr Punta Gorda, FL | 3.0 | 2.0 | 1640 | $5,200 | $3.17 | 23d | 1 | 0.79mi |
| 1010 Islamorada Blvd Punta Gorda, FL | 3.0 | 2.0 | 1592 | $4,700 | $2.95 | 23d | 1 | 0.80mi |
| 2060 Matecumbe Key Rd Punta Gorda, FL | 2.0–3.0 | 2.0 | 1271 | $5,400 | $4.25 | 23d | 3 | 0.80mi |
| 3471 Sunset Key Cir #102 Punta Gorda, FL | 3.0 | 2.0 | 1991 | $5,750 | $2.89 | 23d | 1 | 0.94mi |
| 3304 Sunset Key Cir Unit D Punta Gorda, FL | 3.0 | 2.0 | 2255 | $5,750 | $2.55 | 23d | 1 | 1.06mi |
| 3313 Sunset Key Cir Punta Gorda, FL | 3.0 | 2.0–3.0 | 2089 | $6,750 | $3.23 | 23d | 4 | 1.10mi |
| 3250 Southshore Dr Unit 54B Punta Gorda, FL | 3.0 | 2.0 | 2069 | $5,750 | $2.78 | 23d | 1 | 1.21mi |
| 3270 Southshore Dr Unit 72B Punta Gorda, FL | 3.0 | 2.0 | 2069 | $5,750 | $2.78 | 23d | 1 | 1.22mi |
| 3280 Southshore Dr Unit 87A Punta Gorda, FL | 3.0 | 2.0 | 2069 | $4,000 | $1.93 | 23d | 1 | 1.25mi |
| 24378 Belize Ct Punta Gorda, FL | 4.0 | 2.5 | 2251 | $6,750 | $3.00 | 21d | 1 | 1.49mi |
Listing history 14 events
-
2026-06-18days on market $549,900 Active 27 DOM
-
2026-06-17days on market $549,900 Active 26 DOM
-
2026-06-16days on market $549,900 Active 25 DOM
-
2026-06-15days on market $549,900 Active 24 DOM
-
2026-06-14days on market $549,900 Active 22 DOM
-
2026-06-13days on market $549,900 Active 21 DOM
-
2026-06-10days on market $549,900 Active 19 DOM
-
2026-06-09days on market $549,900 Active 18 DOM
-
2026-06-08days on market $549,900 Active 17 DOM
-
2026-06-05days on market $549,900 Active 13 DOM
-
2026-06-02days on market $549,900 Active 11 DOM
-
2026-06-01days on market $549,900 Active 10 DOM
-
2026-05-31days on market $549,900 Active 9 DOM
-
2026-05-30days on market $549,900 Active 8 DOM
ⓘ Source: listings_history table (triggers on properties + properties_extension) + one-shot
backfill from property_details.listing_events for pre-trigger history.
Climate risk First Street
- Flood 9/10 Extreme FEMA zone AE · 99% chance over 30 yrs
- Wildfire 5/10 Major
- Heat 10/10 Extreme 8 d/yr ≥107°F today · 35 d/yr by 30 yrs out
- Wind 10/10 Extreme 99% chance of damaging wind over 30 yrs
- Air quality 2/10 Low 1 unhealthy d/yr today · 2 by 30 yrs out
Nearby sold comps map
Loading sold comps map…
Walkable amenities ~0.75 mi
Loading nearby amenities…
Taxation est. · year 1
- Rental income
- $62,732
- − Mortgage interest
- −$27,408
- − Property taxes
- −$7,340
- − Insurance
- −$7,565
- − Repairs & maintenance
- −$5,019
- − Management
- −$5,019
- − Depreciation
- −$14,234
- Taxable loss
- −$3,852
- Est. tax savings @ 24.0%
- +$925
- After-tax cash flow
- $4,787/yr
For passive investors: Depreciation is non-cash, so a rental often shows a tax loss while cash-flowing — sheltering income. Rental losses are passive: they offset passive income freely, and up to $25,000/yr can offset ordinary (W-2) income if you actively participate and your MAGI is under $100k (phasing out to $0 by $150k); unused losses carry forward. On sale, claimed depreciation is recaptured at up to 25%, and gains may owe capital-gains tax (a 1031 exchange can defer both). Figures are a year-1 estimate at your 24.0% rate — not tax advice; consult a CPA.
Condition & rehab AI · 2 photos
This custom home by Cloud Design Build is in good condition with a good exterior and landscaping. A fresh coat of paint and some landscaping improvements could significantly enhance its value.
Value-add opportunities
- Both Painting the exterior — Fresh paint can enhance curb appeal and property value.
- Both Landscaping improvements — Enhancing the landscaping can improve the property's aesthetic and attract more potential buyers or renters.
Renovation cost estimate screening
Value-add ROI direction
- Both Painting the exterior — Fresh paint can enhance curb appeal and property value. ↑
- Both Landscaping improvements — Enhancing the landscaping can improve the property's aesthetic and attract more potential buyers or renters. ↑
ⓘ Cost ranges are severity-bucket heuristics (US national rule-of-thumb). Get contractor quotes + a written scope before underwriting a rehab budget.
Schools (NCES district)
- District
- Charlotte
- NCES district ID
- 1200240
- Math proficiency
- 54% ▼ -6.00%
- Reading proficiency
- 54% ▼ -1.00%
- Median HH income
- $44,864
- Composite
- 45.62/100
- National rank
- #2586
- State rank
- #22 of 73 in FL
Livability — Burnt Store Marina
- Score
- 72/100
- State rank
- #354
- US rank
- #6145
Category grades
Schools grade is shown separately in the Schools card above.
Census & demographics
- County
- Charlotte County · 196,994 people
- City population
- 68,831
- Metro
- Punta Gorda, FL
- Population (ZIP)
- 12,399
- Household income
- $76,943
- Rent vs Own
- Severe rent burden
- 226.0
Population outlook (Charlotte County) Hauer SSP2
- Today (2025)
- 198,646 people
- By 2030
- 210,507 · +6.0%
- By 2040
- 230,857 · +16.2%
- By 2050
- 247,148 · +24.4%
- By 2075
- 281,777 · +41.8%
- By 2100
- 293,609 · +47.8%
Race, ethnicity, and origin ACS 2023
- Neighborhood character
- Predominantly White (84%)
- Race & ethnicity
- White 84% Hispanic / Latino 10% Two or more races 9% Black 2%
- Hispanic origin (detail)
- Mexican 4% Puerto Rican 2% Cuban 4%
- Common ancestry
- Romanian 5% Italian 3% Serbian 3%
- Foreign-born
- 8% · Canada
- Languages at home
- 91% English-only · Spanish 5% Other Indo-European 1%
Political lean MEDSL · Charlotte
- 2024 margin
- Solid R (+34.0) · D 32.7% · R 66.7%
- 2008→2024 swing
- -26.7pp toward R · 2008: -7.2pp · 2024: -34.0pp
- All cycles
- 2024: R+34.0 2020: R+26.6 2016: R+27.8 2012: R+14.3 2008: R+7.2
Not yet ingested
- Civics
- —
Market trends
- HPI YoY
- ▼ -78.71%
- Current HPI
- 242.9043
- Rent YoY
- —
- Metro
- Punta Gorda, FL
- State GDP YoY
- ▲ 3.28%
- F500 in state
- 36
Industry mix (Fortune 500 HQ in FL)
| Industry | F500 HQs | Revenue |
|---|---|---|
| Industrial Technology | 2 | $29B |
|
||
| Insurance | 2 | $17B |
|
||
| Retail | 1 | $60B |
|
||
| Technology Distribution | 1 | $58B |
|
||
| Homebuilding | 1 | $35B |
|
||
| Technology Manufacturing | 1 | $35B |
|
||
Cash-flow waterfall
monthlySold comps — $/sqft
last 12 mo · ≤1 miLoading sold comps…