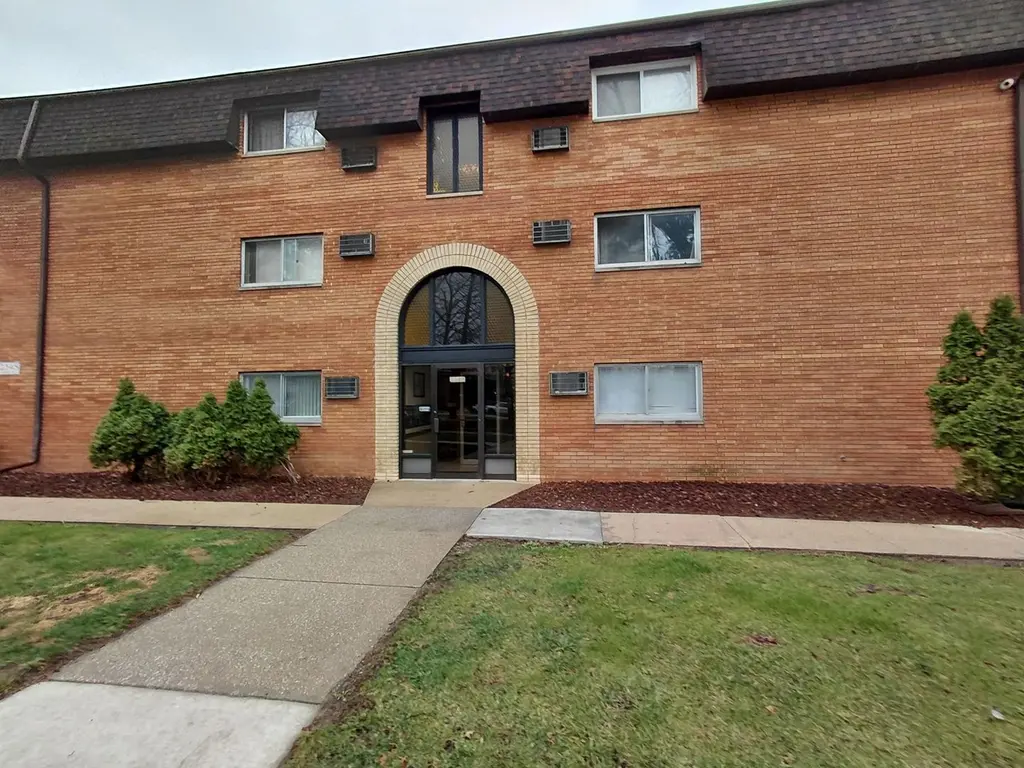
2345 185th Ct #27 · Lansing, IL
Flood risk 1/10 · Minimal
- FEMA flood zone
- X (unshaded)
- Chance of flooding over 30 yrs
- 0.0%
- Est. flood insurance / yr
- $507 – $1,088
Fire risk 3/10 · Minor
- Est. fire insurance / yr
- $804 – $1,492
Heat risk 3/10 · Minor
- Hot days now (above 102°F)
- 7 days/yr
- Hot days in 30 yrs
- 15 days/yr
Wind risk 2/10 · Minimal
- Chance of severe wind over 30 yrs
- 0.0%
Air-quality risk 4/10 · Minor
- Unhealthy air days now
- 4 days/yr
- Unhealthy air days in 30 yrs
- 5 days/yr
Risk factors via First Street. Map © Google.
Why this score? — see what drove the B- grade
The composite is a weighted blend of 9 inputs, each scored 0–100. Each bar is that input's sub-score; the figure is the points it added to the 100-point composite (weight × sub-score).
- Cash flow +30.0/30.0
- 1% rule +10.0/10.0
- DSCR +10.0/10.0
- ARV discount +7.5/15.0
- Livability +3.7/5.0
- Rent growth +2.5/5.0
- Condition / age +2.5/5.0
- Schools +1.0/10.0
- Appreciation +0.0/10.0
$40,000
🖨 Deal sheet (PDF) 📄 Offer letter ✓ Due diligence
Listing remarks MLS
1 bedroom, 1 bathroom condo with balcony overlooking courtyard. Property being sold as is. Proof of funds or letter from bank/mtg company required. Addendums required - access via mls. This property is eligible under the Freddie Mac First Look Initiative through 08/28/2014. This building only allows owner occupants.
Key facts
- Private balcony
- Courtyard
- $238 HOA
Tags
Property features AI
Finance
- Other: Not currently leased; Parcel number available; Directions: Torrence to 185th Street, building on corner
- HOA & community: Monthly association fee of $238; Association covers water, insurance, exterior maintenance, lawn care, scavenger (trash), and snow removal; Pets not allowed
Exterior
- Parking: One parking space (total)
- Utilities: Public water; Public sewer; Natural gas heating
- Home design: Attached single condo; Fee simple ownership; Entry level: 3
- Construction: Brick construction; Estimated age: 51–60 years; Built before 1978
- Exterior features: Corner building location; Lot dimensions listed as 600
Interior
- Kitchen: Kitchen on main level
- Bedrooms: Master bedroom on main level; Additional bedrooms (2) — listed as Bedroom 2 and Bedroom 3
- Bathrooms: One full bathroom
- Interior features: Three total rooms
- Laundry & utility: Laundry room
Neighborhood map
What this means for you Summary
Snapshot
- This is a 1-bed/1.0-bath condo listed at $40k.
Deal economics
- At list price, monthly cash flow is $403 ($5k/yr) — positive.
- The deal already cash-flows at list — no discount required.
- Meets the 1% rule at list price ($1k rent vs $40k).
- Recommended offer: $38k (6.0% below list) — sets the bar for market timing.
- Cap rate 18.4% vs local median 5.8% in Lansing — top-decile yield for the area; either an underpriced asset or a hidden risk that comps aren't pricing in. Stress-test before assuming the spread holds.
Location & tenants
- Location reads 73/100 on livability (#296 in IL) — a middle-class / working-renter tenant base. Strengths: commute A+, cost of living A+, housing A+; Watch: schools D+, crime D+, health & safety D+.
- Thornton Fractional Twp Hsd 215 (suburban): math 9% / reading 13% proficiency, ranked #563 of 620 in IL (top 91%) — low school quality limits family demand, transient renter base, plan for 1-2y turnover.
- Market conditions: 132 active listings in the ZIP; 4 comparable units currently listed for rent nearby; rentals at typical pace (median 25d on market — plan ~3-4 weeks tenant-placement turnaround); solid renter incomes; 6,272 units permitted in Cook County in 2024 (4,658 in 5+ unit buildings).
Forward outlook
- Local home prices are declining (-3.0%/yr); year-one equity from $277 of loan paydown is wiped out by about $1k of value loss. Plan a longer hold.
- At projected returns (-3.0% appreciation + 3.0% rent growth), your $11k cash investment doubles in ~3 years — after that, you're playing with house money.
Negotiation context
- It's been on market 68 days — a 6% lower offer ($38k) is reasonable based on typical stale-listing flexibility.
- 4 sale attempts since 12y ago; this cycle's ask has dropped $10k (20%) from the opening price — seller is motivated, your offer sets the floor, not the list.
- Current owner paid $9k; list at $40k implies a 344% gain — meaningful room to come down on a strong offer.
Risks & watch-outs
- Watch-outs: HOA is 21% of rent.
Questions for the listing agent
- It's been on market 68 days. Have you received any prior offers? Is the seller open to a 6% concession, seller financing, or rate buy-down credit?
- Built in 1968 — when were the roof, HVAC, electrical panel, plumbing, and water heater last replaced?
- What does the HOA fee cover, when was the last increase, and are there any pending special assessments or reserve-fund shortfalls?
- Any open or pending special assessments — roof, HVAC, plumbing, elevator, façade? What's the per-unit balance and payoff schedule, and is the seller paying it off at close or rolling it to the buyer?
- Why hasn't it sold? Are there any deal-killer items the seller is aware of (foundation, flood, title, zoning, code violations)?
- Is there a deadline driving the sale (1031 exchange, divorce, estate, relocation)? That informs how much negotiation room exists.
- Schools are D-rated, which usually means shorter tenancies and higher turnover. Who's the typical renter profile here, and what's been the actual vacancy rate?
- Crime grade is D in this area — have there been break-ins, vandalism, or insurance claims at this property in the last 3 years? What carrier currently insures it and at what premium?
- What's the average days-on-market for RENTAL listings here right now (not sales)? A rising rental-DOM trend means longer vacancies and softer asking-rent achievability than the comps imply.
- What's the recent tenant-quality profile in this submarket — average credit score on applications, eviction rate, late-payment / NSF rate, and stable-employment percentage? A property-management company in the area should have these aggregated.
- How much new apartment / multifamily construction is in the pipeline within 1–3 miles? Heavy new supply (>2% of stock underway) typically softens rents 12–24 months out; light construction supports rent growth.
Investment metrics
- 1% rule
- 2.88% ✓
- Cap rate
- 18.39%
- Cash-on-cash
- 43.19%
- DSCR
- 2.92
- GRM
- 2.9
CMA / ARV
No comps found within radius.
Projected returns pro-forma
-3.0% appreciation · 3.0% rent growth · sell at horizon
- IRR
- 40.2%
- Equity multiple
- 2.73×
- Total profit
- $19,350
- Equity at exit
- $5,964
- IRR
- 46.6%
- Equity multiple
- 5.51×
- Total profit
- $50,550
- Equity at exit
- $3,458
Cash invested: $11,200 (down + closing). Projections, not guarantees.
Landlord ↔ Tenant lean methodology
- Overall (STATE)
- 43 Moderately Tenant-Leaning
- State Illinois
- 43 Moderately Tenant-Leaning · D+7
- County
- — inherits STATE
- City
- — inherits STATE
ZIP-level market 60438
- Active inventory
- 132
- Price-to-rent
- 2.9×
Monthly cashflow live
- Estimated rent
- $1,150 medium interval (Pro) →
- Mortgage (P&I)
- −$210
- Tax from tax record
- −$41 /mo · $493/yr
- Insurance
- −$17
- HOA
- −$238
- Vacancy / Maint / Mgmt
- −$242
- Net cashflow
- $403
Break-even live
Sensitivity live
| Price | -10% $426 | -5% $414 | +0% $403 | +5% $392 | +10% $380 |
|---|---|---|---|---|---|
| Rent | -10% $312 | -5% $358 | +0% $403 | +5% $449 | +10% $494 |
| Rate | -1.0pp $423 | -0.5pp $413 | base $403 | +0.5pp $393 | +1.0pp $382 |
UW: 25.0% down · 7.5% · 30yr · 1.5% tax · 5.0% vac · 8.0% maint · 8.0% mgmt
Financing live
Cash to close
- Down payment
- $10,000
- Closing costs
- $1,200
- Reserves months
- —
- Total cash needed
- —
Loan-product check · same deal, 3 products live
Conventional
25% down · 7.5% · 30yr
- Down + closing
- —
- Monthly P&I
- —
- Monthly cashflow
- —
- DSCR
- —
- Eligible?
- —
Personal DTI + credit; lowest rate.
DSCR
20% down · 8.5% · 30yr
- Down + closing
- —
- Monthly P&I
- —
- Monthly cashflow
- —
- DSCR
- —
- Eligible?
- —
No personal income docs; deal must DSCR.
Hard money
10% down · 12.0% · 12mo
- Down + closing
- —
- Monthly P&I
- —
- Monthly cashflow
- —
- DSCR
- —
- Eligible?
- —
Short-term bridge; refi at stabilization.
Rent comps 4 comps
| Address | Beds | Baths | Sqft | Rent | $/sqft | DOM | Units | Dist |
|---|---|---|---|---|---|---|---|---|
| 18423 Torrence Ave Apt 3 Lansing, IL | 2.0 | 1.0 | 500 | $1,300 | $2.60 | 25d | 1 | 0.10mi |
| 18423 Torrence Ave Unit 2 Lansing, IL | 1.0 | 1.0 | 500 | $1,000 | $2.00 | 25d | 1 | 0.10mi |
| 2441 Indiana Ave Unit 2N Lansing, IL | 1.0 | 1.0 | 600 | $975 | $1.62 | 13d | 1 | 0.50mi |
| 2441 Indiana Ave Lansing, IL | 1.0 | 1.0 | 600 | $975 | $1.62 | 4d | 1 | 0.50mi |
HOA detail condo
- Monthly dues
- $238 · $2,856/yr
- Assessments
- None detected in remarks — confirm with the listing agent.
Listing history 20 events
-
2026-06-13statusdays on market $40,000 Pending 68 DOM
-
2026-06-09days on market $40,000 Contingent - No Showings 66 DOM
-
2026-06-08days on market $40,000 Contingent - No Showings 65 DOM
-
2026-06-07days on market $40,000 Contingent - No Showings 64 DOM
-
2026-06-04days on market $40,000 Contingent - No Showings 61 DOM
-
2026-06-03days on market $40,000 Contingent - No Showings 60 DOM
-
2026-06-02days on market $40,000 Contingent - No Showings 59 DOM
-
2026-06-01days on market $40,000 Contingent - No Showings 58 DOM
-
2026-05-31days on market $40,000 Contingent - No Showings 57 DOM
-
2026-05-07historical Contingent - No Showings
-
2026-05-07status Active
-
2026-05-05status Pending
-
2026-04-24price $40,000
-
2026-04-02$50,000 Active
-
2014-09-23soldstatus $9,000 Closed Sale 319-char remark
Show marketing remark (319 chars)
1 bedroom, 1 bathroom condo with balcony overlooking courtyard. Property being sold as is. Proof of funds or letter from bank/mtg company required. Addendums required - access via mls. This property is eligible under the Freddie Mac First Look Initiative through 08/28/2014. This building only allows owner occupants.
-
2014-09-04status Pending 319-char remark
Show marketing remark (319 chars)
1 bedroom, 1 bathroom condo with balcony overlooking courtyard. Property being sold as is. Proof of funds or letter from bank/mtg company required. Addendums required - access via mls. This property is eligible under the Freddie Mac First Look Initiative through 08/28/2014. This building only allows owner occupants.
-
2014-08-08historical
Show marketing remark (319 chars)
1 bedroom, 1 bathroom condo with balcony overlooking courtyard. Property being sold as is. Proof of funds or letter from bank/mtg company required. Addendums required - access via mls. This property is eligible under the Freddie Mac First Look Initiative through 08/28/2014. This building only allows owner occupants.
-
2014-08-08$9,900 New 319-char remark
Show marketing remark (319 chars)
1 bedroom, 1 bathroom condo with balcony overlooking courtyard. Property being sold as is. Proof of funds or letter from bank/mtg company required. Addendums required - access via mls. This property is eligible under the Freddie Mac First Look Initiative through 08/28/2014. This building only allows owner occupants.
-
2014-08-08New
Show marketing remark (319 chars)
1 bedroom, 1 bathroom condo with balcony overlooking courtyard. Property being sold as is. Proof of funds or letter from bank/mtg company required. Addendums required - access via mls. This property is eligible under the Freddie Mac First Look Initiative through 08/28/2014. This building only allows owner occupants.
-
1993-10-05soldstatus $84,500
ⓘ Source: listings_history table (triggers on properties + properties_extension) + one-shot
backfill from property_details.listing_events for pre-trigger history.
Tax reassessment forecast IL · Partial reset (capped growth)
- Current annual tax
- $493 · $41/mo
- Projected year-2 tax
- $700 · $58/mo
- Expected delta
- +$208/yr (+$17/mo · 42.1%)
ⓘ Screening estimate from a state-policy table — verify with the county assessor before closing.
Climate risk First Street
- Flood 1/10 Low FEMA zone X (unshaded) · 0% chance over 30 yrs
- Wildfire 3/10 Moderate
- Heat 3/10 Moderate 7 d/yr ≥102°F today · 15 d/yr by 30 yrs out
- Wind 2/10 Low 0% chance of damaging wind over 30 yrs
- Air quality 4/10 Moderate 4 unhealthy d/yr today · 5 by 30 yrs out
Nearby sold comps map
Loading sold comps map…
Walkable amenities ~0.75 mi
Loading nearby amenities…
Taxation est. · year 1
- Rental income
- $13,802
- − Mortgage interest
- −$2,241
- − Property taxes
- −$493
- − Insurance
- −$200
- − Repairs & maintenance
- −$1,104
- − Management
- −$1,104
- − HOA
- −$2,856
- − Depreciation
- −$1,164
- Taxable income
- $4,640
- Est. tax owed @ 24.0%
- −$1,114
- After-tax cash flow
- $3,723/yr
For passive investors: Depreciation is non-cash, so a rental often shows a tax loss while cash-flowing — sheltering income. Rental losses are passive: they offset passive income freely, and up to $25,000/yr can offset ordinary (W-2) income if you actively participate and your MAGI is under $100k (phasing out to $0 by $150k); unused losses carry forward. On sale, claimed depreciation is recaptured at up to 25%, and gains may owe capital-gains tax (a 1031 exchange can defer both). Figures are a year-1 estimate at your 24.0% rate — not tax advice; consult a CPA.
Schools (NCES district)
- District
- Thornton Fractional Twp Hsd 215
- NCES district ID
- 1738940
- Math proficiency
- 9% ▼ -3.00%
- Reading proficiency
- 13% ▼ -3.00%
- Median HH income
- $48,207
- Composite
- 10.27/100
- National rank
- #9793
- State rank
- #563 of 620 in IL
Livability — Lansing
- Score
- 73/100
- State rank
- #296
- US rank
- #5698
Category grades
Schools grade is shown separately in the Schools card above.
Census & demographics
- Census place
- Lansing, IL
- County
- Cook County · 4,486,803 people
- City population
- 28,806
- Metro
- Chicago-Naperville-Elgin, IL-IN-WI
- Population (ZIP)
- 28,806
- Household income
- $75,681
- Rent vs Own
- Severe rent burden
- 830.0
Population outlook (Cook County) Hauer SSP2
- Today (2025)
- 5,347,519 people
- By 2030
- 5,357,703 · +0.2%
- By 2040
- 5,324,924 · -0.4%
- By 2050
- 5,230,762 · -2.2%
- By 2075
- 4,785,735 · -10.5%
- By 2100
- 4,188,836 · -21.7%
Race, ethnicity, and origin ACS 2023
- Neighborhood character
- Diverse neighborhood (Simpson 0.65)
- Race & ethnicity
- Black 51% White 25% Hispanic / Latino 18% Two or more races 7% Asian 2%
- Hispanic origin (detail)
- Mexican 15%
- Common ancestry
- Romanian 5% Iranian 3% Lithuanian 1%
- Foreign-born
- 10% · Canada
- Languages at home
- 83% English-only · Spanish 12% Vietnamese 1% French/Haitian/Cajun 1%
Political lean MEDSL · Cook
- 2024 margin
- Solid D (+42.0) · D 70.4% · R 28.4% · Other 1.2%
- 2008→2024 swing
- -11.4pp toward R · 2008: 53.4pp · 2024: 42.0pp
- All cycles
- 2024: D+42.0 2020: D+50.3 2016: D+53.0 2012: D+49.4 2008: D+53.4
Not yet ingested
- Civics
- —
Market trends
- HPI YoY
- ▼ -151.65%
- Current HPI
- 210.3398
- Rent YoY
- —
- Metro
- Chicago-Naperville-Elgin, IL-IN-WI
- State GDP YoY
- ▲ 1.59%
- F500 in state
- 60
Industry mix (Fortune 500 HQ in IL)
| Industry | F500 HQs | Revenue |
|---|---|---|
| Insurance | 4 | $201B |
|
||
| Consumer Goods | 4 | $87B |
|
||
| Industrial Machinery | 3 | $64B |
|
||
| Healthcare | 2 | $55B |
|
||
| Retail / Pharmacy | 1 | $148B |
|
||
| Agriculture / Food | 1 | $86B |
|
||
Price history
-52.7% since first listed11 events — show timeline
- 2026-05-07 Contingent — MRED as Distributed by MLS Grid
- 2026-05-07 Relisted — MRED as Distributed by MLS Grid
- 2026-05-05 Pending — MRED as Distributed by MLS Grid
- 2026-04-24 Price Changed $40,000 MRED as Distributed by MLS Grid
- 2026-04-02 Listed $50,000 MRED as Distributed by MLS Grid
- 2014-09-23 Sold (MLS) $9,000 MRED as Distributed by MLS Grid
- 2014-09-04 Pending — MRED as Distributed by MLS Grid
- 2014-08-08 Listing Removed — MRED as Distributed by MLS Grid
- 2014-08-08 Listed $9,900 MRED as Distributed by MLS Grid
- 2014-08-08 Listed — MRED as Distributed by MLS Grid
- 1993-10-05 Sold (Public Records) $84,500 Public Records
Property tax history
-6.7%/yrLatest (2023): $493 · -51.1% YoY. Source: county tax records.
Cash-flow waterfall
monthlySold comps — $/sqft
last 12 mo · ≤1 miLoading sold comps…