3 Palomino Dr · Durango, CO
Flood risk 1/10 · Minimal
- FEMA flood zone
- X (unshaded)
- Chance of flooding over 30 yrs
- 0.0%
- Est. flood insurance / yr
- $507 – $1,088
Fire risk 6/10 · Moderate
- Est. fire insurance / yr
- $939 – $1,743
Heat risk 2/10 · Minimal
- Hot days now (above 85°F)
- 10 days/yr
- Hot days in 30 yrs
- 26 days/yr
Wind risk 1/10 · Minimal
- Chance of severe wind over 30 yrs
- —
Air-quality risk 5/10 · Moderate
- Unhealthy air days now
- 7 days/yr
- Unhealthy air days in 30 yrs
- 7 days/yr
Risk factors via First Street. Map © Google.
Why this score? — see what drove the C+ grade
The composite is a weighted blend of 9 inputs, each scored 0–100. Each bar is that input's sub-score; the figure is the points it added to the 100-point composite (weight × sub-score).
- Cash flow +30.0/30.0
- 1% rule +10.0/10.0
- DSCR +10.0/10.0
- Schools +3.4/10.0
- Livability +3.4/5.0
- Rent growth +3.2/5.0
- Condition / age +2.5/5.0
- ARV discount +0.0/15.0
- Appreciation +0.0/10.0
$134,500
🖨 Deal sheet 📄 Offer letter ✓ Due diligence
Listing remarks MLS
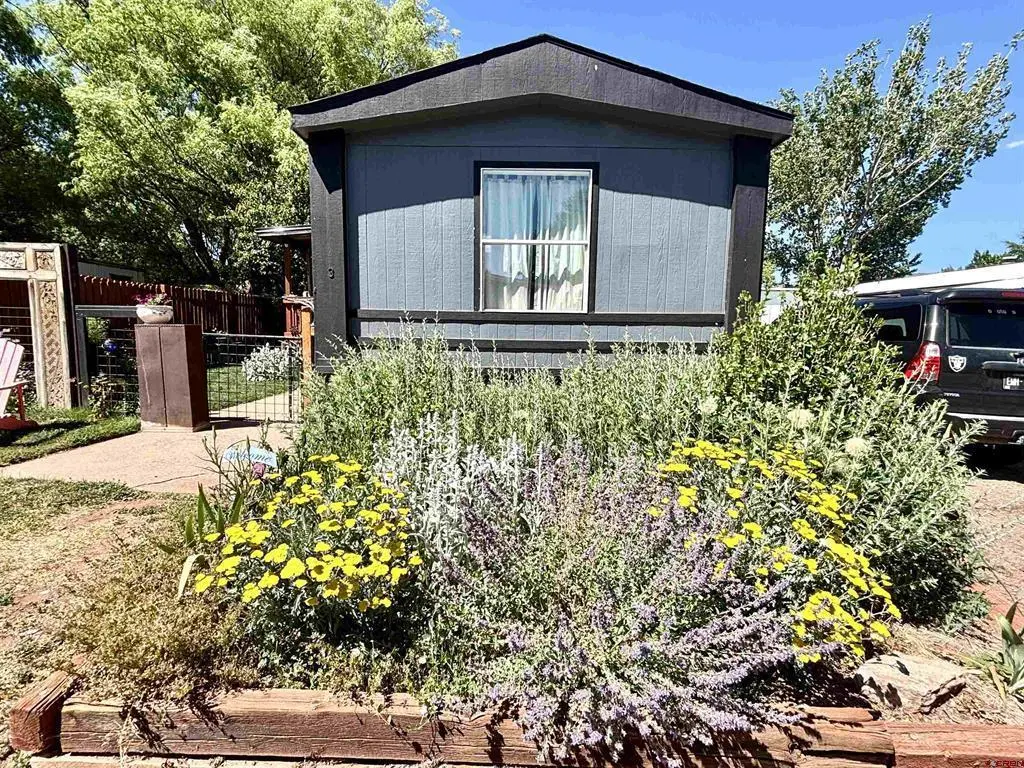
3 Bedroom 2 bath located in Durango Regency. Lot rent only $755 includes water, sewer, trash pickup, and snow removal.
Key facts
- Bright kitchen
- Fenced yard
- Colorful flowers
Tags
Property features AI
Exterior
- Home design: Single-family residential use; Zoned residential single family
Interior
- Bedrooms: 2 bedrooms
- Bathrooms: 2 full bathrooms
- Interior features: Unfurnished
Neighborhood map
What this means for you Summary
Snapshot
- This is a 3-bed/2.0-bath manufactured listed at $134k.
Deal economics
- At list price, monthly cash flow is $799 ($10k/yr) — positive.
- The deal already cash-flows at list — no discount required.
- Meets the 1% rule at list price ($2k rent vs $134k).
- Cap rate 13.4% vs local median 1.1% in Durango — top-decile yield for the area; either an underpriced asset or a hidden risk that comps aren't pricing in. Stress-test before assuming the spread holds.
Location & tenants
- Location reads 68/100 on livability (#106 in CO) — a middle-class / working-renter tenant base. Strengths: amenities A-, schools B+, employment B+; Watch: commute F, cost of living F.
- Durango School District No. 9-R (town): math 27% / reading 49% proficiency, ranked #30 of 86 in CO (top 35%) — families likely to look elsewhere, expect single-tenant / working-renter base with shorter leases.
- Market conditions: Rents rising (+2.9%/yr); 580 active listings in the ZIP; solid renter incomes; 306 units permitted in La Plata County in 2024 (93 in 5+ unit buildings).
- This rent runs 31% of the median local income ($84k/yr) — at the standard rent-burdened threshold; future hikes will face affordability resistance.
Forward outlook
- Local home prices are declining (-3.0%/yr); year-one equity from $930 of loan paydown is wiped out by about $4k of value loss. Plan a longer hold.
- La Plata County population projected at +25% by 2050 — long-run rental-demand tailwind backs the buy-and-hold thesis.
- At projected returns (-3.0% appreciation + 2.9% rent growth), your $38k cash investment doubles in ~5 years — after that, you're playing with house money.
Negotiation context
- Only 11 days on market — expect competitive offers; lowballing is unlikely to land.
- 4 sale attempts since 8y ago with the ask held roughly flat each time — persistent listings suggest the price (not the market) is what's stuck; bring a comps-based counter.
- Current owner paid $85k; list at $134k implies a 58% gain — meaningful room to come down on a strong offer.
Risks & watch-outs
- Climate carrying-cost: major wildfire risk — expect insurance premiums to compound above CPI over the hold.
Questions for the listing agent
- Is there a deadline driving the sale (1031 exchange, divorce, estate, relocation)? That informs how much negotiation room exists.
- Schools are B-rated — typically a magnet for longer-tenancy family renters. What's the average tenant stay here, and is there a school-zone premium baked into asking?
- What's the average days-on-market for RENTAL listings here right now (not sales)? A rising rental-DOM trend means longer vacancies and softer asking-rent achievability than the comps imply.
- What's the recent tenant-quality profile in this submarket — average credit score on applications, eviction rate, late-payment / NSF rate, and stable-employment percentage? A property-management company in the area should have these aggregated.
- How much new for-sale + rental construction is in the pipeline within 1–3 miles? Heavy new supply typically softens prices + rents 12–24 months out; constrained supply supports both.
Investment metrics
- 1% rule
- 1.63% ✓
- Cap rate
- 13.42%
- Cash-on-cash
- 25.45%
- DSCR
- 2.13
- GRM
- 5.1
CMA / ARV
- ARV (on-the-fly)
- $108,336
- Comps found
- 12
Show comp detail 12 sales within ~0.75 mi
| Address | Dist | Beds/Ba | Sqft | Sold | Price | $/sf | Match |
|---|---|---|---|---|---|---|---|
| 1 Cherokee Strip | 0.03mi | 3/2.0 | 1,008 (+3%) | 16mo | $85,000 | $84 | 80 |
| 13 Palomino Dr | 0.03mi | 2/3.0 (-1) | 1,056 (+8%) | 1mo | $100,000 | $95 | 76 |
| 13 Raspberry Cir | 0.12mi | 3/2.0 | 924 (-5%) | 12mo | $102,800 | $111 | 76 |
| 32222 Highway 550 #36 | 0.35mi | 3/2.0 | 1,008 (+3%) | 16mo | $94,999 | $94 | 65 |
| 32222 Highway 550 #7 | 0.35mi | 2/1.0 (-1) | 910 (-7%) | 2mo | $114,300 | $126 | 62 |
| 32222 Highway 550 #41 | 0.35mi | 2/1.0 (-1) | 910 (-7%) | 3mo | $99,900 | $110 | 61 |
| 8124 County Road 203 Trlr M | 0.52mi | 2/2.0 (-1) | 1,012 (+4%) | 8mo | $130,000 | $128 | 58 |
| 8124 County Road 203 Unit K | 0.51mi | 2/2.0 (-1) | 1,050 (+8%) | 1mo | $115,000 | $110 | 58 |
| 32222 Highway 550 #14 | 0.35mi | 2/2.0 (-1) | 899 (-8%) | 11mo | $134,900 | $150 | 56 |
| 31722 Highway 550 #39 | 0.33mi | 2/2.0 (-1) | 924 (-5%) | 20mo | $85,000 | $92 | 54 |
| 32222 Highway 550 #10 | 0.35mi | 3/2.0 | 1,096 (+12%) | 14mo | $128,900 | $118 | 51 |
| 31722 N Highway 550 #55 | 0.33mi | 2/1.0 (-1) | 840 (-14%) | 14mo | $115,000 | $137 | 41 |
Match score weights: distance 35% · size 25% · config 20% · recency 20%. Top-matched comps best support the ARV.
Projected returns pro-forma
-3.0% appreciation · 2.94% rent growth · sell at horizon
- IRR
- 19.0%
- Equity multiple
- 1.77×
- Total profit
- $28,980
- Equity at exit
- $20,054
- IRR
- 27.3%
- Equity multiple
- 3.40×
- Total profit
- $90,337
- Equity at exit
- $11,629
Cash invested: $37,660 (down + closing). Projections, not guarantees.
Landlord ↔ Tenant lean methodology
- Overall (STATE)
- 38 Tenant-Leaning
- State Colorado
- 38 Tenant-Leaning · D+4
- County
- — inherits STATE
- City
- — inherits STATE
ZIP-level market 81301
- Rents YoY
- 2.9%
- Active inventory
- 580
- Price-to-rent
- 5.1×
Monthly cashflow live
- Estimated rent
- $2,188 medium interval (Pro) →
- Mortgage (P&I)
- −$705
- Tax est. 1.5%
- −$168 /mo · $2,018/yr
- Insurance
- −$56
- HOA
- −$0
- Vacancy / Maint / Mgmt
- −$459
- Net cashflow
- $799
Break-even live
UW: 25.0% down · 7.5% · 30yr · 1.5% tax · 5.0% vac · 8.0% maint · 8.0% mgmt
Financing live
Cash to close
- Down payment
- $33,625
- Closing costs
- $4,035
- Reserves months
- —
- Total cash needed
- —
Loan-product check · same deal, 3 products live
Conventional
25% down · 7.5% · 30yr
- Down + closing
- —
- Monthly P&I
- —
- Monthly cashflow
- —
- DSCR
- —
- Eligible?
- —
Personal DTI + credit; lowest rate.
DSCR
20% down · 8.5% · 30yr
- Down + closing
- —
- Monthly P&I
- —
- Monthly cashflow
- —
- DSCR
- —
- Eligible?
- —
No personal income docs; deal must DSCR.
Hard money
10% down · 12.0% · 12mo
- Down + closing
- —
- Monthly P&I
- —
- Monthly cashflow
- —
- DSCR
- —
- Eligible?
- —
Short-term bridge; refi at stabilization.
Listing history 9 events
-
2026-06-19days on market $134,500 Active 11 DOM
-
2026-06-18days on market $134,500 Active 10 DOM
-
2026-06-17days on market $134,500 Active 9 DOM
-
2026-06-16days on market $134,500 Active 8 DOM
-
2026-06-15days on market $134,500 Active 7 DOM
-
2026-06-14days on market $134,500 Active 5 DOM
-
2026-06-12days on market $134,500 Active 4 DOM
-
2026-06-09remarks 699-char remark
-
2026-06-09$134,500 Active 1 DOM
ⓘ Source: listings_history table (triggers on properties + properties_extension) + one-shot
backfill from property_details.listing_events for pre-trigger history.
Climate risk First Street
- Flood 1/10 Low FEMA zone X (unshaded) · 0% chance over 30 yrs
- Wildfire 6/10 Major
- Heat 2/10 Low 10 d/yr ≥85°F today · 26 d/yr by 30 yrs out
- Wind 1/10 Low
- Air quality 5/10 Major 7 unhealthy d/yr today · 7 by 30 yrs out
Nearby sold comps map
Loading sold comps map…
Walkable amenities ~0.75 mi
Loading nearby amenities…
Taxation est. · year 1
- Rental income
- $26,252
- − Mortgage interest
- −$7,534
- − Property taxes
- −$2,018
- − Insurance
- −$672
- − Repairs & maintenance
- −$2,100
- − Management
- −$2,100
- − Depreciation
- −$3,913
- Taxable income
- $7,915
- Est. tax owed @ 24.0%
- −$1,900
- After-tax cash flow
- $7,686/yr
For passive investors: Depreciation is non-cash, so a rental often shows a tax loss while cash-flowing — sheltering income. Rental losses are passive: they offset passive income freely, and up to $25,000/yr can offset ordinary (W-2) income if you actively participate and your MAGI is under $100k (phasing out to $0 by $150k); unused losses carry forward. On sale, claimed depreciation is recaptured at up to 25%, and gains may owe capital-gains tax (a 1031 exchange can defer both). Figures are a year-1 estimate at your 24.0% rate — not tax advice; consult a CPA.
Schools (NCES district)
- District
- Durango School District No. 9-R
- NCES district ID
- 0803480
- Math proficiency
- 27% ▼ -4.00%
- Reading proficiency
- 49% ▼ -1.00%
- Median HH income
- $58,711
- Composite
- 33.58/100
- National rank
- #5420
- State rank
- #30 of 86 in CO
Livability — Durango
- Score
- 68/100
- State rank
- #106
- US rank
- #9262
Category grades
Schools grade is shown separately in the Schools card above.
Census & demographics
- County
- La Plata County · 40,010 people
- City population
- 29,774
- Metro
- Durango, CO
- Population (ZIP)
- 29,774
- Household income
- $83,943
- Rent vs Own
- Severe rent burden
- 1194.0
Population outlook (La Plata County) Hauer SSP2
- Today (2025)
- 62,781 people
- By 2030
- 66,492 · +5.9%
- By 2040
- 72,944 · +16.2%
- By 2050
- 78,543 · +25.1%
- By 2075
- 89,403 · +42.4%
- By 2100
- 94,984 · +51.3%
Race, ethnicity, and origin ACS 2023
- Neighborhood character
- Predominantly White (81%)
- Race & ethnicity
- White 81% Hispanic / Latino 8% Two or more races 7% Native American 6%
- Hispanic origin (detail)
- Mexican 4%
- Common ancestry
- Slovak 4% Italian 3% Portuguese 2%
- Foreign-born
- 2% · Canada
- Languages at home
- 92% English-only · Spanish 5% German/W. Germanic 1%
Political lean MEDSL · La Plata
- 2024 margin
- D (+18.6) · D 58.0% · R 39.3% · Other 2.8%
- 2008→2024 swing
- +2.4pp toward D · 2008: 16.3pp · 2024: 18.6pp
- All cycles
- 2024: D+18.6 2020: D+17.7 2016: D+9.2 2012: D+8.8 2008: D+16.3
Not yet ingested
- Civics
- —
Market trends
- HPI YoY
- ▼ -651.69%
- Current HPI
- 223.832
- Rent YoY
- ▲ 2.94%
- Metro
- Durango, CO
- State GDP YoY
- ▲ 1.95%
- F500 in state
- 14
Industry mix (Fortune 500 HQ in CO)
| Industry | F500 HQs | Revenue |
|---|---|---|
| Technology Distribution | 1 | $31B |
|
||
| Food / Agriculture | 1 | $18B |
|
||
| Packaging | 1 | $14B |
|
||
| Healthcare | 1 | $13B |
|
||
| Energy | 1 | $10B |
|
||
| Technology | 1 | $4B |
|
||
Price history
+253.9% since first listed7 events — show timeline
- 2026-06-08 Listed $134,500 cren
- 2024-04-23 Sold (MLS) $85,000 cren
- 2024-04-03 Relisted — cren
- 2024-03-21 Listing Removed — cren
- 2024-03-20 Listed $89,900 cren
- 2018-06-11 Sold (MLS) $35,000 cren
- 2018-05-10 Listed $38,000 cren
Property tax history
+10.3%/yrLatest (2025): $174 · +245.3% YoY. Source: county tax records.
Cash-flow waterfall
monthlySold comps — $/sqft
last 12 mo · ≤1 miLoading sold comps…